Synthesis, Spectral Characterization And Antibacterial Studies of Mixed Ligand La(III) and Ce(III) Complexes Derived From 1-nitroso-2-naphthol and Some Amino Acids.
Ganesh Anant Thakur*, Uttam Narayan Dhaigude and Pramod Bhagawan Thakur
Department of Chemistry, Rayat Shikshan Sanstha’s, Mahatma Phule Arts, Science and Commerce College, Panvel, Raigad, Maharashtra, 410206, India.
Corresponding Author E-mail: ganeshthakur68@yahoo.co.in
DOI : http://dx.doi.org/10.13005/ojc/360406
Article Received on : 20 Jun 2020
Article Accepted on : 28 July 2020
Article Published : 20 Jul 2020
The synthesis of mixed ligand La(III) and Ce(III) complexes with formula [M(1N2N)2∙(L)·2H2O] is reported by using 1-nitroso-2-naphthol (1N2N) as a primary ligand and L-phenylalanine, L-threonine (HL) as secondary ligands. The structures of reported complexes were established by UV-Visible, infrared spectroscopic techniques, magnetic susceptibility measurements, molar conductance study, elemental analysis and thermal studies. The conductance study showed non-electrolytic nature of complexes. The thermal study was found in accordance with structure of complexes. The metal-ligand coordination was confirmed by FT-IR spectral study. Furthermore the lanthanum and cerium complexes were found diamagnetic and paramagnetic in nature respectively. The intraligand and LMCT transitions were confirmed by UV-Visible spectral study. The study to investigate antibacterial nature of compounds was done in vitro against E. coli, S. typhi Gram-negative and S. aureus, C. diphtheria Gram-positive bacteria.
KEYWORDS:Antibacterial Activity; Lanthanum; Cerium; Amino Acid; 1-nitroso-2-naphthol
Download this article as:| Copy the following to cite this article: Thakur G. A, Dhaigude U. N, Thakur P. B. Synthesis, Spectral Characterization And Antibacterial Studies of Mixed Ligand La(III) and Ce(III) Complexes Derived From 1-nitroso-2-naphthol and Some Amino Acids. Orient J Chem 2020;36(4). |
| Copy the following to cite this URL: Thakur G. A, Dhaigude U. N, Thakur P. B. Synthesis, Spectral Characterization And Antibacterial Studies of Mixed Ligand La(III) and Ce(III) Complexes Derived From 1-nitroso-2-naphthol and Some Amino Acids. Orient J Chem 2020;36(4). Available from: https://bit.ly/2WCzSPN |
Introduction
The coordination compounds comprising of transition metals containing amino acid ligands known for their biological importance such as cytotoxic and antimicrobial activities.1 The spectrophotometric determination of metal ions by using 1-nitroso-2-naphthol have been investigated2. The complexes of some transition metals with 1-nitroso-2-naphthol and L-phenylalanine exbihit potent antibacterial activity.3 The lanthanide complexes with 1-nitroso-2-naphthol and trioctylphosphine oxide have been reported.4 The metal complexes of lanthanum (III) possess significant antibacterial activity.5 The synthesis, spectral characterization and antibacterial study of cerium complexes have been reported.6-8
Therefore , it was decided to study the complexation and antibacterial activity of synthesized complexes of lanthanum and cerium. In present work, we explore the synthesis, strucutural elucidation and antibacterial behaviour of lanthanum (III) and cerium (III) mixed ligand complexes by adopting primary ligand 1-nitroso-2-naphthol and L-phenylalanine, L-threonine secondary ligands.
Materials and Methods
Materials
The analytical grade lanthanum(III) chloride heptahydrate, cerium(III) chloride heptahydrate metal salts and 1-nitroso-2-naphthol, L-phenylalanine, L-threonine ligands were used without further purification. The used solvents for characterization of complexes were distilled and purified according to standard procedure.9,10
Instrumentation
The C, H, N composition in lanthanum and cerium complexes were determined on Thermo Finnigan elemental Analyzer. The lanthanum content from their complexes was estimated by complexometric method.11-13 Similarly, the amount of cerium in their complexes were determined by the gravimetric method.14 The electronic spectra of 10-3 molar solution of La(III) and Ce(III) complexes in DMF were recorded on UV/VIS-1800 spectrophotometer. The electrical conductivities of metal complexes were measured with digital conductivity meter (EQ-667 model). FT-IR spectra of synthesized complexes, primary and secondary ligands were recorded on Shimadzu FT-IR spectrophotometer using KBr disc in 400-4000-cm-1range. TG-DTA Perkin-Elmer Diamond instrument was used for thermal study of complexes. The magnetic susceptibility of reported complexes in present work were measured using Gouy’s balance adopting Hg[Co(SCN)4] as a calibrant.
Preparation of Mixed Ligand Complexes of Lanthanum and Cerium
The 20 mL solution of 1-nitroso-2-naphthol in ethyl alcohol (346 mg, 2mmol) was slowly added in 10 mL aqueous solution of metal salts (371mg LaCl3.7H2O, 372mg CeCl3.7H2O, 1mmol). The resuting mixture in 1:2 molar proportion was refluxed in water bath for 10 minutes. To this refluxed solution, 10 mL solution of L-phenylalanine / L-threonine (1mmol) in distilled water was added. The resulting solution with 1:2:1 molar propportion was kept in water bath, stirred well and warmed for 10 minutes. The complex formation was accomplished by adjusting the 7.0 pH of the reaction mixture with slow addition of aqueous ammonia. The obtained precipitate was filtered, successively washed by water and then small amount of ethyl alcohol. In oven, the final coloured product was dried and used for spectral characterization and antibacterial study.
Antibacterial Study
The synthesized complexes of lanthanum and cerium was assayed for their antibacterial activity against Escherichia coli, Corynebacterium diphtheria, Salmonella typhi and Staphylococcus aureus bacteria by agar cup method15,16 and serial tube dilution method.17
Agar Cup Method
The petriplate was filled with sterile nutrient agar containing test organism at 5mm height and was kept to solidify. Further single hole was punched in middle portion of petriplate employing sterile cork borer with 8mm internal diameter. The 1ppm DMSO solution of metal complexes was filled to this hole and petriplate was incubated for 24 hrs at 37 °C. Thereafter, zone of inhibition surrounding to hole was measured in mm and noted as activity of complexes. Finally, activity of metal complexes were compared with the activity of standard tetracycline compound.
Tube Dilution Method
The 10 mg of synthesized lanthanum and cerium complexes were dissolved in 10 mL DMSO. In sterile Muller Hinton broth (MHB), bacterial inoculums were prepared and incubated at 37 °C for 24 hrs. The 5 mL bacterial inoculums were dispersed in each test tubes of borosilicate . To these tubes, solution of test compound in DMSO (10mg/10mL) was mixed to obtain final concentration in the range of 1 to 300 μg/mL. Further, inoculums (0.1mL) of respective bacteria was inoculated in the tubes. Again tubes were incubated at 37 °C for 24 hrs. All tubes were examined on next day for absence or presence of bacterial growth .The concentration at which visible growth was not observed was considered as MIC. In this study, tetracycline compound was used as a control. The result of complexes were compared with tetracycline control which was screened simultaneously.
Results and Discussion
The lanthanum complexes were green in color whereas cerium complexes were brown in color. All complexes were partly soluble in DMF, DMSO and were unsolvable in solvents like water, benzene, tolune, methanol, ethyl alcohol etc. Synthesized complexes of lanthanum and cerium were thermally stable (Table-1), amorphous nonhygroscopic solids. The elemental analysis of lanthanum and cerium complexes were studied. The estimated data is presented in Table 2. The elemental analysis data was in accordance as of 1:2:1 type formula
[La(1N2N)2∙(L)∙2H2O] and [Ce(1N2N) 2∙(L)∙2H2O].
The general reaction of formation of mixed ligand complexes of lanthanum and cerium is shown below,
MCl3∙7H2O + 2(1N2N) + HL → [M(1N2N)2·(L)·2H2O] + 3HCl + 5H2O
Where, M = lanthanum chloride heptahydrate/ cerium chloride heptahydrate, 1N2N = 1-nitroso-2-naphthol , HL = L-phenylalanine/ L-threonine.
Table 1: The decomposition temperature, empirical formula, molecular weight and color of synthesized lanthanum and cerium metal complexes
|
Complex |
Decomposition Temperature (oC) |
Empirical Formula |
Molecular Weight (gms) |
Color |
|
[La(1N2N)2·(Phe)·2H2O] |
220 |
LaC29H26N3O8 |
683.44 |
Green |
|
[La(1N2N)2·(Thr)·2H2O] |
205 |
LaC24H24N3O9 |
637.37 |
Green |
|
[Ce(1N2N)2·(Phe)·2H2O] |
215 |
CeC29H26N3O8 |
684.65 |
Brown |
|
[Ce(1N2N)2·(Thr)·2H2O] |
220 |
CeC24H24N3O9 |
638.58 |
Brown |
1N2N = 1-nitroso-2-naphthol, Phe = phenylalanine, Thr = threonine
Table 2: Elemental analysis data of lanthanum and cerium complexes
|
Complex |
Elemental Analysis Found (Calculated) |
|||
|
% M |
% C |
% N |
% H |
|
|
[La(1N2N)2·(Phe)·2H2O] |
20.30 (20.32) |
50.94 (50.96) |
6.14 (6.15) |
3.81 (3.84) |
|
[La(1N2N)2·(Thr)·2H2O] |
21.78 (21.79) |
45.22 (45.23) |
6.58 (6.59) |
3.80 (3.79) |
|
[Ce(1N2N)2·(Phe)·2H2O] |
20.47 (20.46) |
50.85 (50.87) |
6.12 (6.14) |
3.82 (3.83) |
|
[Ce(1N2N)2·(Thr)·2H2O] |
21.93 (21.94) |
45.13 (45.14) |
6.55 (6.58) |
3.77 (3.79) |
Molar Conductance and Magnetic Study
The molar conductance values of lanthanum and cerium metal complexes was measured in DMF having 0.001M concentration. The obtained data sumarized in Table-3 indicates that all synthesized complexes of lanthanum and cerium were non-electrolytes.18
The values of magnetic moment of lanthanum and cerium complexes (Table -3) was determined from magnetic susceptibility measurements after utilizing diamagnetic corrections which indicates that lanthanum complexes were diamagnetic19,20 in nature and cerium complexes were paramagnetic21-23 in nature.
Table 3: Molar conductance and magnetic moment values of synthesized complexes of lanthanum and cerium metal.
|
Compex |
Molar conductance (Mhos cm2 mol-1) |
Xm |
Xg |
µeff (B.M.) |
|
[La(1N2N)2·(Phe)·2H2O] |
0.157 x 10⁻³ |
– 2.10 x 10⁻⁴ |
– 3.08 x 10⁻⁷ |
Diamagnetic |
|
[La(1N2N)2·(Thr)·2H2O] |
0.156 x 10⁻³ |
– 1.94 x 10⁻⁴ |
– 3.05 x 10⁻⁷ |
Diamagnetic |
|
[Ce(1N2N)2·(Phe)·2H2O] |
0.154 x 10⁻³ |
1.04 x 10⁻³ |
1.53 x 10⁻⁶ |
1.729 |
|
[Ce(1N2N)2·(Thr)·2H2O] |
0.151 x 10⁻³ |
1.24 x 10⁻³ |
1.94 x 10⁻⁶ |
1.850 |
UV-Visible Spectroscopy
The UV-Visible spectrum of 10-3M solution of lanthanum and cerium complexes were recorded in DMF. The found data presented in Table-4 showed three absorption bands in the range 263-266 nm, 331-370 nm and 384-423 nm are assigned to π → π*, n → π* and LMCT transitions.24-27
Table 4: UV-Visible spectral Data of complexes of lanthanum and cerium.
|
Complex |
ν (cm-1) |
λ (nm) |
Proposed Assignments |
|
[La(1N2N)2·(Phe)·2H2O] |
37594 |
266 |
π → π* |
|
27027 |
370 |
n → π* |
|
|
23866 |
419 |
LMCT |
|
|
[La(1N2N)2·(Thr)·2H2O] |
38023 |
263 |
π → π* |
|
27100 |
369 |
n → π* |
|
|
23641 |
423 |
LMCT |
|
|
[Ce(1N2N)2·(Phe)·2H2O] |
37879 |
264 |
π → π* |
|
30211 |
331 |
n → π* |
|
|
25000 |
400 |
LMCT |
|
|
[Ce(1N2N)2·(Thr)·2H2O] |
37736 |
265 |
π → π* |
|
30030 |
333 |
n → π* |
|
|
36042 |
384 |
LMCT |
Infra-Red Spectra
Table-5 contains FT-IR spectral data of complexes of lanthanum and cerium. The data shows peak at 3435-3433 cm-1 of hydroxy group of water. The absence of peak at 3448 cm-1 indicates deprotonation of hydroxy group of 1-nitroso-2-naphthol during complexation. Furthermore, the presence of 1-nitroso-2-naphthol moiety in the complexes was indicated by 1155 cm-1 peak.28 Also the peak at 1554 cm-1 and 1211 cm-1 for nitroso and nitrile group respectively indicates that 1-nitroso-2-naphthol is coordinated with La and Ce metal ions via nitrogen atom. In addition to this, the coordination of amino group was confirmed from the band in 3120-3113 cm-1 range and at 3061 cm-1 as well as nitrile peak at 839 cm-1. The presence of -COOH group of amino acid was identified from peak obtained at 1600 cm-1 and 1400 cm–1. Finally, the metal-nitrogen and metal-oxygen bonding was comfirmed from weak bands in 524-522 cm-1 range and at 636 cm-1.
Table 5: FT-IR spectroscopy data of synthesized lanthanum and cerium complexes in cm-1
|
Complex |
ν (C=O) (A.a.) |
ν (C-N) (A.a.) |
ν (C-O) (A.a.) |
ν (N-H) Sym. (A.a.) |
ν (N-H) Asym. (A.a.) |
ν (O-H) H2O |
ν (C-N) 1N2N |
ν (N=O) 1N2N |
ν (C-O) 1N2N |
ν (M-N) |
ν (M-O) |
|
[La(1N2N)2·(Phe)·2H2O] |
1616 (s) |
839 (m) |
1400 (w) |
3061 (w) |
3120 (w) |
3435 (b) |
1211 (m) |
1554 (s) |
1155 (w) |
524 (w) |
636 (w) |
|
[La(1N2N)2·(Thr)·2H2O] |
1616 (s) |
839 (m) |
1400 (w) |
3061 (w) |
3113 (w) |
3433 (b) |
1211 (m) |
1554 (s) |
1155 (w) |
522 (w) |
636 (w) |
|
[Ce(1N2N)2·(Phe)·2H2O] |
1616 (s) |
839 (m) |
1400 (w) |
3061 (w) |
3120 (w) |
3435 (b) |
1211 (m) |
1554 (s) |
1155 (w) |
524 (w) |
636 (w) |
|
[Ce(1N2N)2·(Thr)·2H2O] |
1616 (s) |
839 (m) |
1400 (w) |
3061 (w) |
3113 (w) |
3433 (b) |
1211 (m) |
1554 (s) |
1155 (w) |
522 (w) |
636 (w) |
b = broad band, m = medium band, w = weak band, s = strong band, A.a = Amino Acids , 1N2N = 1-nitroso-2-naphthol, Sym. = Symmetric, Asym. = Asymmetric
Thermal Studies
The TG and DTA data of synthesized La3+ and Ce3+ complexes is listed in Table 6 which showed steady weightloss with increasing temperature. In TG study of lanthanum complexes the loss of two coordinated water molecules, amino acid and 1-nitroso-2-naphthol moiety was observed at 110-171 °C, 205-285 °C and 310-648 °C respectively. Furthermore in DTA study, endothermic peak at 110-171 °C, a small exotherm at 205-285 °C and broad exotherm in the range 310-648 °C attributed to decomposition two coordinated water molecules, amino acid and 1-nitroso-2-naphthol moiety of lanthanum complexes respectively. The constant weight plateau in thermogram after 648 °C indicates acomplishment of the reaction and forms metal oxide as final product.29-31 The XRD study32,33 was used to confirm the formation of La2O3 as a final product.
Similarly, in TG study of cerium complexes the loss of two coordinated water molecules, amino acid and 1-nitroso-2-naphthol moiety was observed at 110-162 °C, 214-300 °C and 400-548 °C respectively. Furthermore in DTA study, endothermic peak at 110-162 °C, a small exotherm at 214-300 °C and broad exotherm in the range 400-548 °C attributed to decomposition two coordinated water molecules, amino acid and 1-nitroso-2-naphthol moiety of cerium complexes respectively. The constant weight plateau in thermogram after 548 °C indicates acomplishment of the reaction and forms metal oxide29-31 as final product. The XRD study32-33 was used to confirm the formation of Ce2O3 as a final product. The typical TG and DTA curves of reported lanthanum and cerium complexes are shown in Figure:1-8 respectively.
Table 6: Thermal analysis data of lanthanum(III) and cerium (III) complexes
|
Compound |
Temp. Range (℃) |
Lost Species |
% Mass Loss |
Residue |
|
|
Found |
Calculated |
||||
|
[La(1N2N)2·(Phe)·2H2O] |
115-171 |
Two molecules of water |
5.34 |
5.27 |
[La(1N2N)2(Phe)] |
|
223-285 |
Amino acid |
24.66 |
24.02 |
[La(1N2N)2] |
|
|
361-626 |
Two molecules of 1N2N |
49.34 |
50.08 |
[La2O3] |
|
|
[La(1N2N)2·(Thr)·2H2O] |
110-160 |
Two molecules of water |
5.34 |
5.65 |
[La(1N2N)2(Thr)] |
|
205-271 |
Amino acid |
19.33 |
18.53 |
[La(1N2N)2] |
|
|
310-648 |
Two molecules of 1N2N |
54.67 |
53.71 |
[La2O3] |
|
|
[Ce(1N2N)2·(Phe)·2H2O] |
120 – 162 |
Two molecules of water |
5.34 |
5.26 |
[Ce(1N2N)2(Phe)] |
|
214 – 300 |
Amino acid |
25.32 |
23.98 |
[Ce(1N2N)2] |
|
|
400 – 548 |
Two molecules of 1N2N |
48.01 |
49.99 |
[Ce2O3] |
|
|
[Ce(1N2N)2·(Thr)·2H2O] |
110 – 145 |
Two molecules of water |
5.34 |
5.65 |
[Ce(1N2N)2(Thr)] |
|
220 – 285 |
Amino acid |
17.99 |
18.49 |
[Ce(1N2N)2] |
|
|
400 – 510 |
Two molecules of 1N2N |
55.34 |
53.60 |
[Ce2O3] |
|
![Figure 1: TG Curve of [La(1N2N)2•(Phe)•2H2O]](http://www.orientjchem.org/wp-content/uploads/2020/07/Vol36No4_Syn_Gan_Fig1-150x150.jpg) |
Figure 1: TG Curve of [La(1N2N)2·(Phe)·2H2O] |
![Figure 2: TG Curve of [La(1N2N)2•(Thr)•2H2O]](http://www.orientjchem.org/wp-content/uploads/2020/07/Vol36No4_Syn_Gan_Fig2-150x150.jpg) |
Figure 2: TG Curve of [La(1N2N)2·(Thr)·2H2O] |
![Figure 3: DTA Curve of [La(1N2N)2•(Phe)•2H2O]](http://www.orientjchem.org/wp-content/uploads/2020/07/Vol36No4_Syn_Gan_Fig3-150x150.jpg) |
Figure 3: DTA Curve of [La(1N2N)2·(Phe)·2H2O] |
![Figure 4: DTA Curve of [La(1N2N)2•(Thr)•2H2O]](http://www.orientjchem.org/wp-content/uploads/2020/07/Vol36No4_Syn_Gan_Fig4-150x150.jpg) |
Figure 4: DTA Curve of [La(1N2N)2·(Thr)·2H2O] Click here to View Figure |
![Figure 5: TG Curve of [Ce(1N2N)2•(Phe)•2H2O]](http://www.orientjchem.org/wp-content/uploads/2020/07/Vol36No4_Syn_Gan_Fig5-150x150.jpg) |
Figure 5: TG Curve of [Ce(1N2N)2·(Phe)·2H2O] Click here to View Figure |
![Figure 6: TG Curve of [Ce(1N2N)2•(Thr)•2H2O]](http://www.orientjchem.org/wp-content/uploads/2020/07/Vol36No4_Syn_Gan_Fig6-150x150.jpg) |
Figure 6: TG Curve of [Ce(1N2N)2·(Thr)·2H2O] |
![Figure 7: DTA Curve of [Ce(1N2N)2·(Phe)·2H2O]](http://www.orientjchem.org/wp-content/uploads/2020/07/Vol36No4_Syn_Gan_Fig7-150x150.jpg) |
Figure 7: DTA Curve of [Ce(1N2N)2·(Phe)·2H2O] |
![Figure 8: DTA Curve of [Ce(1N2N)2•(Thr)•2H2O]](http://www.orientjchem.org/wp-content/uploads/2020/07/Vol36No4_Syn_Gan_Fig8-150x150.jpg) |
Figure 8: DTA Curve of [Ce(1N2N)2·(Thr)·2H2O] |
From the observations of physico-chemical and spectral study data, the structure of reported mixed ligand complexes of lanthanum and cerium can be represented as shown in Figure 9, 10, 11, 12 respectively.
![Figure 9: Anticipated representation of [La(1N2N)2•(Phe)•2H2O]](http://www.orientjchem.org/wp-content/uploads/2020/07/Vol36No4_Syn_Gan_Fig9-150x150.jpg) |
Figure 9: Anticipated representation of [La(1N2N)2·(Phe)·2H2O] |
![Figure 10: Anticipated representation of [La(1N2N)2•(Thr)•2H2O]](http://www.orientjchem.org/wp-content/uploads/2020/07/Vol36No4_Syn_Gan_Fig10-150x150.jpg) |
Figure 10: Anticipated representation of [La(1N2N)2·(Thr)·2H2O] |
![Figure 11: Anticipated representation of [Ce(1N2N)2•(Phe)•2H2O]](http://www.orientjchem.org/wp-content/uploads/2020/07/Vol36No4_Syn_Gan_Fig11-150x150.jpg) |
Figure 11: Anticipated representation of [Ce(1N2N)2·(Phe)·2H2O] |
![Figure 12: Anticipated representation of [Ce(1N2N)2•(Thr)•2H2O]](http://www.orientjchem.org/wp-content/uploads/2020/07/Vol36No4_Syn_Gan_Fig12-150x150.jpg) |
Figure 12: Anticipated representation of [Ce(1N2N)2·(Thr)·2H2O] |
Antibacterial Study
The agar cup and serial tube dilution method was adopted to evaluate the antibacterial activity of synthesized complexes of lanthanum and cerium against C.diphtheria, E.coli, S.aureus and S. typhi respectively. In agar cup method, the zone of inhibition of test compounds against selected bacteria was measured in mm and recorded in Table-7 and Figure-13. The result of agar cup method showed that all synthesized compounds of lanthanum and cerium were more sensitive against S. typhi and S. aureus as related to coli and C. diphtheria.
In tube dilution method, minimum inhibition concentration of metal complexes, metal salts, tetracycline standard compound and 1-nitroso-2-naphthol ligand were studied against selected bacterial strain and presented in Table-8. The MIC of synthesized lanthanum complexes and lanthanum metal salts was found in the range 10-35 μg/mL and 50-100 μg/mL respectively. Similarly, MIC of synthesized cerium complexes, cerium metal salts and 1-nitroso-2-naphthol ligand was observed in the range of 10-35 μg/mL, 75-150 μg/mL and 75-200 μg/mL respectively. The obtained result show that synthesized compounds were more active agaist S. typhi and S. aureus as related to E. coli and C. diphtheria. Further, synthesized compounds show moderate antibacterial activity as related to tetracycline standard compound.
All compounds of lanthanum and cerium possesses higher antibacterial activity as compared only to ligand and metal salts. The antibacterial activity enhancement in metal compounds is because of chelate effect. The chelate effect decreses the polar nature of metal ions in the complexes and increases the hydrophobic character of metal chelates that allows the diffusion of compound through lipid layer of microorganisms34-35.
Table 7: Antibacterial activity (mm) of synthesized complexes of lanthanum and cerium by agar cup method.
|
Compound |
Zone of Inhibition (mm) |
|||
|
E.coli |
S.typhi |
C.diptheriae |
S.aureus |
|
|
[La(1N2N)2·(Phe)·2H2O] |
12 |
24 |
14 |
25 |
|
[La(1N2N)2·(Thr)·2H2O] |
10 |
23 |
13 |
24 |
|
[Ce(1N2N)2·(Phe)·2H2O] |
11 |
22 |
13 |
25 |
|
[Ce(1N2N)2·(Thr)·2H2O] |
14 |
24 |
14 |
28 |
|
Tetracycline |
18 |
25 |
20 |
30 |
Table 8: The values of MIC (mg/mL) of synthesized complexes of lanthanunm and cerium
|
Compound |
MIC (μg/mL) |
|||
|
E.coli |
S.typhi |
C.diptheriae |
S.aureus |
|
|
[La(1N2N)2·(Phe)·2H2O] |
30 |
20 |
35 |
10 |
|
[La(1N2N)2·(Thr)·2H2O] |
25 |
15 |
30 |
15 |
|
[Ce(1N2N)2·(Phe)·2H2O] |
25 |
10 |
30 |
15 |
|
[Ce(1N2N)2·(Thr)·2H2O] |
25 |
15 |
35 |
15 |
|
1-nitroso-2-naphthol |
150 |
100 |
200 |
75 |
|
LaCl3.7H2O |
100 |
75 |
100 |
50 |
|
CeCl3.7H2O |
100 |
75 |
150 |
75 |
|
Tetracycline |
4.0 |
1.5 |
2.0 |
1.5 |
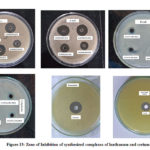 |
Figure 13: Zone of Inhibition of synthesized complexes of lanthanum and cerium. |
Conclusions
In conclusions, we have successfully synthesized the mixed ligand La(III) and Ce(III) complexes of the type [M(1N2N)2·(L)·2H2O] by using 1-nitroso-2-naphthol (1N2N) as a primary ligand and L-phenylalanine, L-threonine (HL) as secondary ligands. The coordination of water molecules in complexes was corroborated by thermal study. The higher decomposition temperature indicate that there is a strong metal-ligand bond in the complexes. All complexes shows three stages of degradation corresponds to loss of two coordinated water molecules, amino acid and 1-nitroso-2-naphthol. Magnetic study indicates diamagnetic nature of lanthanum complexes while the cerium complexes were observed paramagnetic in nature. The non-electrolytic character of lanthanum and cerium complexes were confirmed by molar conductance study. The FT-IR spectra show bonding of primary and secondary ligands to metal ion through donor N- and O- atoms. UV-Visible spectra shows three transtitions in the complexes namely n → π*, π → π* and LMCT transitions, respectively. The antibacterial study show that metal complexes were more potent than corresponding ligands/metal salts. The above result confirms eight coordination number to the synthesized La and Ce complexes.
Acknowledgments
The author Uttam N. Dhaigude is grateful to Dr. Ganesh Thakur, Principal, MPASC College Panvel, Dr. Vishwanath Patil, Associate Professor, Department of Chemistry, University of Mumbai, Dr. Sunil Patil, Director DSW, University of Mumbai and Dr. Pramod Thakur for their kind support and encouragement.
Conflict of Interest
The authors declare that they have no conflict of interest.
References
- Abdel-Mottaleb, M.S.A.; Ismail, E.H. Chem. 2019, 1-18.
- Soomro, G.A.; Shar, G.A. J. Chem. Sci. 2014, 12, 982-992.
- Fayad, N.K.; Al-Noor, T.H.; Ghanim, F.H. Mater. Res. 2012, 2, 18-29.
- Rao, R.R.; Chatt, A. Radioanal. Nucl. Chem. 1994, 180, 187-196.
- Shahraki, ; Shiri, F.; Beyzaei, H.; Khosravi, F. New J. Chem. 2017, 41, 8413-8421.
- Dudley, J.; Feinn, L.; Francesco H.D.; Lindsay E.; Coca, A.; Roberts E.L. Chem. 2018, 14, 550-555.
- Sakr, S.H.; Elshafie, H.S.; Camele, I.; Sadeek, S.A. Molecules, 2018, 23, 1-17.
- Ya-Li, S.; Xue-Song, L.; Xiao-Chun, L.; Yan-Hua, L.; Xin-Hao, Z. Nano-Met.Chem. 2017, 47, 86-90.
- Perrin, D.D.; Perrin, D.R.; Armarego,W.L.F. Purification of Laboratory Chemicals, Pergamon Press, 2nd, Elmsford, New York, U. S. A. 1980.
- Furniss, B.S.; Hannaford, A.J., Smith, P.W.G.; Tatchell, A.R. Vogel’s Textbook of Practical organic Chemistry, 5th, ELBS, Longmans, London,1989.
- Aghav, B.D.; Lokhande, R.S. J. Chem. Pharm. Res. 2016, 8(6), 380-386
- Ionashiro, M.; Graner, C.A.F.; Netto, J.Z., Eclét. Quím. 1983, 8, 29-32.
- Yaqin, Z.; Binsheng, Y. Acta A Mol. Biomol. Spectrosc. 2005, 62, 641-644.
- Alghool, S.; Hanan, F.; El-Halim A.; Abd El-sadek, M.S.; Yahia, I.S.; Wahab, L.A. J. Therm. Anal. Calorim. 2013, 112, 671-681.
- Bodkhe, A.S.; Patil, S.S.; Shaikh, M. Acta Pol. Pharm. 2012, 69, 871-877.
- Chugh, V.; Sharma, S.; Chopra, R.M.N. Asian J. Chem. 2019, 31, 1926-1930.
- Patil, S.; Thakur, G.A.; Shaikh, M.M. Acta Pol. Pharm. 2012, 69, 1087-1093.
- Mohanan, K.; Subhadrambika, N.; Joseyphus R.S.; Swathy S.S.; Nisha,V.P. Saudi Chem. Soc. 2016, 20, 379–390.
- Shelke, V.A.; Jadhav, S.M.; Shankarwar, S.G.; Munde, A.S.; Chondhekar, T.K. Chem. Soc. Ethiop. 2011, 25, 381-391.
- Abd-Elzaher, M.M.; Moustafa, S.A.; Mousa, H.A.; Labib, A.A.; Ali, M.M. J. Chem. 2014, 57, 59–73.
- Kekare, M.; Vaidya, V.; Thakur, J. J. Sci. Res. 2015, 4, 1361-1366.
- Hegazy, W.H.; Al-Motawaa, I.H. Chem. Appl. 2011, 1-10.
- Ameen; I.; Tripathi, A.K.; Mishra, R.L.; Siddiqui, A.; Tripathi, U.N. J. Saudi Chem. Soc. 2019, 23, 725-739.
- Ingale, V.D., Shinde, V.G.; Dighore, N.R.; Rajbhoj, A.S.; Gaikwad, S.T. chem. pharm. 2015, 7, 493-499.
- Sheta, M.S.; Akl, M.A.; Saad, H. E.; El-Gharkawy, El-Sayed, R.H. RSC Adv.2020, 10, 5853-5863.
- Patel, H.; Bhutadiya, L.S.; Vora, J.J.; Yadav, T.H. j. life sci. bioinform. pharm. chem. sci. 2019, 1-16.
- Moustafa, I.M.I.; Abdellattif, M.H. Mod Chem Appl. 2017, 5, 1-7.
- 28. Prakash, D.; Kumar, B.; Gupta, B.G.S.; Kumar, B. Orient. J. Chem. 2009, 25, 809-812.
- El-Ansary, A.L.; Abdel-Kader, N.S. Int. J. Inorg. Chem. 2012, 1-13.
- Sarker, D.; Hossen, Md. F.; Md. Kudrat-E-Zahan; Haque , Md. M.; Zamir, R.; Asraf, Md. A. JMSRR, 2020, 5, 15-25.
- Islam, S.; Nur Alam Siddiki, A.K.M.; Begum, S.; Salam, Md. A. Open J. Inorg. Chem. 2018, 8, 55-69.
- 32. Thakur, G.A.; Athlekar, S.V.; Dharwadkar, S.R.; Shaikh, M.M. Acta Pol. Pharm. 2007, 64, 9-15.
- Bhagat, D.V.; Vaidya, V.V. Tathapi, 2020, 19, 823-833.
- Aruna, K.; Bootwala, S., Tariq, M.; Fernandes, C.; Somasundaran, S. J. Pharm.Sci. Res. 2014, 5, 400-409.
- Osowole, A.A.; Ekennia, A.C.; Osukwe, A.E. RRJC, 2014, 3(1), 32-37.

This work is licensed under a Creative Commons Attribution 4.0 International License.
![]()
A New Edition of Web of Science
Journal Impact Factor
2022: 0.5
Five Year: 0.8
Journal is Indexed in

Cabells Whitelist
![]()


