Synthesis, In Silico Pharmacokinetic And Antimicrobial Studies of Oxovanadium (V) Complexes With 2-(4-((2-(Carboxy) Phenoxy) Methyl)-1H-1,2,3-Triazol-1-Yl) Benzoic Acid
Hanan Alghamdi1, Mohamed Abdelbaset1,2 and Syed Nazreen1
1Chemistry Department, Faculty of Science, Albaha University, Al-Baha, KSA
1Chemistry Department, Faculty of Science, Al Azhar University, Assiut Branch, Assiut, Egypt
Corresponding Author E-mail: baset1002002@yahoo.co.uk
DOI : http://dx.doi.org/10.13005/ojc/360408
Article Received on : 06 May 2020
Article Accepted on : 01 July 2020
Article Published : 07 Jul 2020
New Vanadium(V) complexes with new ligand 2-(4-((2-(carboxy) phenoxy) methyl)-1H-1,2,3-triazol-1-yl)benzoic acid (L1) has been synthesized and characterized by different analytical techniques such as elemental analyzer, 1H NMR, UV-Vis., IR, Mass spectrometry and thermal gravimetric analysis (TGA). The analytical data showed the stoichiometry of the Vanadium(V) to ligand was 1:1, and also indicated that the ligand (L1) coordinate to the vanadium ions through oxygen and nitrogen atoms giving octahedral geometry. The ligands and their complexes have been examined for antimicrobial activity against four types of bacterial strains and one fungal strain. All the tested ligands and their complexes showed moderate to significant activity against Staphylococcus aureus, where the complex N(Pr)4[VO(L1)] (4) showed highest activity comparable to the standard drug, Amoxicillin. The other tested bacterial strains were resistant against the ligands and their complexes. The result of antifungal activity against the pathogenic fungi C. albicans indicated that the tested strain was resistant towards the ligand and its vanadium (V) complexes.
KEYWORDS:1,2,3-Triazole; Antimicrobial Activity; In Silico Pharmacokinetic; Vanadium Complex
Download this article as:| Copy the following to cite this article: Alghamdi H, Abdelbaset M, Nazreen S. Synthesis, In Silico Pharmacokinetic And Antimicrobial Studies of Oxovanadium (V) Complexes With 2-(4-((2-(Carboxy) Phenoxy) Methyl)-1H-1,2,3-Triazol-1-Yl) Benzoic Acid. |
| Copy the following to cite this URL: Alghamdi H, Abdelbaset M, Nazreen S. Synthesis, In Silico Pharmacokinetic And Antimicrobial Studies of Oxovanadium (V) Complexes With 2-(4-((2-(Carboxy) Phenoxy) Methyl)-1H-1,2,3-Triazol-1-Yl) Benzoic Acid. Orient J Chem 2020;36(4). Available from: https://bit.ly/3eadYcC |
Introduction
Vanadium complexes are reported to exhibit different biological activities including antimicrobial, antitumor, antihyperlipidemic, antiobesity, antihypertension, insulin-enhancing effect, improvement of oxygen carrying efficiency of hemoglobin and myoglobin.1-3 Also, Vanadium Complexes are used for reducing of blood glucose level natriuretic and diuretic effects.4-5 New Medicinal applications of vanadium compounds over the last few decades are geared towards many chronic diseases like viral infections, HIV, leishmania and SARS.6-7 The organic ligands assist and improve the bioavailability, transport and targeting mechanism of vanadium compounds.6-7 The interest in the chemistry of oxovanadium complexes has grown enormously over the last few decades due to its significance in several biological processes and affinity towards the donor ligands.8-12 Also, oxovanadium complexes are known as potential inhibitors of different enzymes. Activate of many signal pathways and transcription factors can be performed by oxovanadium complexes which help in therapeutic applications.13 Oxovanadium complexes with strong chelating ligands are very efficient in living system because of its ability to uptake and transport of metals inside the cells.14 This biological relevance of vanadium has promoted the synthesis of model vanadium compounds containing O, N donor ligands.15 Metal complexes may constitute one such possible class exhibiting biological activities.16-19
It is known that ligands containing heterocyclic ring play an important role in the development of coordination chemistry.20-22 1,2,3-triazole is one of the most important heterocylic pharmacophore present in the marketed drugs such as Tazobactum, carboxyamidotriazole, Cefatrizine.23,24 In the last few decades, 1,2,3-triazole derivatives have been reported to possess various biological activities such as antimicrobial, anticancer, anti-inflammatory, antitubercular, and antioxidant activities.25.30 The present antimicrobial drugs are resistant towards some microbial strains, this antimicrobial resistance leads to ineffective treatments and persistence of infections which sometimes leads to death.31, 32
Based on the above mentioned merits of vanadium complexes, 1,2,3-triazole moiety and drawback of the present antimicrobial drugs, we thought that it is interesting to synthesize a new complexes containing vanadium (V) as central metal atom with 2-(4-((2-(carboxy) phenoxy) methyl)-1H-1,2,3-triazol-1-yl)benzoic acid ligand.
Materials and Methods
Chemicals
All chemicals used in this work like Ammonium metavanadate (NH4VO3), Potassium metavanadate (KVO3), tetrapropylammonium hydroxide (N(Pr)4OH), tetramethylammonium hydroxide (N(Me)4OH), phosphorus oxychloride, hydrazine hydrate, vanadium pentaoxide, methanol, ethanol and sulfuric acid were purchased from Sigma-Aldrich and Loba ( India) and used without purification.2-(4-((2-(carboxy)phenoxy)methyl)-1H-1,2,3-triazol-1-yl)benzoic acid (L1) was prepared in the laboratory.
Instrumentation
Melting points of the synthesized ligand and its complexes were measured using Electrothermal melting point apparatus (Cat NO. TA9100). Elemental analysis for C, H, N and S were carried out using Leco VTF‐900 CHN‐S‐O 932 version 1.3x instrument (Thermo Fisher Scientific‐USA). Infrared spectroscopy was recorded on Nicolet IS50 FT‐IR spectrophotometer in the range of 4000 ‐400 cm‐1. Atomic absorption spectroscopic studies of the metal complexes were carried out using MODEL 210 VCP atomic absorption spectrophotometer (Buck Scientific, USA), detection limit 0.1 ppm and integration time 3s. Electronic spectra of solutions of the complexes in DMF were recorded on Evolution 300 UV-Vis Spectrophotometer. Mass spectra were recorded on thermo scientific-LCQ Fleet (LCF10605) using electron spray ionization method at 75 eV. Mass-spectrometric (MS) data is reported in m/z. Molar conductivities of freshly prepared DMF solutions of the complexes at a concentration of 0.001M were measured using Hanna instrument HI8633N Multi-range conductivity meter. Thermo gravimetric analysis (TGA) was recorded on Shimadzu analyzer 50 in a dynamic nitrogen atmosphere (100 ml/min) at a heating rate 10°C/min. The 1HNMR spectra were obtained using Varian Mercury-400BB (400 MHz) spectrometer using TMS (1H) as internal standard.
Synthesis of Ligand and The Complexes
Synthesis of 2-(4-((2-(Carboxy)phenoxy)Methyl)-1H-1,2,3-Triazol-1-yl)Benzoic Acid(L1)
Methyl salicylate 1(15.2 g, 0.1 mole) was added into 500 mL round bottom flask, followed by addition of dry acetone (100 mL) and potassium carbonate (0.15 mole). The reaction mass was stirred for 30 minutes at 50-60 0C. The reaction mass was cooled to 15-20 0C and added propargyl bromide (0.12 mole) and the reaction mass was refluxed for 12 hrs. After completion of the reaction, the reaction mass was filtered and acetone was evaporated to get compound 2 as light yellow liquid (12.5 g). Compound 2 was added to the 250 mL round bottom flask followed by addition of 50 mL tert.butanol : water (1:1), sodium ascorbate (1 molar ratio) and copper sulphate (1 molar ratio). The reaction mixture was stirred for 15 minutes and added methyl anthralateazide slowly. The reaction mixture was stirred for 8 hrs and monitored by TLC. After completion of the reaction, water (200 mL) was added to the reaction mass and the intermediate 3 was extracted with 50 mL dichloromethane (DCM). The DCM was evaporated and added mixture of methanol : water (1:1, 100 mL) followed by NaOH (0.25 mole) and the reaction mass was stirred for 10 hrs at 50-60 0C. After complete hydrolysis, methanol was evaporated and the reaction mass was cooled to room temperature and acidify with 3N HCl to get Ligand L1 which was crystallized in aqueous methanol.27
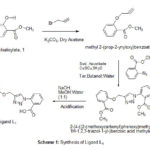 |
Scheme 1: Synthesis of Ligand L1 |
Synthesis of Vanadium Complex (1-4)
Synthesis of NH4[VO(L1)] 1.5 H2O (1) and K[VO(L1)] 0.5 H2O (2) Complexes.
To a hot magnetically stirred (50 mL) ethanolic solution of the ligand L1 (2 mmol), a solution of Ammonium metavanadate or potassium metavanadate (NH4VO3 or KVO3, 2 mmol) in 30 ml hot water was added slowly with stirring. The mixture was refluxed for six hours, the precipitated product was formed. The precipitate was filtered, washed with methanol, dioxane and then with diethyl ether and dried under vacuum. (Scheme 2)
Synthesis of N(Me)4[VO(L1)] 2 H2O (3) and N(Pr)4[VO(L1)] 0.5 H2O (4) Complexes.
V2O5 (2 mmol) was dissolved in aqueous tetra methyl ammonium hydroxide or tetra propyl ammonium hydroxide (N(Me)4OH or N(Pr)4OH, 2 mmol) and then a solution of ligand L1 (2 mmol) in 30 ml ethanol was added. The mixture was refluxed for six hours, the solid complexes separated out was filtered, washed with hot ethanol and petroleum ether to remove unreacted ligand and then dried under vacuum.
![Scheme 2: Synthesis of the M[VO(L1)] xH2O complex (1-4).](http://www.orientjchem.org/wp-content/uploads/2020/07/Vol36No4_Syn_Han_Sch2-150x150.jpg) |
Scheme 2: Synthesis of the M[VO(L1)] xH2O complex (1-4) |
Antimicrobial Activity
The antimicrobial activity of the ligand and their corresponding complexes were tested against four pathogenic bacterial strains viz. Staphylococcus aureus, Enterococcus faecalis as Gram positive bacteria and Escherichia coli, Pseudomonas aeruginosaas as Gram-negative bacterial strains, in addition to one kind of fungi, Candida albicans.
The antibacterial and antifungal activities of the ligand and its corresponding vanadium complexes were tested by well diffusion method for the susceptibility testing.33 The antibacterial and antifungal activities were tested for their in vitro growth inhibitory activity against the investigated pathogenic bacterial and fungal strains cultured on the surface of a sterile Muller-Hinton agar as a microbiological growth medium. The stock solution of the compounds was prepared by dissolving 0.02g of each compound in 5mL DMSO as solvent. The solvent (DMSO) was used as a control in a similar manner to the prepared solutions of the tested compounds. Using sterile cork borer (6mm) a small hole in the middle of each dish was made. Then, solutions of the ligand and the corresponding complexes in DMSO were poured into the holes made in the cultured Muller-Hinton agar medium and incubated for a period of 24 h at 37°C. After the incubation period, the microbial susceptibility was monitored by measuring the zones of inhibition (in mm) around each hole at which the visible growth was completely inhibited. Amoxicillin and Fluconazole ware used as positive control for antibacterial and antifungal activity, respectively. Each sample was repeated in triplicate, and statistical analysis was performed with SPSS 16.0 for windows. For statistical analysis p-values< 0.05 were considered statistically significant. Data were presented as mean ± standard deviation (SD).
Results and Discussion
The 2-(4-((2-(carboxy)phenoxy)methyl)-1H-1,2,3-triazol-1-yl)benzoic acid(L1) and their corresponding vanadium complexes (1-4) were prepared according to the procedure presented in the experimental section. All the prepared complexes were colored and stable at room temperature. The obtained metal complexes were soluble in DMSO and DMF. The ligand (L1) and its vanadium complexes (1-4) have been characterized by Elemental analysis, 1H NMR, UV-Vis., IR spectroscopy, Mass spectrometry and Thermal gravimetric analysis (TGA). The physical properties data of the ligand (L1) and vanadium complexes (1-4) are summarized in Table 1. The complexes do not have sharp melting point, but decomposed on heating over 300 °C.
Table 1: The physical data of the ligand (L1) and their Vanadium(V) complexes (1-4).
|
Compound |
Cald. (Found)% |
Molar conductivity (ohm-1cm2.mol-1) |
||||
|
C |
H |
N |
O |
V |
||
|
NH4[VO(L1)] 1.5H2O (1) |
45.46 (45.21) |
4.03 (3.88) |
12.47 (12.78) |
26.28 (26.50) |
11.34 (11.68) |
7.20 |
|
K[VO(L1)] 0.5H2O (2) |
45.15 (44.89) |
2.67 (2.87) |
9.28 (8.96) |
22.96 (23.15) |
11.26 (11.46) |
7.01 |
|
N(Me)4[VO(L1)] 2H2O (3) |
49.03 (50.21) |
5.29 (5.46) |
10.89 (11.20) |
24.88 (25.12) |
9.90 (10.20 |
8.95 |
|
N(Pr)4[VO(L1)] 0.5H2O (4) |
58.09 (57.85) |
6.72 (6.56) |
9.34 (9.65) |
17.32 (17.68) |
8.49 (8.72) |
9.55 |
Elemental analysis and values of molecular conductance for the synthesized vanadium (V) complexes are listed in Table 2.The elemental analysis results of the vanadium complexes (1-4) are found to be in a good agreement with the proposed chemical formula. The hydrate form of the complexes was confirmed by thermal analysis. The conductivity measurements for vanadium (V) complexes were measured in freshly prepared 1×10⁻³ M DMF solutions and the molar conductivity values are given in Table 2. These values are within the range 7.01 – 9.55 Ohm-1cm2mol-1indicating that all the complexes are non-electrolytes.34-37 The molar conductance results for the vanadium complexes are in agreement with the formula of the metal complexes.
Table 2: Elemental analysis and molar conductance for the Vanadium (V) complexes (1-4)
|
Compound |
Cald. (Found)% |
Molar conductivity (ohm-1cm2.mol-1) |
||||
|
C |
H |
N |
O |
V |
||
|
NH4[VO(L1)] 1.5H2O (1) |
45.46 (45.21) |
4.03 (3.88) |
12.47 (12.78) |
26.28 (26.50) |
11.34 (11.68) |
7.20 |
|
K[VO(L1)] 0.5H2O (2) |
45.15 (44.89) |
2.67 (2.87) |
9.28 (8.96) |
22.96 (23.15) |
11.26 (11.46) |
7.01 |
|
N(Me)4[VO(L1)] 2H2O (3) |
49.03 (50.21) |
5.29 (5.46) |
10.89 (11.20) |
24.88 (25.12) |
9.90 (10.20 |
8.95 |
|
N(Pr)4[VO(L1)] 0.5H2O (4) |
58.09 (57.85) |
6.72 (6.56) |
9.34 (9.65) |
17.32 (17.68) |
8.49 (8.72) |
9.55 |
Infrared Spectra
The characteristic IR absorption bands of the functional groups of the complexes showed significant changes when compared with the free ligand. Shift of IR absorption of some of characteristic vibrational frequencies of the functional groups of the ligand upon complexation provides evidence for the mode of binding of the ligand to the metal ion. IR spectral data of the ligandL1)2-(4-((2-(carboxy)phenoxy)methyl)-1H-1,2,3-triazol-1-yl)benzoic acid (and their vanadium (V) complexes are shown in Table 3 and figures (1-2).
The IR spectrum of the free ligand (L1) displayed bands in the range of 1677 and 1409 cm-1 which may be assigned to asymmetric and symmetric CO of ν COOH group stretching vibrations, these bands are shifted to the lower frequencies 1668-1669 cm-1 and 1373-1379cm-1 in the spectra of vanadium complexes, that may attributed to the involvement of the oxygen atom of the carboxylic group in bond formation with vanadium.38,39
The ligand (L1) shows broad band at 3077 cm-1 assigned to the stretching vibrations of the OH of the carboxylic group, this band disappears in all the spectra of the vanadium (V) complexes. The disappearance of the carboxylic O-H band from the spectra of the vanadium complexes is due to the formation of M-O bond and losing the proton of the COOH group.40 The band at 1252 cm-1of ligand (L1) is attributed to C-O stretching vibrations which is moved towards lower wave numbers in the range 1228 -1237 cm-1 in the spectra of the complexes, which confirms that the oxygen of the C-O coordinates to the vanadium ion. Furthermore, IR spectra of the oxovanadium(V) complexes exhibited a strong band in the range 962- 990 cm-1 which was assigned to (V=O) .21,41-42 The participation of oxygen and nitrogen in coordination with the Vanadium ion is further supported by the new band appearance of ν (M-O) and ν (M-N) at 510-541 cm-1 and 447-456 cm-1respectively.10, 22 As well as the stretching of O–H groups for water molecules are showed in the region 3383–3385 cm-1 as a broad band which indicates the presence of water molecules in the vanadium complexes.42
Table 3: IR data of the ligand (L1) and their Vanadium(V) complexes (1-4) in cm-1
|
Compound |
Ʋ(H2O) |
Ʋ(OH) |
υCOO-asy, |
υCOO-sy |
Ʋ(C-O) |
V=O |
Ʋ(V-O) |
Ʋ(V-N) |
|
|
L1 |
– |
3077 |
1677 |
1409 |
1252 |
– |
– |
– |
|
|
NH4[VO(L1)] 1.5H2O (1) |
3384 |
– |
1669 |
1379 |
1228 |
988 |
510 |
450 |
|
|
K[VO(L1)] 0.5H2O (2) |
3383 |
– |
1668 |
1373 |
1235 |
962 |
526 |
456 |
|
|
N(Me)4[VO(L1)] 2H2O (3) |
3383 |
– |
1668 |
1374 |
1234 |
999 |
526 |
447 |
|
|
N(Pr)4[VO(L1)] 0.5H2O (4) |
3385 |
– |
1669 |
1378 |
1237 |
989 |
541 |
450 |
|
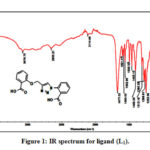 |
Figure 1: IR spectrum for ligand (L1). |
![Figure 2: IR Spectrum for NH4 [VO(L1)] 1.5 H2O (1) Complex.](http://www.orientjchem.org/wp-content/uploads/2020/07/Vol36No4_Cha_Gss_Fig2-150x150.jpg) |
Figure 2: IR Spectrum for NH4 [VO(L1)] 1.5 H2O (1) Complex. |
UV-Visible Absorption
The electronic spectra of the ligand and their vanadium (V) complexes were recorded in 10-3 M DMF solutions, in the range 200-800 nm (Figures 3-4). UV-Vis spectra of the ligand and its vanadium (V) complexes exhibit several absorption bands. The vanadium (V) complexes show different characteristic λmax, compared with the ligand and this is an indication for complex formation. The UV-Visible spectrum of vanadium (V) complexes show peaks in the higher energy region (290–300 nm) are likely to be due to intra-ligand π-π* transitions.43-45 Also, the absorption band in the region 325-377 nm for the vanadium (V) complexes is assigned to n-π* transitions42. The UV-Visible spectrum of complexes show peaks in the range 377-397 nm which assigned to LMCT transitions from the Pπ orbital on the nitrogen and oxygen to the empty d orbitals of the metal.46,47 There was no d-d transition bands appeared in the UV-visible spectrum of the complexes as it is expected for oxovanadium (V) complexes which is in agreement with the vanadium(V) oxidation state (V+5) because they have a 3d0 configuration and there are no d electrons.48-49
![Figure 3: UV–Vis absorption spectra of k[VO(L1)] 0.5 H2O (2) complex.](http://www.orientjchem.org/wp-content/uploads/2020/07/Vol36No4_Cha_Gss_Fig3-150x150.jpg) |
Figure 3: UV–Vis absorption spectra of k[VO(L1)] 0.5 H2O (2) complex. |
![Figure 4: UV–Vis absorption spectra of N(Pr)4[VO(L1)] 0.5 H2O (4) complex.](http://www.orientjchem.org/wp-content/uploads/2020/07/Vol36No4_Cha_Gss_Fig4-150x150.jpg) |
Figure 4: UV–Vis absorption spectra of N(Pr)4[VO(L1)] 0.5 H2O (4) complex. |
NMR Spectra
NMR spectra of ligand (L1) and their vanadium (V) complexes were recorded in DMSO-d6 using TetraMethylSilane (TMS) as internal standard. The 1H NMR spectrum of ligand L1 showed a signal as a singlet at δ 5.31 integrating for two methylene proton bridging 1,2,3-triazole and salicylic acid and signals in the range of δ 7.04-8.58 integration for nine protons confirmed the formation of the ligand L1. The carboxylic acid (COOH) protons disappeared in the spectrum which may be due to the deuteration with hydrated DMSO-deprotons (Fig. 5). Finally, presence of the carboxyl groups were confirmed by presence of two signals at δ 166.63 and 167.43 respectively in 13C NMR spectrum of ligand L1 (Fig. 6). Further the 1H NMR spectra of the complexes were in the agreement with the proposed structure of the complexes and confirms the formation of complex of metal ions through carboxylic oxygen group 50-52.
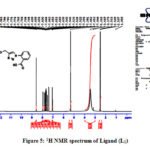 |
Figure 5: 1H NMR spectrum of Ligand (L1) |
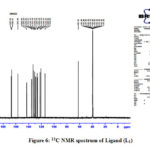 |
Figure 6: 13C NMR spectrum of Ligand (L1) |
Thermogravimetric Analysis
Thermal analysis studies were carried out for some vanadium(V) complexes to confirm the data obtained from infrared spectra on the state of the water molecules in the complexes as well as for their decomposition patterns.
Thermal decomposition of NH4[VO(L1)] 1.5 H2O (1) Complex
The TGA curve of NH4[VO(L1)] 1.5H2O (1) complex shows two steps decomposition (Fig. 7). The first weight loss 5% (cal=6.01%) at 89.9 0C due to the loss of hydrated water molecules (1.5 H2O). The next steps started from 200°C and ended at 800°C, due to the pyrolysis of the whole ligand and removal of NH3 gas leading to the final residue at 800°C as metal oxide (V2O5), the remaining weight loss (obs. 55%, cal. 40.5%) corresponds to the mixture of metal oxide and some ashes as a final pyrolysis product.11
Thermal decomposition of K[VO(L1)] 0.5 H2O (2) Complex
The TGA curve of the K[VO(L1)] H2O (2) complex shows three steps. The first weight loss of 1.5 % (calcd.1.9 %) at 50– 120 °C, indicating the loss of half lattice water molecule. The second and third decomposition step occurred at the temperature range 200 to 800◦C. This may be due to the loss of ligand. The decomposition is completed at 800oC (obs. 35 %, Cal. 30.53 %). leaving metal oxide (KVO3) and some ashes as a final residue.11
Thermal decomposition of N(Me)4[VO(L1)] 2 H2O (3) Complex
The TGA curve of the N(Me)4[VO(L1)] 2H2O (3) complexes showed that the first mass loss step occurring within 100-120 0C range is interpreted as loss of two hydrated water molecules (obs. 6.00 %, Cal. 7.00 %). The second and third steps of decomposition occurs between 200–7000C(obs. 72 %, Cal. 35.4 %) may be attributed to removal of ligand (L1) and non-coordinated part leaving metal oxide (V2O5) and some ashes as a final product at 700 °C.11
Thermal decomposition of N(Pr)4[VO(L1)] 0.5 H2O (4) Complex
The thermal decomposition of N(Pr)4[VO(L1)] 0.5H2O (4) complex consists mainly of three stages (Fig. 8). The first step started from 55 °C and ended at 100 °C, which attributed to the loss of half lattice water molecule (calcd. 1.5 %, found 1.2 %). The next two steps exhibit completion the decomposition of the complex with weight loss between 150 and 800 °C leaving metal oxide (V2O5) as a final residue (obs. = 25 %, calcd. = 30.38 %).11
![Figure 7: Thermogravimetric (TGA) curve NH4[VO(L1)] 1.5 H2O (1) complex.](http://www.orientjchem.org/wp-content/uploads/2020/07/Vol36No4_Cha_Gss_Fig7-150x150.jpg) |
Figure 7: Thermogravimetric (TGA) curve NH4[VO(L1)] 1.5 H2O (1) complex. |
![Figure 8: Thermogravimetric (TGA) curve N(Pr)4[VO(L1)] 0.5 H2O (4) complex.](http://www.orientjchem.org/wp-content/uploads/2020/07/Vol36No4_Cha_Gss_Fig8-150x150.jpg) |
Figure 8: Thermogravimetric (TGA) curve N(Pr)4[VO(L1)] 0.5 H2O (4) complex. |
Mass Spectra
The mass spectra of ligand (L1) and some of the representative vanadium (V) complexes were recorded in order to confirm the theoretically calculated molecular weight according to the proposed structure (Figures 9 –10).. The molecular ion peak for the ligand (L1) are observed at m/z 239.08which confirms the molecular weight of ligand as m/z 238.24which matches with the theoretically calculated from the proposed structure. For the complex NH4[VO(L1)] 1.5H2O (1) the observed peak was at 449.92 m/z which matches the theoretically calculated molecular weight of (449.28 m/z). The molecular ion of the complex K[VO(L1)] 0.5 H2O (2) appears at 453.75 m/z which matches the theoretically calculated molecular weight of (452.34 m/z) and this proves and supports the proposed structures.
![Figure 9: Mass spectrum of NH4[VO(L1)] 1.5H2O (1) complex.](http://www.orientjchem.org/wp-content/uploads/2020/07/Vol36No4_Cha_Gss_Fig9-150x150.jpg) |
Figure 9: Mass spectrum of NH4[VO(L1)] 1.5H2O (1) complex. |
![Figure 10: Mass spectrum of K[VO(L1)] 0.5H2O (2) Complex.](http://www.orientjchem.org/wp-content/uploads/2020/07/Vol36No4_Cha_Gss_Fig10-150x150.jpg) |
Figure 10: Mass spectrum of K[VO(L1)] 0.5H2O (2) Complex. |
Based on these results, we concluded that the 1,2,3-triazole derivative (L1) act as a pentadentate forming stable five, six and seven membered rings. This ligand coordinate through deprotonation of OH and nitrogen of the N=N group in triazole ring. On the basis of the previous observations from elemental analysis, UV-Vis, IR, molar conductivities, 1H NMR, Mass spectra and thermal studies, it is suggested that the vanadium (V) complexes (1-4) with pentadentate ligand (L1) having one oxo group (V=O) and attached to the vanadium center showed octahedral geometries.
The proposed structures of the ligand and the Vanadium complexes 1–4 are shown in below.
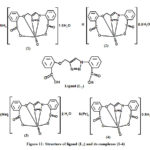 |
Figure 11: Structure of ligand (L1) and its complexes (1-4) |
In silico Pharmacokinetics Studies/ Absorption, Distribution, Metabolism Elimination (ADME) Predictions
The pharmacological or therapeutic activity of the drug depends upon physiochemical properties of the drug. In silico ADME studies are carried out for the generation of active lead molecules in drug development53. The active lead molecule should obey Lipinski rule,54 which states that molecular weight should not be more than 500, hydrogen bond acceptor should not be more than 10, hydrogen bond donor should not be more than 5 and partition coefficient (Clog P) should not be more than 5. Violating any of these criteria of Lipinski rule leads to bioavailability problems when administered orally. In this study, the synthesized ligands and its complexes were subjected to in silico pharmacokinetic parameters like number of rotatable bonds (nROTB), hydrogen bond acceptor (HBA), hydrogen bond donor (HBD), lipophilicity (iLogP) and topological polar surface area (TPSA). In silico % age absorption were calculated using the reported formula [(%ABS = 109-(0.345 X TPSA)]. From the results (Table 4), it was observed that % absorption was found to be in the range of 55.27 – 69.48 %. Among the synthesized compounds, ligand (L1) and complex 2 follows Lipinski rule while other complexes (1,3,4) results in violation of one of the Lipinski rule. Furthermore, all the compounds showed nROTB of 6 (<10) except complex complex 4 suggesting good bioavailability.
Table 4. Pharmacokinetics/ADME predictions of the ligand and synthesized complex
|
No. |
Lipinski parameters |
nROTBe |
TPSAf |
% ABSg |
BBBh |
GI ABSi |
||||
|
MWa |
HBAb |
HBDc |
iLogPd |
Violations |
||||||
|
L1 |
339.30 |
7 |
2 |
1.61 |
0 |
6 |
114.54 |
69.48 |
No |
High |
|
NH4[VO(L1)] 1.5H2O (1) |
449.28 |
9 |
2 |
0 |
1 |
6 |
146.5 |
58.45 |
No |
Low |
|
K[VO(L1)] 0.5H2O (2) |
452.33 |
9 |
1 |
0 |
0 |
6 |
146.5 |
58.45 |
No |
Low |
|
N(Me)4[VO(L1)] 2H2O (3) |
514.4 |
10 |
2 |
0 |
2 |
6 |
155.73 |
55.27 |
No |
Low |
|
N(Pr)4[VO(L1)] 0.5H2O (4) |
599.59 |
9 |
1 |
0 |
2 |
12 |
146.5 |
58.45 |
No |
Low |
a Molecular weight; b Hydrogen Bond Acceptor ; c Hydrogen Bond Donor; d Partition Coefficient; eNumber of rotable bonds; fTopological Polar Surface Area; g Absorption %; hBlood Brain Barrier; iGastro-intestinal absorption
Antimicrobial Activity
The organic ligand (L1) and vanadium (V) complexes (1-4) were assessed for their antimicrobial susceptibility against two Gram-positive bacterial strains: Staphylococcus aureus and Enterococcus faecalis, two Gram-negative bacterial strains: Escherichia coli and Pseudomonas aeruginosa and one pathogenic fungal strain Candida albicans by well diffusion method. The zone of inhibition was measured in mm and the results are summarized in Table 5. The results indicated that organic ligand (L1) and the complexes (1-3) showed moderate activity against tested Gram-positive bacterial strains Staphylococcus aureus while resistant against the tested Gram-negative bacterial strains. The vanadium (V) complex (4) was found to be most active among the tested ligand and complexes and showed highest antibacterial activity against Gram positive bacterial strain Staphylococcus aureus with inhibition zone of ≥32 mm, comparable to the standard drug Amoxicillin showed zone of inhibition 35 mm. All the complexes were found to be resistant against the tested Gram-negative bacterial strains Escherichia coli and Pseudomonas aeruginosa.
The antibacterial investigation revealed that the complex NH4[VO(L1)] 1.5H2O (1) has less antibacterial activity against tested Gram-positive bacterial strains compared to the free ligand. The tested fungal strain was found to be resistant against all the tested ligand and complexes at tested concentration.
Table 5: Antimicrobial activity of the ligand (L1) and its Vanadium (V) complexes
|
Antibacterial Activity 200 μg/disc |
Antifungal Activity |
||||
|
Comp. No. |
Gram Positive Bacteria |
Gram Negative Bacteria |
Yeast |
||
|
S. a |
E. f |
E. c |
P.a |
C. a |
|
|
L1 |
16±1.2 |
8±0.6 |
— |
— |
— |
|
NH4[VO(L1)] 1.5H2O (1) |
9±0.82 |
— |
— |
— |
— |
|
K[VO(L1)] 0.5H2O (2) |
16 ± 1.4 |
— |
— |
— |
— |
|
N(Me)4[VO(L1)] 2H2O (3) |
12±1.2 |
— |
— |
— |
— |
|
(N(Pr)4[VO(L1)] 0.5H2O (4) |
≥32±2.4 |
— |
— |
— |
— |
|
Amoxicillin |
≥35±2.2 |
≥35±2.4 |
25±1.34 |
0 |
NT |
|
Fluconazole |
NT |
NT |
NT |
NT |
12±1.1 |
S.a.: Staphylococcus aureus (ATCC 25923), E. f.: Enterococcus faecalis (ATCC 29212); E.c.: Escherichia coli (ATCC 25922); P.a.: Pseudomonas aeruginosa (ATCC 27853); C.a.: Candida albicans (ATCC 10231); NT: Not Tested; —: No Zone of Inhibition.
Conclusion
In the present work, we have synthesized new ligand and a series of new vanadium(V) complexes (1-4) with ligand (L1) having O and N donor atoms. The ligand used in the present work is 2-(4-((2-(carboxy)phenoxy)methyl)-1H-1,2,3-triazol-1-yl)benzoic acid (L1). The ligand (L1) and their vanadium(V) complexes (1-4) have been characterized by Elemental analysis, IR, UV-Vis, 1H-NMR, mass spectra, molar conductance and thermal gravimetric analysis (TGA). On the basis of the observed data we found that the ligand (L1) behaves as pentadentate ligand. The analysis data of the vanadium (V) complexes suggested that the vanadium (V) complexes (1-4) with ligand (L1) having one oxo group attached to the vanadium center, and their structure was an octahedral geometry. The proposed structures of the prepared vanadium (V) complexes were consistent with the chemical, physical, spectroscopic data and thermal analysis. The results indicated that organic ligand (L1) and their vanadium (V) complexes (2, 3) showed moderate activity with zone of inhibition ( 16, 12 mm) and complex (4) showed highest antibacterial activity with zone of inhibition ≥32 mm against Gram positive bacterial strain Staphylococcus aureus. All the tested ligand (L1) and the complexes did not showed any visible zone of inhibition against the tested Gram negative bacterial strains. The results of antifungal activity against the pathogenic fungus C. albicans indicated that the ligand and its vanadium (V) complexes were inactive against it. The complex (4) may be good candidate for developing antimicrobial agent.
References
- Noblia, P.; Baran, E. J.; Otero, L. J. Inorg. Chem. 2004, 2, 322–328.
- Pattanayak, P.; Pratihar, J. L.; Patra, D. Dalton Trans..2009, 1, 6220–6230.
- Jabeen, M.; Saqib, Ali.; Saira, S.; Liwu F.; Muhammad, S.; Matloob, A. Anal. Pharm. Res. 2020, 9(2), 48‒54.
- Crans, D. C.; Tracey, A. S. ACS SympSer. 1998, 711, 2–29.
- Sasmal, P. K.; Saha, S.; Majumdar, R. Chem. 2010, 49, 849–859.
- Rehder, D. Future Med. Chem. 2012, 4(14), 1823-1837.
- Treviño, S.; Díaz, A.; Sánchez-Lara, E.; Sanchez-Gaytan, B. L.; Perez-Aguilar, J. M.; González-Vergara, E. Trace Elem. Res. 2018, 188(1), 68-98.
- Zabin, S. A.; Abdelbaset, M. J. Chem. 2016, 7, 322‐328.
- Abdelbaset, M.; Zabin, S. A.; Alorabi, Q. IJBPAS. 2019, 8, 627-644.
- Alghamdi, I. A.; Abdelbaset, M.; Ines, M. IJBPAS. 2019, 8, 939-959.
- Thompson, K. H.; Orvig, C. Chem. Rev. 2001, 219–221, 1033–1053.
- Diego, D. R.; Agustín, G.; Ramón, V.; Carlo, M.; Andrea, I.; Dante, M. Dalton Trans. 2003, 1813–1820.
- Jyothy, G. V. Biomed. J. Sci. Tech. Res. 2018, 3, 3264- 3266.
- Eriksson, J. W.; Lonnroth, P.; Posner, B. I.; Shaver, A.; Wesslau, C. A. Diabetologia 1996, 39, 235-242.
- Prasad, K. S.; Kumar, L. S.; Shekar, C.; Prasad, M.; Revanasiddappa, H. D. Chem. Sci. J., 2011, 12, 1-10.
- Chohan, Z. H.; Supuran, C. T. Enz. Inhib. Med. Chem. 2005, 20, 463-468.
- Singh, K.; Kumar, Y.; Pundir, R. K. React. Inorg. Met. Org. Chem. 2010, 40, 836-842.
- Altundas, A.; Nursen, S.; Colak, N.; Ogutchi, H. Chem. Res. 2010, 19, 576-588.
- Nagendra, H. S.; Prasad, C. S.; Karthik, L.; Mallesha P. ; Mallu, A. Asian J. Pharma. Analys. Med. Chem. 2014, 2, 214- 229.
- Abdelbaset, M.; Zabin, S. Int. J. Adv. Res. 2016, 4, 1861-1871Singh, K,; Kumar, M.; Kumar, V. J. Chem. Sci. Tech. 2016, 6, 26.
- Kareem, A.; Nami, S. A. A.; Khan, M. S.; Bhat, S. A.; Mirza, A. U.; Nishat, N. New J. Chem. 2019, 43 (11), 4413-4424
- Yang, Y.; Rasmussen, B. A.; Shlaes, D. M. Pharmacol. Ther. 1999, 83, 141-151.
- Soltis, M.; Yeh, H.; Cole, K.; Whittaker, N.; Wersto, R.; Kohn, E. Drug Metab. Dispos. 1996, 24, 799-806.
- Kant, R.; Singh, V.; Nath, G.; Awasthi, S. K.; Agarwal, A. Eur. J. Med. Chem. 2016, 124, 218-228.
- Alghamdi, A. H.; Alam, M. M. IJBPAS. 2019, 8, 37-52.
- Alharthi, H.; Alam M. M. IJBPAS. 2019, 8, 758-778
- Aher, N.G.; Pore, V. S.; Mishra, N. N.; Kumar, A.; Shukla, P. K.; Sharma, A.; Manoj K.; Bhat, M. K. Bioog. & Med. Chem. Lett. 2009, 19, 759-763.
- Yan, S. J.; Liu, Y. J.; Chen, Y. L.; Liu, L.; Lin, J. Bioog. Med. Chem. Lett. 2010, 20, 5225-5228.
- Rao, P. S.; Kurumurthy, C.; Veeraswamy, B.; Kumar, G. S.; Poornachandra, Y.; Kumar, C. G.; Vasamsetti, S. B.; Kotamraju, S.; Narsaiah, B. Eur. J. Med. Chem. 2014, 80, 184- 191.
- Hof, H. Drug Res. Updat. 2008, 11, 25-31.
- Upmanyu, N.; Kumar, S.; Shah, K.; Mishra, P. Dhaka Univ. J. Pharm. Sci. 2012,11, 7-18.
- Mahal, A.; Abu‐El‐Halawa, R.; Zabin, S. A.; Ibrahim, M.; Al‐ Refai, M.; Kaimari, T. World J. Org. Chem. 2015, 3, 1‐8.
- Yaul, A.; Pethe, G.; Deshmukh, R.; Aswar, A. J. Therm. Anal. Calorim. 2013, 113, 745–752.
- 35. Abdul Kareem, N. N.; Khan, M. S.; Nami, S. A. A. Journal of Molecular Structure. 2018, 1167, 261–273.
- ZHaribabu, V.; Anantha,L. P.V.; Jayatyaga, R. V. Int. J. Chem. Tech. Res. 2013, 5, 1512.
- Sandhya, R. D.; Anantha, L. P. V.; Kamala, P. V.; Jayatyaga, R. V. Res. J. Pharm. Bio. Chem. Sci. 2014, 5, 1304.
- Saghatforoush, L. A.; Shabani, B.; Khalilnezhad, R,; Hasanzadeh, M.; Karimnezad, G. Asian J. Chem. 2009, 12, 6317-6325.
- Nair, S.; Arish, D.; Joseyphus, R. S. J. Saudi Chem. Soc. 2012, 16: 83-88.
- Alghool, S.; Abd El-Halim, H. F.; Dahshan, A. J. Mol. Struct. 2010, 983, 32-38.
- Maurya, R. C.; Rajput, S. J. Mol. Struct. 2007, 833, 133–144.
- Alghamdi, I. A.; Abdelbaset, M.; Ines, M. Oriental J. Chem. 2019, 35, 1722-1730.
- Al-Amiery, A. A. Med. Chem. Res. 2012, 21, 3204–3213.
- Correia, I.; Pessoa, J. C.; Duarte M. T.; Minas da Piedade M. F.; Jackush T.; Kiss T.; Castro M. M. C. A.; Geraldes C. F. G. C.; Avecilla F. Eur. J. Inorg. Chem. 2005, 732–744.
- Shakir, M.; Parveen, S.; Begum, N.; Chingsubam, P. Transit. Metal Chem. 2004, 29, 196.
- Maurya, M. R.; Khurana, S.; Zhang, W.; Rehder, D. J. Chem. Soc. 2002, 15, 3015– 3023.
- Mahajan, S.; Singh, B.; Sheikh, H. N.; Kalsotra, B. L. Chem. Sci. Trans. 2012, 1,23.
- Paciorek, P.; Szklarzewicz, J.; Jasinska, A.; Trzewik, B.; Nitek, W.; Hodorowicz, M.; Polyhed. 2015, 87, 226-232
- Bikas, R.; Hosseini-Monfared, H.; Jeanneau, E.; Shaabani, B. J. Chem. 2012, 2013, 1-12.
- Dhafir, M. H. A.; Ali, H. A.; Usama, H. A. Internat. J. Appl. Sci. Tech. 2018, 8, 69-77.
- Mohammed, M.; Aljamali, N. M.; Shubber, W. A.; Abdalrahman, S. A. Res. J. Pharm. Tech. 2018, 11, 2555-2560.
- Gabr, I. M.; El-Asmy, H. A.; Emmam, M. S.; Mostafa, S. I. Transition Met. Chem. 2009, 34, 409–418.
- Alzhrani, Z. M. M.; Alam, M. M..; Neamatallah, T..; Nazreen, S. J. Enz. Inhib. Med. Chem. 2020, 35(1), 1116-1123.
- Lipinski, C. A.; Lombardo, F.; Dominy, B. W. Adv. Drug Del. Rev. 2001. 46, 3–26.

This work is licensed under a Creative Commons Attribution 4.0 International License.
![]()
A New Edition of Web of Science
Journal Impact Factor
2022: 0.5
Five Year: 0.8
Journal is Indexed in

Cabells Whitelist
![]()


