Studies on Degradation of Flucloxacillin Sodium in Binary and Ternary Systems through UV Spectroscopy and pH Measurement
1Department of Chemistry, Faculty of Engineering and Technology. Chittagong University of Engineering and Technology, Chattogram-4349, Bangladesh.
2Department of Chemistry, University of Rajshahi, Rajshahi-6205, Bangladesh.
DOI : http://dx.doi.org/10.13005/ojc/360418
Download this article as:
![]()
Flucloxacillin sodium (FluNa) is a narrow spectrum beta-lactam (β-lactum) antibiotic of penicillin class which is widely used in the treatment of bacterial infections. Degradation of flucloxacillin sodium (FluNa) in aqueous and different solvent systems was monitored by UV spectroscopy and pH measurement. The effects of carbohydrates (glucose, fructose), urea and thiourea on the stability of flucloxacillin sodium were examined. The degradation of degraded product of flucloxacillin sodium was also studied. Degradation pathway of flucloxacillin sodium in aqueous and different solvents suggests that the stability of FluNa in aqueous glucose and fructose is near to aqueous solution of FluNa and conversely for urea and thiourea system its changes abruptly. And the absorbance intensity at 339nm (for degradation product) decreases with increase of time i.e. degraded product amount in solution changes with time. These outcomes are very helpful for determining the real therapeutic doses of drugs.
KEYWORDS:Absorbance; Different Solvents; Degradation; Flucloxacillin Sodium; pH; Stability
Introduction
An antibiotic is an antimicrobial substance that is active against bacteria. Specially, β-lactum antibiotics are used in the treatment of greater part of diseases. FluNa is such an antibiotic that kill bacterial cells but not human cells. Most bacteria produce a cell wall that is composed partly of a macromolecule called peptidoglycan, itself made up of amino sugars and short peptides. Human cells do not make or need peptidoglycan. FluNa prevents the final cross-linking step and killed the bacterium. No harm comes to the human host because antibiotics does not inhibit any biochemical process that goes on within us. FluNa and other β-lactum antibiotics act by inhibiting penicillin linking of bacterial cell walls. β-lactum antibiotics have outstanding antibacterial activity with low side effects but still in β-lactum therapy have some problems. The main problems of this therapy is the significant instability.1–3 They are easily degraded in aqueous solutions and in solid state. For the quality control, the stability of β-lactum antibiotics in various solutions was widely studied. The microbiological activity of β-lactum antibiotics largely depends on the stability of the β-lactum ring structure.4–7 The β-lactum ring structure of FluNa is shown in Scheme-1. Carbohydrates are organic compounds that found in living organism and provide energy for working muscle, fuel for the central nervous system, enable fat metabolism, fuel for muscle contraction or preferred source of energy and biologic work.The glucose, fructose and urea are essential elements in blood plasma and play an effective role in metabolic action. Thiourea and its derivatives are also veryimportant due totheir outstanding biological applicationsand acts as antioxidant, anti-bacterial agents,ant allergens, anti-thyroid drugs, anti-inflammatory, anti-cancer drug etc. The stability of β-lactum ring structures of FluNa is greatly influenced by the chemical species, such as electrolytes8, glucose, urea,9 and so forth, present in body fluids.
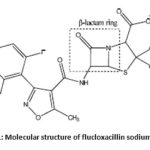 |
Scheme 1: Molecular structure of flucloxacillin sodium (FluNa). |
The instability of β-lactam antibiotics in solution was observed to be a major hurdle in the development of penicillin and other useful β-lactam antibiotics. Therefore, degradation4,6,10 or stability study of β-lactam antibiotics has been of paramount importance not only for their market availability, but also to evaluate their pharmacokinetic properties and adverse reactions.
Taboada et al.11 investigated aggregation properties of FluNa in water and aqueous NaCl by light-scattering,12,13 NMR and other researcher studied byspectrophotometry,14–17 high-performance liquid chromatography (HPLC),18 volumetric,19 Charge- transfer20 techniques, but there is no report on the stability of FluNa in aqueous or different solvent systems. A kinetic UV spectrophotometric21–24 method is very powerful method to study degradation and we applied this method on the study of degradation of FluNa in aqueous and aqueous solutions of glucose, fructose, urea and thiourea. This method is based on the measurement of ultraviolet absorbance at 290-400 nm of reaction products. The pH measurement9,25,26 has also applied to show that how pH is related to degradation of FluNa. With this view, the ultraviolet absorbance and pH analysis of FluNa in water and aqueous electrolyte solutions is undertaken.
Experimental Data
Materials
Flucloxacillin sodium (FluNa) (purity, mass fraction >0.99) obtained from Beximco Pharmaceuticals Limited, Bangladesh, glucose (purity, mass fraction >0.995), fructose (purity, mass fraction >0.995), urea (purity, mass fraction >0.995) and thiourea (purity, mass fraction >0.995 obtained from Loba Cheme Pvt. Ltd India were used in this study.
Preparation of Solutions
Freshly prepared redistilled and degassed water (specific conductance < 10−6 S cm−1) was used for the preparation of solutions. The 0.01 m solutions of FluNa in water and in aqueous glucose, fructose, urea and thiourea solutions having concentrations range 0.3 m to 0.9 m were prepared. The 0.00018m solution of FluNa in water was also prepared from 0.01 m stock solution by dilution method. The solutions were prepared in molality by weighing on a balance (Mettler Toledo, B204-S, Switzerland) having a precision of ± 0.0001 g. The uncertainties in the molality of solutions are within ± 2·10−5mol kg−1.
Measurements
UV Spectra
The sample solution was placed in 1mm matched quartz cuvette. The ultra-pure water was used as reference. UV spectra in range of wavelength from 290 nm to 400 nm were recorded using a UV spectrometer (Model: UV 1800, SHIMADZU) with an interval of 20 minutes.
pH
The solutions were transferred to a beaker and emerged the pH electrode cell into the beaker and observed the pH with the intervals of 2 minutes. The pH of the solutions was measured using a LIDA instrument (PHS.25 precision pH/mV meter).
Results and Discussion
The experimental UV spectrum of 0.00018 m aqueous solutions of FluNa is shown in Fig 1(i), from which it is obvious that an absorbance peak at 273.19 nm observed for 0.00018 m in aqueous solutions of FluNa. There is an excellent agreement with the literature value 273nm reported by Prakash et al.27 The UV spectra of 0.01 m aqueous solution of FluNa are also collected from wavelength 290 nm to 400 nm in the time intervals of 20 minutes and presented in Fig 1. An absorbance peak is found to appear at 339 nm due to the degradation products28 (I), (II), (III) shown in Scheme 2. The absorbance intensity is also found to decrease with increase of time Fig.1(ii). The decrease of intensity is probably attributed to the disappearance of such degradation products as UV-Vis transparent products, C shown in Scheme 2 or for backward reactions to product A. The UV spectra of 0.01 m FluNa in aqueous solutions of glucose, fructose, urea and thiourea are also acquired with 20 minutes intervals up to 3 hours and for comparison the decreasing tendency of intensity, only the UV spectra recorded at 80 minutes are graphically represented in Fig 2. It is evident from spectra Fig.2 (iii) that the intensity of absorbance slight changes (in Fig.2 (iii) & (iv) intensity gap between lower and highest concentration is ≈0.25 for both glucose and fructose solution) with increase in the concentration of glucose and fructose, whereas the intensity of the absorbance changes considerable amount (For urea ≈0.4 in Fig.2 (iv) and for thiourea ≈0.8 in Fig.2 (v)) with the concentration of urea and thiourea. The slight absorbance intensity changes in presence of glucose and fructose is probably due to the slight degradation of B to C or the degradation of B to A by the interaction of glucose and fructose with A and B or both. Conversely, absorbance intensity changes in presence of urea and thiourea is the result of considerable amount degradation of B to C or increasing degradation of A to B by the interaction of urea and thiourea. In case of urea and thiourea solvent system, the possibility of major degradation of FluNa is enhanced over glucose and fructose system and stability changes.
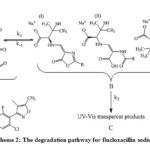 |
Scheme 2: The degradation pathway for flucloxacillin sodium |
The measured pH of 0.01 m FluNa in water and in aqueous solutions of glucose, fructose, urea and thiourea is listed in Table 1- 2 and illustrated in Fig. 3 – 4 also support the absorbance concept. The pH values of FluNa with time in presence of all concentration of glucose and fructose are almost same to aqueous system with a few exceptions. However, pH of the systems with all concentration of urea and thiourea is very much different from the aqueous system at the same observation time. The nearly same pH of FluNa in aqueous and aqueous glucose and fructose solutions may probably due to minor degradation of B to A or B to C. But the much different value of pH in aqueous urea and thiourea solutions than in water is a consequence of enhance major degradation rate of A to B by the interaction of urea and thiourea.
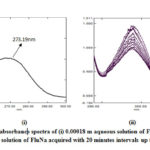 |
Figure 1: UV absorbance spectra of (i) 0.00018 m aqueous solution of FluNa, |
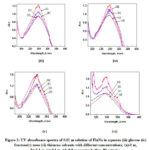 |
Figure 2: UV absorbance spectra of 0.01 m solution of FluNa in aqueous |
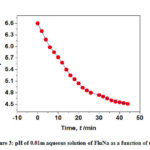 |
Figure 3: pH of 0.01m aqueous solution of FluNa as a function of time |
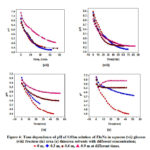 |
Figure 4: Time dependence of pH of 0.01m solution of FluNa in aqueous. |
Table 1: pH of FluNa in aqueous and aqueous solutions of glucose and fructose at 295.15 K under atmospheric pressure.
|
t /min |
pH |
t/min |
pH |
t/min |
pH |
t/min |
pH |
t/min |
pH |
t/min |
pH |
t/min |
pH |
|
Water + FluNa
|
Water + FluNa +0.3m glucose |
Water + FluNa +0.6m glucose |
Water + FluNa +0.9m glucose |
Water + FluNa +0.3m fructose |
Water + FluNa +0.6m fructose |
Water + FluNa +0.9m fructose |
|||||||
|
0 |
6.60 |
0 |
7.03 |
0 |
6.94 |
0 |
7.50 |
0 |
6.50 |
0 |
6.36 |
0 |
6.10 |
|
2 |
6.40 |
1 |
6.70 |
1 |
6.64 |
1 |
7.26 |
1 |
6.30 |
1 |
6.29 |
1 |
5.94 |
|
4 |
6.18 |
3 |
6.40 |
3 |
6.42 |
3 |
7.00 |
3 |
6.02 |
3 |
5.93 |
3 |
5.77 |
|
6 |
5.98 |
5 |
6.20 |
5 |
6.21 |
5 |
6.80 |
5 |
5.80 |
5 |
5.80 |
5 |
5.61 |
|
8 |
5.85 |
7 |
5.99 |
7 |
5.94 |
7 |
6.64 |
7 |
5.63 |
7 |
5.62 |
7 |
5.48 |
|
10 |
5.72 |
9 |
5.86 |
13 |
5.71 |
9 |
6.52 |
9 |
5.47 |
9 |
5.45 |
9 |
5.37 |
|
12 |
5.58 |
11 |
5.72 |
15 |
5.58 |
11 |
6.40 |
11 |
5.39 |
11 |
5.28 |
11 |
5.26 |
|
14 |
5.40 |
13 |
5.59 |
17 |
5.44 |
13 |
6.32 |
19 |
5.05 |
13 |
5.13 |
13 |
5.18 |
|
16 |
5.25 |
15 |
5.46 |
19 |
5.32 |
15 |
6.25 |
21 |
4.99 |
15 |
5.00 |
15 |
5.10 |
|
18 |
5.15 |
17 |
5.35 |
23 |
5.09 |
17 |
6.20 |
23 |
4.95 |
17 |
4.88 |
17 |
5.03 |
|
20 |
5.04 |
19 |
5.24 |
25 |
4.96 |
21 |
6.09 |
25 |
4.89 |
19 |
4.78 |
19 |
4.97 |
|
22 |
4.93 |
21 |
5.12 |
29 |
4.79 |
23 |
5.94 |
27 |
4.82 |
21 |
4.70 |
21 |
4.92 |
|
24 |
4.86 |
23 |
5.02 |
33 |
4.64 |
25 |
5.88 |
29 |
4.75 |
23 |
4.63 |
23 |
4.87 |
|
26 |
4.80 |
25 |
4.91 |
37 |
4.56 |
27 |
5.80 |
31 |
4.69 |
25 |
4.58 |
25 |
4.82 |
|
30 |
4.74 |
27 |
4.82 |
41 |
4.50 |
29 |
5.74 |
33 |
4.62 |
27 |
4.53 |
27 |
4.78 |
|
32 |
4.70 |
29 |
4.74 |
45 |
4.47 |
31 |
5.67 |
35 |
4.56 |
29 |
4.48 |
29 |
4.74 |
|
34 |
4.65 |
31 |
4.65 |
49 |
4.44 |
33 |
5.60 |
37 |
4.50 |
31 |
4.45 |
31 |
4.70 |
|
36 |
4.60 |
33 |
4.59 |
53 |
4.42 |
35 |
5.55 |
39 |
4.44 |
33 |
4.42 |
33 |
4.67 |
|
38 |
4.57 |
35 |
4.53 |
60 |
4.39 |
37 |
5.49 |
41 |
4.40 |
35 |
4.41 |
35 |
4.65 |
|
40 |
4.55 |
37 |
4.48 |
67 |
4.37 |
43 |
5.34 |
43 |
4.36 |
37 |
4.39 |
37 |
4.62 |
|
42 |
4.53 |
39 |
4.44 |
71 |
4.36 |
45 |
5.29 |
45 |
4.32 |
39 |
4.38 |
39 |
4.60 |
|
44 |
4.51 |
41 |
4.41 |
75 |
4.36 |
47 |
5.25 |
47 |
4.28 |
41 |
4.37 |
41 |
4.56 |
|
46 |
– |
43 |
4.37 |
79 |
– |
49 |
5.20 |
49 |
4.25 |
43 |
4.36 |
43 |
4.54 |
|
48 |
– |
45 |
4.35 |
81 |
– |
55 |
5.08 |
51 |
4.23 |
45 |
4.35 |
45 |
4.51 |
|
50 |
– |
47 |
4.32 |
83 |
– |
57 |
5.05 |
53 |
4.20 |
47 |
4.34 |
47 |
4.48 |
|
52 |
– |
49 |
4.30 |
85 |
– |
59 |
5.02 |
55 |
4.18 |
49 |
4.34 |
49 |
4.46 |
|
54 |
– |
51 |
4.28 |
87 |
– |
61 |
4.99 |
57 |
4.16 |
51 |
4.33 |
51 |
4.43 |
|
56 |
– |
53 |
4.26 |
89 |
– |
63 |
4.96 |
59 |
4.15 |
53 |
4.33 |
53 |
4.41 |
|
58 |
– |
55 |
4.24 |
91 |
– |
65 |
4.93 |
61 |
4.13 |
55 |
4.32 |
55 |
4.39 |
|
60 |
– |
57 |
4.23 |
93 |
– |
67 |
4.91 |
63 |
4.12 |
57 |
4.32 |
57 |
4.36 |
|
62 |
– |
59 |
4.23 |
94 |
– |
69 |
4.89 |
65 |
4.10 |
59 |
4.32 |
59 |
4.35 |
|
64 |
– |
61 |
4.23 |
95 |
– |
71 |
4.87 |
67 |
4.10 |
61 |
4.32 |
61 |
4.35 |
|
66 |
– |
63 |
4.23 |
96 |
– |
69 |
4.89 |
69 |
4.10 |
63 |
– |
63 |
4.34 |
|
68 |
– |
65 |
– |
97 |
– |
71 |
4.87 |
71 |
– |
65 |
– |
65 |
4.33 |
|
70 |
– |
67 |
– |
98 |
– |
73 |
– |
73 |
– |
67 |
– |
67 |
4.32 |
|
72 |
– |
69 |
– |
99 |
– |
75 |
– |
75 |
– |
69 |
– |
69 |
4.32 |
“ – ” Not done
Table 2: pH of FluNa in Aqueous and Aqueous Solutions of Urea and Thiourea at 295.15 K under Atmospheric Pressure
|
t/min |
pH |
t/min |
pH |
t/min |
pH |
t/min |
pH |
t/min |
pH |
t/min |
pH |
t/min |
pH |
|
Water + FluNa
|
Water + FluNa +0.3m urea |
Water + FluNa +0.6m urea |
Water + FluNa +0.9m urea |
Water + FluNa +0.3m thiourea |
Water + FluNa +0.6m thiourea |
Water + FluNa +0.9m thiourea |
|||||||
|
0 |
6.60 |
0 |
6.96 |
0 |
6.55 |
0 |
6.8 |
0 |
7.1 |
0 |
6.9 |
0 |
7.07 |
|
2 |
6.40 |
1 |
6.8 |
1 |
6.52 |
1 |
6.77 |
1 |
6.94 |
1 |
6.58 |
1 |
6.85 |
|
4 |
6.18 |
3 |
6.61 |
3 |
6.37 |
3 |
6.63 |
3 |
6.71 |
3 |
6.46 |
3 |
6.35 |
|
6 |
5.98 |
5 |
6.41 |
5 |
6.25 |
5 |
6.53 |
5 |
6.53 |
5 |
6.42 |
5 |
6.55 |
|
8 |
5.85 |
7 |
6.12 |
7 |
6.16 |
7 |
6.44 |
7 |
6.48 |
7 |
6.38 |
7 |
6.59 |
|
10 |
5.72 |
9 |
5.95 |
9 |
6.06 |
9 |
6.37 |
9 |
6.44 |
9 |
6.35 |
9 |
6.7 |
|
12 |
5.58 |
11 |
5.83 |
11 |
5.98 |
11 |
6.3 |
11 |
6.4 |
11 |
6.35 |
11 |
6.73 |
|
14 |
5.40 |
13 |
5.72 |
13 |
5.91 |
13 |
6.26 |
13 |
6.35 |
13 |
6.35 |
13 |
6.78 |
|
16 |
5.25 |
15 |
5.60 |
15 |
5.84 |
15 |
6.21 |
15 |
6.32 |
15 |
6.35 |
15 |
6.81 |
|
18 |
5.15 |
17 |
5.50 |
17 |
5.78 |
17 |
6.17 |
17 |
6.28 |
17 |
6.35 |
17 |
6.82 |
|
20 |
5.04 |
19 |
5.41 |
19 |
5.74 |
19 |
6.13 |
19 |
6.24 |
19 |
6.34 |
19 |
6.83 |
|
22 |
4.93 |
21 |
5.34 |
21 |
5.69 |
21 |
6.09 |
21 |
6.19 |
21 |
6.34 |
21 |
6.84 |
|
24 |
4.86 |
23 |
5.27 |
23 |
5.65 |
23 |
6.06 |
23 |
6.15 |
23 |
6.34 |
23 |
6.83 |
|
26 |
4.80 |
25 |
5.20 |
25 |
5.61 |
25 |
6.04 |
25 |
6.11 |
25 |
6.34 |
25 |
6.83 |
|
30 |
4.74 |
27 |
5.18 |
27 |
5.57 |
27 |
6.01 |
27 |
6.07 |
27 |
6.34 |
27 |
6.83 |
|
32 |
4.70 |
29 |
5.16 |
29 |
5.54 |
29 |
5.99 |
29 |
6.04 |
29 |
6.34 |
29 |
6.83 |
|
34 |
4.65 |
31 |
5.14 |
31 |
5.52 |
31 |
5.98 |
31 |
6.01 |
31 |
6.34 |
31 |
6.83 |
|
36 |
4.60 |
33 |
– |
33 |
5.5 |
33 |
5.97 |
33 |
5.98 |
33 |
6.34 |
33 |
6.83 |
|
38 |
4.57 |
35 |
– |
35 |
5.48 |
35 |
5.96 |
35 |
5.95 |
35 |
6.34 |
35 |
6.83 |
|
40 |
4.55 |
37 |
– |
37 |
5.46 |
37 |
5.94 |
37 |
5.93 |
37 |
6.34 |
37 |
6.83 |
|
42 |
4.53 |
39 |
– |
39 |
5.45 |
39 |
5.93 |
39 |
5.91 |
39 |
6.34 |
39 |
6.83 |
|
44 |
4.51 |
41 |
– |
41 |
5.43 |
41 |
5.92 |
41 |
5.89 |
41 |
6.34 |
41 |
6.83 |
|
46 |
4.50 |
43 |
– |
43 |
5.42 |
43 |
5.92 |
43 |
5.87 |
43 |
– |
43 |
– |
|
48 |
4.49 |
45 |
– |
45 |
5.41 |
45 |
5.92 |
45 |
5.85 |
45 |
– |
45 |
– |
|
50 |
– |
47 |
– |
47 |
5.40 |
47 |
5.91 |
47 |
5.82 |
47 |
– |
47 |
– |
|
52 |
– |
49 |
– |
49 |
5.40 |
49 |
5.91 |
49 |
5.82 |
49 |
– |
49 |
– |
“ – ” Not done
Conclusion
In our study, we find an absorbance peak at 273.19 nm (UV spectrum 0.00018 m) in the aqueous solutions of FluNa that has an excellent agreement with the literature value and removes the difference from some other observations. From the findings of UV spectra and pH of 0.01 m FluNa in aqueous and in aqueous glucose, fructose, urea and thiourea solutions of several concentrations at 295.15 K, it can be concluded that FluNa in glucose and fructose solution is more stable than urea and thiourea solution. And the decrease intensity of degraded product indicates degradation of degraded product. So, the stability sequences of FluNa in aqueous and aqueous glucose, fructose, urea and thiourea solutions are Water+FluNa > Water+FluNa+Glucose=Water+FluNa+Fructose >Water+FluNa+Urea >Water+FluNa+Thiourea.
Acknowledgments
The authors are grateful to the Department of Chemistry, University of Rajshahi, Bangladesh for providing laboratory facilities to carry out this research work.
Conflict of Interest
The authors declare that they have no conflict of interest.
References
- El-Shaboury, S. R.; Saleh, G. A.; Mohamed, F. A.; Rageh, A. H. Pharm. Biomed. Anal. 2007, 45 (1), 1–19.
CrossRef - Cielecka-Piontek, J.; Michalska, K.; Zalewski, P.; Jelinska, A. Pharm. Anal. 2012, 7 (4), 213–227.
CrossRef - Cielecka-Piontek, J.; Michalska, K.; Zalewski, P.; Zasada, S. Anal. Chem. 2011, 8 (1), 91–115.
CrossRef - Macek, B. T.; Hanus, E. J.; Feller, B. A. Journal of the American Pharmaceutical Association . 1948, No. 14, 322–327.
CrossRef - O’Shea, R.; Moser, H. E. Med. Chem. 2008, 51 (10), 2871–2878.
CrossRef - Elmolla, E. S.; Chaudhuri, M. Hazard. Mater. 2010, 173 (1–3), 445–449.
CrossRef - Parisotto, G.; Ferrão, M. F.; Furtado, J. C.; Molz, R. F. Bras. Ciencias Farm. J. Pharm. Sci.2007, 43 (1), 89–96.
CrossRef - Amin, R.; Molla, M. R.; Rana, S.; Hoque, M. A.; Rub, M. A.; Kabir, M.; Asiri, A. M. Chem. Liq.2019, 57 (6), 703–719.
CrossRef - Kim, E. U. I. J.; Kim, S.; Yoo, I.; Chung, J. I. N. S. U. K.; Kim, J. A. E. S. Taylor & Francis. 2006, No. 1981, 1065–1074.
CrossRef - Moss, S.; Konaklieva, A. M. 2012
CrossRef - Taboada, P.; Attwood, D.; Ruso, J. M.; Sarmiento, F.; Mosquera, V. 1999, 15 (6), 2022–2028.
CrossRef - Alam, M. S.; Ghosh, G.; Kabir-ud-Din. Phys. Chem. B.2008, 112 (41), 12962–12967.
CrossRef - Attwood, D.; Agarwal, S. P. Pharm. Pharmacol. 1984, 36 (8), 563–564.
CrossRef - Amin, A. S. Pharm. 2001, 69 (2), 179–188.
CrossRef - REDDY, A.; KUMAR, G. N.; Mohapatra, S. International Journal of Pharma and Bio Sciences. 2010, 1 (4), 34-43.
- Elmolla, E. S.; Chaudhuri, M. 2010, 252 (1–3), 46–52.
CrossRef - Gujral, R. S.; Haque, S. M.; Shanker, P. A . E-Journal Chem.2009, 6 (SUPPL. 1).
CrossRef - Liu, H.; Wang, H.; Sunderland, V. B.. Pharm. Biomed. Anal.2005, 37 (2), 395–398.
CrossRef - Khatun, M. R.; Islam, M. M.; Rima, F. R.; Islam, M. N. Chem. Eng. Data.2016, 61 (1), 102–113.
CrossRef - Refat, M. S.; El-Didamony, A. M. Acta – Part A Mol. Biomol. Spectrosc.2006, 65 (3–4), 732–741.
CrossRef - Karthikeyan, S. Phys. Res. 2011, 2 (4), 72–79.
CrossRef - Valeur, B. Fluoresc.2003, 8, 20–33.
- Bright1, A; Renuga Devi T. S; Gunasekaran S. International Journal of ChemTech Research. 2010, 2(2), 865-870,
- Cielecka-piontek, J; Zalewski P; Krause A.; Milewski, M. Macro to Nano Spectroscopy. 2012, 109-130.
- Akula, P.; Lakshmi, P. K. Brazilian J. Pharm. Sci.2018, 54 (2), 1–8.
CrossRef - O’May, G. A.; Reynolds, N.; Smith, A. R.; Kennedy, A.; Macfarlane, G. T. Clin. Microbiol.2005, 43 (7), 3059–3065.
CrossRef - Prakash, V. IJPSR. 2012, 3 (06), 1806–1808
- Deshpande, A. D.; Baheti, K. G.; Chatterjee, N. R. Sci.2004, 87 (12), 1684–1695.
Accepted on: 26 July 2020


![]()


