Preparation and Identification of Reduced Phosphomolybdate via Molybdenum Blue Reaction
Irene Nalumansi1*, Grace Birungi1, Brenda Moodley2 and Emmanuel Tebandeke3
1Department of Chemistry, Mbarara University of Science and Technology, Uganda
2School of Chemistry and Physics, University of KwaZulu-Natal, Westville Campus, South Africa
3Department of Chemistry, Makerere University, Uganda
Corresponding Author E-mail: inalumansi@must.ac.ug
DOI : http://dx.doi.org/10.13005/ojc/360403
Article Received on : 15 May 2020
Article Accepted on : 02-July-2020
Article Published : 09 Jul 2020
Sodium thiosulphate reduced phosphomolybdate (STRP) was prepared based on the condensation of phosphate and molybdate ions in aqueous acid medium to form phosphomolybdic acid (PMA) followed by its reduction to molybdenum blue. The STRP was characterized by ultraviolet – visible spectroscopy, fourier transform infrared spectroscopy, scanning electron microscopy, raman spectroscopy and X-ray powder diffraction. Comparison of spectral data of the STRP to that of the unreduced phosphomolybdate, indicates that the Keggin structure is retained even after reduction. X- ray diffraction data and SEM/EDX results suggest formation of crystalline cubic phosphomolybdate crystals.
KEYWORDS:Phosphomolybdate; Reduction; Molybdenum blue; Keggin structure
Download this article as:| Copy the following to cite this article: Nalumansi I, Birungi G, Moodley B, Tebandeke E. Preparation and Identification of Reduced Phosphomolybdate via Molybdenum Blue Reaction. Orient J Chem 2020;36(4). |
| Copy the following to cite this URL: Nalumansi I, Birungi G, Moodley B, Tebandeke E. Preparation and Identification of Reduced Phosphomolybdate via Molybdenum Blue Reaction. Orient J Chem 2020;36(4). Available from: https://bit.ly/2O8uXl5 |
Introduction
Polyoxomet alates (POMs) are polyatomic ions composed of metal cations bridged by oxide anions. They are constituted of early transition metal elements usually group VIB (for example molybdenum, tungsten) and group VB (such as vanadium, niobium, tantalum) in their highest oxidation states. Additionally, they may contain hetero atoms such as silicon, phosphorus, germanium and arsenic.1, 2 In this respect, two broad families of POMs are recognized; the isopolyoxometalates, composed of only one kind of metal and oxide and heteropolyoxometalates, composed of one metal, oxide and a main group oxyanion such as phosphate, silicate and arsenate. The heteropolyoxometalates are formed by condensation of more than two different oxoanions in acidic medium as shown in equation 1.
PO43- + 12MoO42- + 27H + ¦ H3[PMo(VI)12O40] + 12H2O (1)
The first example of polyoxometalate anion dodecamolybdophosphate anion, [PMo12O40]3- was discovered by Berzelius in 1826.3 Later on, Marignac, 1864 synthesized 12-tungstosilicic isomers but did not propose their structures. Alfred Werner and A. Miolati, 1908 basing on coordination theory made the first attempts to understand the structural composition of heteropoly anions. They suggested that the hetero atom in these compounds had an octahedral coordination which was proved otherwise by Rosenheim and co-workers, 1930 who carried out extensive structural characterisations of these compounds in the early 20th century.4 It was Pauling, 1929 who first proposed structures of 12-tungstophosphate anions, [(PO4)W12O18(OH)36]3-. He proposed that their structure was based on a central PO4 or SiO4 tetrahedron surrounded by WO6 octahedra. Since Pauling considered only the corner sharing between the MO6 octahedra, his structure was proved wrong. X-ray diffraction studies of [(PO4)W12O18(OH)36]3- by Keggin in 1933 showed that the anion contained a central PO4 tetrahedron and WO6 octahedral units as suggested by earlier scientist but these were linked by shared edges as well as corners. The structures were then referred to as Keggin structures from the discoverer.
Other structures exhibited by heteropolyoxometalates include Wells-Dawson (X2M18O62n-), Anderson-Evans (XM6O24n-), Lindqvist (Mo6O192-), Strandberg (P2Mo5O236-) and Pope-Jeannin-Preyssler (NaP5W30O1014-)5, 6 (where X is the hetero atom and M is the metal atom). Among the stated structures, Keggin and Dawson structures are the basic building units whereby assembly of two or more of their fragments leads to formation of other complex structures. The structures differ in the ratio of hetero to addenda atoms.
Heteropolyoxometalates with Keggin structure are the most stable, more easily available and have been deeply examined because of their catalytic and acidic properties. In a Keggin structure, twelve metal atoms (for example M = V, Nb, Ta, Mo, W) are arranged around one hetero atom (such as X = P, As, Si, Ge) forming XM12O40n-8. The hetero atom is bonded to four oxygen atoms to form a tetrahedron, XO4 and each metal atom is linked to six oxygen atoms to form octahedrons MO6. Three octahedrons assemble into trimetallic groups M3O13 which are connected to others and to the central heteroatom. Therefore, there are four groups surrounding the heteroatom.7 The Keggin structure has full tetrahedral symmetry and it is able to accommodate a variety of heteroatoms of varying size. Also, in the presence of a suitable reductant, the Keggin heteropolymolybdate ion can be reduced to a mixed valence heteropoly compound called molybdenum blue.
Molybdenum blue is an intense blue mixed valent compound formed on reduction of molybdic acid or acid solutions of molybdates.8 It is a bright blue molybdenum containing substance of various composition such as Mo8O23.xH2O and Mo4O11O.xH2O. The blue material was first mentioned by Scheele, 1778.9 Amorphous forms of molybdenum blue are formed on reduction of molybdenum trioxide, MoO3 or molybdate ion, MoO42- in aqueous acidic medium with reductants such as zinc, hydrazine, sulphur dioxide, hydriodic acid, hydrogen sulphide or molybdenum metal. Among the factors that determine the nature of product formed are reducing agent, concentration of acid and molybdate concentration. Other reductants include metals (tin, copper), hydroquinoline, glucose, atomic hydrogen and lithium aluminium hydride have been reported. Molybdenum blue compounds in crystalline state can also be obtained. For example, reduction of MoO3 by atomic hydrogen yields Mo2O4(OH)2 and Mo4O10(OH)2 whereas with LiAlH4, Mo5O7(OH)8 is formed. Electrolytic reduction of ammonium heptamolybdate in sulphuric acid yields Mo3O8H.10
The formation of molybdenum blue via chemical reduction and its application in chemical analysis has been studied widely.11 For example, the most cited method of phosphate determination via formation of molybdenum blue is the one reported by Murphy and Riley, 1962 that utilizes ascorbic acid as the reductant in the presence of antimony. Similar reactions have been used in the colorimetric determination of arsenate, silicate, germanate and many other substances. In addition, phosphomolybdates have found various applications in redox reactions, medicine and catalysis. However, these reduced heteropoly compounds utilized in the aforementioned applications have not been fully characterized and it is important to study the structure of these compounds. Therefore, in this work, we demonstrate synthesis and characterisation of molybdenum blue complex upon reduction of phosphomolybdic acid by sodium thiosulphate.
Materials and Methods
Materials
All chemicals used were of analytical grade and used without further purification. They included; sodium molybdate dihydrate (Merck 99.5%), sodium thiosulphate pentahydrate (Merck 99.0 – 101.0%), potassium dihydrogen phosphate (Merck 99.5%), hydrochloric acid (Merck 32%), nitric acid (Merck 55%), ammonium chloride (Merck 99%) and diethyl ether (Honeywell 0.71 g cm-3). Deionized water was used to prepare solutions.
Instrumental analysis
Weighing was carried out using a RADWAG Wagi Elektroniczne analytical balance (Model AS220.R2, d = 0.1 mg, e = 1 mg). The UV/Vis spectra were scanned using a UV-VIS-NIR spectrophotometer (Shimadzu UV-3600) with 1 cm quartz cuvettes. The scanning wavelength was in the range 200 – 1100 nm. Infrared spectra were obtained using PerkinElmer Universal ATR (Spectrum 100 series) FT- IR spectrometer equipped with attenuated total reflectance (ATR). FTIR spectra measurements were recorded in the wavelength region of 4000 – 400 cm-1. Raman spectra were collected with a Deltanu Advantage 532 model equipped with visible laser radiation (λ = 532 nm) CLASS 3b LASER product. The peak power was 200 mV at sample position. XRD analyses were carried out on a Bruker D8 XRD with Cu-Kα radiation at 40 mA and 45 kV. The XRD pattern was scanned in a 2-theta range of 5 – 90o. Surface morphology and shape of molybdenum blue solid was analysed by Zeiss 10 kV field emission scanning electron microscope (FESEM) with dialyzed samples dropped on copper grids. Surface composition of the molybdenum blue was qualitatively and semi quantitatively determined by scanning electron microscopy with energy dispersive X – ray spectroscopy (SEM/EDX).
Preparation of Sodium Thiosulphate Reduced Phosphomolybdate
The reduced molybdenum blue was prepared by first forming the Keggin phosphomolybdic acid according to a method described by Wu12; followed by reduction with sodium thiosulphate as follows: sodium molybdate (9.1 g) was dissolved in deionized water (20 mL), potassium dihydrogen phosphate (2.89 g) and concentrated hydrochloric acid (32%, 10 mL) added. The solution was transferred to a 100 mL separatory funnel and mixed with diethyl ether (15 mL) and shaken for 15 minutes. After standing for 15 minutes, the lower layer was transferred to a separatory funnel containing deionized water (10 mL) and shaken. Concentrated HCl (10 mL) and diethyl ether (15 mL) were added and shaken again for 15 minutes. After standing for 15 minutes, the lowest layer was transferred to another separatory funnel and washed again as above. Finally, the ether layer which was clear was transferred to a beaker containing deionized water (2.5 mL) and a few drops of concentrated nitric acid (55%) added. The resulting solution was evaporated on a water bath with occasional stirring until a solid began to form. The obtained solid (1.5 g) was dissolved in deionized water (15 mL). To this solution was added a mixture made by dissolving ammonium chloride (6.0 g) and sodium thiosulphate (2.48 g) in deionized water (15 mL). The resulting suspension was filtered by suction. Crystallization was accomplished by dissolving the solid obtained in hot water (60 mL) and cooling the solution.
Results and Discussion
Synthesis of STRP
Reduction of the yellow phosphomolybdic acid by sodium thiosulphate yielded an intense blue sodium thiosulphate reduced (STRP) solid (2.597 g). It is documented that when a solution of orthophosphate (PO43-) and molybdate (MoO42-) are mixed in aqueous acidic medium, phosphomolybdic acid is formed which upon selective reduction yields an intense blue heteropolymolybdate.13
Characterisation of STRP
The UV/VIS spectra of aqueous solutions of PMA and STRP are shown in Figures 1 (a) and (b), respectively. The spectrum for PMA displays two absorptions at 207 and 351 nm; these absorptions are attributed to ligand – metal charge transfers (LMCT) from oxygen to Mo(VI) in the Keggin anion.14,15,16 This kind of absorption is characteristic of unreduced heteropoly compounds.17,18 On the other hand, the spectrum spectrum for STRP shows two absorption bands at 721 and 975 nm; the absorptions are in the visible and near IR regions of the electromagnetic spectrum. These absorption peaks are associated with metal – to – metal charge transfer which is consistent with the blue colour of the compound and to d – d transitions of d1 metal ions.19,20,21 These results are in agreement with Koyun and co-workers’ work, 2017 22 which reported that molybdenum blue had a typical electronic absorption spectrum that gave two maxima at 748 and 1093 nm with UV-vis-near infrared spectroscopy.
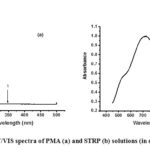 |
Figure 1: UV/VIS spectra of PMA (a) and STRP (b) solutions (in deionized water) |
The FTIR spectra of the compounds were recorded in the 4000 – 400 cm-1 region. The FTIR spectrum of PMA is shown in Figure 2 (a). The spectra of the PMA showed characteristic bands at 1063, 955, 847, 713 and 579 cm-1 corresponding to vas(P – Oa), vas(Mo – Od), vas(Mo – Ob – Mo), vas(Mo – Oc – Mo) and δ (P – O) vibrations respectively (where Oa is the O atom that connects with the hetero atom, Ob is O the atom connecting two trimetallic groups, Oc is the O atom connecting two MO6 octahedra inside the trimetallic group and Odtransitions is the terminal O atom in a Keggin unit). This is in agreement with work done by Abu-Zied, Farrag and Asiri, (2013) 23 where similar characteristic bands were observed. The spectrum also shows a broad vibration band at 3390 cm-1 which is ascribed to asymmetric stretching of OH groups. The band at 1613 cm-1 is due to H – O – H bending vibrations of crystallization water.24 The spectra for the STRP is presented in Figure 2 (b) and shows that the Keggin structure was preserved when PMA was reduced. The spectra exhibits four major characteristic bands at 1059, 955, 718 and 601 cm-1 in the lower wave number region which are attributable to the Keggin structure of a reduced heteropoly including vibration bands at 3001 and 1411 which may be assigned to stretching vibrations of the ammonium ion.15,25 The observation of P – O, Mo – O and Mo – O – Mo bond vibrations support the presence of a Keggin structure that exhibits characteristic bands in the range 1100 – 500 cm-1.26
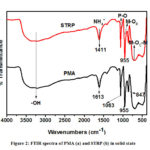 |
Figure 2: FTIR spectra of PMA (a) and STRP (b) in solid state |
The Raman spectrum of PMA shown in Figure 3 (a) exhibited a peak at 981 cm-1 which is due to asymmetric and symmetric stretching of the terminal oxygen, M = O. The weak band at 874 cm-1 can be attributed to Mo – Ob – Mo asymmetric stretching whereas the band at 592cm-1 is due to stretching and bending of Mo – Oc – Mo bonds. The observed bands indicate presence of a Keggin unit.27 Raman spectrum of STRP (Figure 3 (b)) showed band broadening with multiple peaks. Band broadening was also evidenced in the electrochemically synthesized molybdenum blue by Koyun et al, (2017) .22 This can be attributed to comprehensive network of hydrogen bonds and sodium based salt bridges within the core of the structure. In addition to peaks associated with the Keggin unit, the Raman spectrum for STRP also shows bands in the region between 900 – 200 cm-1 which are characteristic of all molybdenum blue species.28 These peaks are at 974, 454, 326 and 219 cm-1.
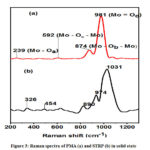 |
Figure 3: Raman spectra of PMA (a) and STRP (b) in solid state |
SEM was employed to examine the surface morphology of the solids of PMA and STRP. SEM images (Figures 4 and 5) showed that the crystals displayed anti prismatic shapes. SEM images showed no significant morphological differences between PMA and STRP. EDX was used to analyse elemental composition of PMA and STRP, Figure 6 (a) and (b). The absorbances from chlorine atoms observed in the EDX spectrum of STRP (Figure 6 (b)) were due to the added ammonium chloride on precipitation of the phosphomolybdate complex.
 |
Figure 4: Scanning electron microscope images of synthesized phosphomolybdic acid particles at different magnifications. |
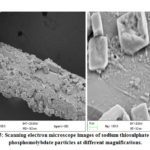 |
Figure 5: Scanning electron microscope images of sodium thiosulphate reduced phosphomolybdate particles at different magnifications. |
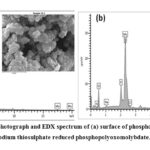 |
Figure 6: SEM photograph and EDX spectrum of (a) surface of phosphomolybdic acid (b) sodium thiosulphate reduced phosphopolyoxomolybdate. |
The XRD diffraction pattern for the PMA shown in Figure 7 (a), shows peaks within 5 – 80o range. The XRD peaks are similar to the characteristic peaks of the Keggin structure as evidenced at 2θ = 10, 28 and 32o.29 Upon reduction of the PMA to STRP, a change in the XRD pattern (Figure 7(b)) was observed. Nevertheless, electron diffraction patterns in SEM showed that the substance was crystalline. The XRD pattern (Figure 7(b)) of STRP has less sharp peaks and a new one at 2θ = 8o which could be attributed to Mo3O13 groups of the Keggin unit in the reduced heteropoly compound. The results revealed that PMA and STRP possessed a Keggin structure.
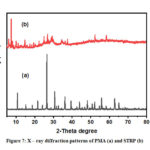 |
Figure 7: X – ray diffraction patterns of PMA (a) and STRP (b) |
Conclusion
A phosphomolybdate was successfully prepared by reacting sodium molybdate and potassium dihydrogen phosphate in acidic medium to form phosphomolybdic acid followed by reduction with sodium thiosulphate. Characterisation of the compounds suggested that the Keggin structure was preserved after reduction of the heteropoly acid. XRD studies revealed that the STRP was crystalline whereas SEM observations showed that the crystals of STRP are cubic.
Acknowledgements
The authors would like to acknowledge the Organisation for the Prohibition of Chemical Weapons (OPCW), the African-German Network for Excellence in Science (AGNES) and the German Academic Exchange Service (DAAD) for partly funding this study. Support by the School of Chemistry and Physics, University of KwaZulu Natal – Westville, Departments of Chemistry at Mbarara University of Science and Technology and Makerere University is also gratefully acknowledged by the authors.
Conflict of Interest
The authors declare that they have no conflict of interest.
References
- Hasenknopf, B.; Frontiers in Bioscience., 2005, 10, 275 – 287.
CrossRef - Long, D. L.; Tsunashima, R.;Cronin, L.; Angewandte Chemie – International Edition., 2010, 49, 1736–1758.
CrossRef - Keggin, J. F.; Proceedings of the Royal Society A: Mathematical, Physical and Engineering Sciences., 1934, 144(851), 75–100.
CrossRef - Borras-Almenar, J. J.; Coronado, E.; Achim, Muller; Pope, M.. Polyoxometalate Molecular Science NATO Science Series., 2003, 3- 10.
CrossRef - Ivanova, S., ISRN Chemical Engineering., 2014, 2014(January), 1–13.
CrossRef - Ayass, W. W.; Kortz, U.; ChemViews., 2018, 6, 9–14.
- Ammam, M.; Journal of Materials Chemistry A., 2013, 1(21), 6291–6312.
CrossRef - Cotton, F. A.; Wilkinson, G.; Advanced Inorganic Chemistry. A Comprehensive Text.. New York: John Wiley and Sons; 1980, 4th edition, 844–861.
- Müller, A.; Meyer, J.; Krickemeyer, E.; Diemann, E.; Angewandte Chemie (International Edition in English)., 1996 35(11), 1206–1208.
CrossRef - Patnaik, P.; Handbook of Inorganic Chemicals. New York: McGraw-Hill; 2003, 581–587.
- Crouch, S. R.; Malmstadt, H. V.; Analytical Chemistry, 1967, 39(10), 1084–1089.
CrossRef - Wu, H.; Biol. Chem., 1920, 43, 189–220.
CrossRef - Greenwood, ; Earnshaw, A.; Chemistry of the elements. 2nd ed. Oxford: Butterworth-Heinemann., 1997, 1002–1016.
CrossRef - Fournier, M.; Louis, C.; Che, M.; Chaquin, P.; Masure, D.; Journal of Catalysis., 1989, 119(2), 400–414.
CrossRef - Dermeche, L.; Thouvenot, R.; Hocine, S.; Rabia, C.; (2009). Inorganica Chimica Acta., 2009, 362(11), 3896–3900.
CrossRef - Benadji, S.; Mazari, T.; Dermeche, L.; Salhi, N.; Cadot, E.; Catalysis Letters., 2013, 143(8), 749–755.
CrossRef - Papaconstantinou, E.; Chemical Society Reviews., 1989, 18(c), 1–31.
CrossRef - Cavani, F.; Mezzogori, R.; Pigamo, A.; Trifirò, F. Comptes Rendus de l’Academie Des Sciences – Series IIc: Chemistry., 2000, 3(6), 523–531.
CrossRef - Cabello, C. I.; Botto, I. L.; Thomas, H. J.; Applied Catalysis A: General., 2000, 197(1), 79–86.
CrossRef - Thomazeau, C.; Martin, V.; Afanasiev, P.; Applied Catalysis A: General., 2000, 199, 61–72.
CrossRef - Zhang, G.; Yang, W.; Yao, J.; Advanced Functional Materials., 2005, 15(8), 1255–1259.
CrossRef - Koyun, O.; Gorduk, S.; Arvas, M. B.; Sahin, Y. Synthetic Metals., 2017, 233(September), 111–118.
CrossRef - Abu-Zied, B. M.; Farrag, A. A. A.; Asiri, A. M.; Powder Technology., 2013, 246, 643–649.
CrossRef - Mallick, S.; Rana, S.; Parida, K.; Industrial & Engineering Chemistry Research., 2012, (51), 7859–7866.
CrossRef - Tahar, A.; Benadji, S.; Mazari, T.; Dermeche, L.; Marchal-Roch, C.; Rabia, C.; Catalysis Letters., 2014, 145(2), 569–575.
CrossRef - Rocchiccioli-Deltcheff, C.; Fournier, M.; Franck, R.; Thouvenot, R.; Inorganic Chemistry., 1983, 22(2), 207–216.
CrossRef - Langpape, M.; Millet, J. M. M.; Ozkan, U. S.; Delichère, P.; Journal of Catalysis., 2002, 182(1), 148–155.
CrossRef - Müller, A.; Das, S. K.; Krickemeyer, E.; Kuhlmann, C.; Inorganic Syntheses., 2004, 34, 191–200.
- Alizadeh, M. H.; Mirzaei, M.; Salimi, A. R.; Razavi, H. Materials Research Bulletin., 2009, 44(7), 1515–1521.
CrossRef

This work is licensed under a Creative Commons Attribution 4.0 International License.
About The Author
![]()
A New Edition of Web of Science
Journal Impact Factor
2022: 0.5
Five Year: 0.8
Journal is Indexed in

Cabells Whitelist
![]()


