Investigation on Synthesis and Applications of Novel Polymeric Composites for the Removal of Heavy Metal Ion
Rajeswari Balakrishnan1 and Santhi Radhakrishnan2*
1,2K.Ramakrishnan College of Engineering, Samayapuram, Tiruchirappalli – 621112, Tamil Nadu, India
2Department of Chemistry, Seethalakshmi Ramaswami College, Affiliated to Bharathidasan University, Tiruchirappalli – 620002, Tamil Nadu, India.
Corresponding Author Email: santhichemsrc@gmail.com
DOI : http://dx.doi.org/10.13005/ojc/360417
Article Received on : 07 July 2020
Article Accepted on : 08 Aug 2020
Article Published : 19 Aug 2020
Conducting polymers were synthesized by doping polyaniline chloride with Schiff bases such as (E)-2-((4s-chlorobenzylidene)amino) -3- (3a,7a-dihydro-1H-indol-3-yl)propanoic acid (TP4ClB) and (E)-3-(3a,7a-dihydro-1H-indol-3-yl)-2-((2-hydroxy-3,5-diiodobenzylidene)amino) propanoic acid (TPDISA). A chemical oxidation method using potassium persulphate as an oxidising agent was followed for the preparation of polymers. The prepared polymers were characterized by UV-Visible, FTIR and proton H1NMR spectroscopic techniques. The adsorption characteristics of Polymeric composites for the removal of mercuric ion was studied through batch process. Sorption isotherms were constructed using Langmuir, Freundlich, Dubinin Radush Kevich, Temkin and Redlich Peterson models. SEM micrograph, PXRD and EDX spectra were also recorded to confirm the metal ion adsorption on the surface of investigated composites.
KEYWORDS:Adsorption; Polymeric Composite; Mercuric Chloride; Tryptophan; Schiffbases
Download this article as:| Copy the following to cite this article: Balakrishnan R, Radhakrishnan S. Investigation on Synthesis and Applications of Novel Polymeric Composites for the Removal of Heavy Metal Ion. Orient J Chem 2020;36(4). |
| Copy the following to cite this URL: Balakrishnan R, Radhakrishnan S. Investigation on Synthesis and Applications of Novel Polymeric Composites for the Removal of Heavy Metal Ion. Orient J Chem 2020;36(4). Available from: https://bit.ly/3iVf5zG |
Introduction
Environmental contamination due to minerals and heavy metals is the major challenging problem in our country. The concentration of heavy metals due to industrial and agricultural waste materials have been increased to the levels of high risk.1-4 Among the various metals like lead, mercury, chromium ,arsenic, nickel, uranium, selenium, silver, cadmium, zinc and gold present in industrial waste water, discharge of Hg (II) ions cause severe environmental contamination as it is non-degradable and bio- accumulate in nature.5-8 Fertilizers industry, power generation plants, paper manufacturing, rubber processing and oil refineries are found to be the great sources for the emission of mercury into the universe. Health issues such as dialysis and problem in central nervous system occur due to circulation of mercury in the blood and storage in brain, liver, spleen, kidney and bone. Hence it is right time to carryout the research on the removal of mercuric ion from the environment.3-5 Though the number of methods such as reverse osmosis, floatation , adsorption, coagulation, flocculation, electrodialysis, chemical precipitation, nanofiltration, ion exchange, ultrafiltration, chemical precipitation and nanofiltration have been practiced for discarding the heavy metals, adsorption is an economical and more suitable one as it is simple to perform, easy to operate at low budget for the removal of toxic contaminants. Hence an attempt has been made to synthesize a novel organic polymer by doping polyaniline chloride with the potential schiff bases. The synthesized organic polymers have been characterized by UV-Visible, FTIR and H1NMR spectroscopy. The adsorption characteristics of pani composite for the removal of mercuric ion was studied through batch process.9-11 Langmuir, Freundlich, Dubinin Radushkevich, Temkin and Redlich Peterson isotherms have been verified. Adsorption of the metal ion on the organic polymer has been confirmed by PXRD,SEM analysis and EDX spectra.
Experimental Methods
Materials and Methods
The reagents and solvents were used as such( AR grade). Aniline (BDH) was distilled under reduced pressure before use. All the experiments were carried out using Double distilled water. Hydrochloric acid & sodium hydroxide solutions were used to study sorption behavior of the solutions at different pH.
Preparation of Schiff Bases
The Schiff bases (E)-2-((4s-chlorobenzylidene)amino) -3- (3a,7a-dihydro-1H-indol-3-yl) propanoic acid (TP4ClB) and (E)-3-(3a,7a-dihydro-1H-indol-3-yl)-2-((2-hydroxy-3,5-diiodobenzylidene)amino)propanoic acid (TPDISA) were prepared by the condensation of tryptophan(2.04g) with equivalent amount of 4-chlorobenzaldehyde 3,5-diiodosalicylaldehyde respectively the reaction was performed in presence of an acid and refluxed for 4 hours. The solid product formed was filtered at the suction pump and washed with ethanol. Then it was dried over anhydrous CaCl2 in a vaccum desiccator and recrystallised with alcohol.
Preparation of Polyaniline Chloride
Aniline (0.1M) was dissolved in aqueous solution of hydrochloric acid (1M). The mixture was stirred using a magnetic stirrer and 50ml of potassium persulphate (0.1M) was added drop wise to the aniline-acid mixture for about two hours with continuous stirring at 303K. The contents were stirred further for 30 minutes to ensure complete polymerization. A dark green coloured PaniCl thus formed was filtered using a Whatmann No. 1 filter paper. The excess acid content and oligomers of aniline were removed by repeated washings with distilled water, ethanol, acetone and diethyl ether11. The green coloured polymer obtained was dried in an air oven for four hours till constant weight was reached.
The colour changes that appeared during the addition of potassium persulphate is given below. Straw yellow ®yellow ®brown ®green colour.
Preparation of Polymeric Composite
PaniCl (1g) and schiffbase (TP4ClB, TPDISA) (1g) were mixed together and suspended in 15ml of diethyl ether and sonicated in an ultra sonic cleaning bath (NEY, 50 Khz) for 30 minutes. The slurry obtained was centrifuged and the supernatant liquid was removed. The resulting product was washed with ether and centrifuged. The dark green coloured mass obtained was dried in a vacuum desiccator to get a free flowing powder.
Spectral Analysis
UV-Visible spectra of the polymeric composites were recorded in DMSO using Lambda 35 Perkin Elmer UV- Visible spectrophotometer (200-1100nm). FTIR spectra were recorded as KBr pellets using a Perkin Elmer FTIR spectrometer in the range of 4000-400cm-1. H1NMR spectra were carried out DMSO on a Bruker 400 MHz Nuclear Magnetic Resonance spectrometer. The Powder X-ray diffraction pattern of mercuric chloride after adsorption was performed using Bruker D8 X-ray diffractometer ,Germany at a scan rate of 1 step/second. The sample was irradiated with CuKα radiation and studied in the range 20-80º (2Ɵ) with a step size of 0.001º. The SEM and EDX spectra of pani matrix were studied using Field Emission Scanning Electron Microscope.
Sorption Experiments
Polymeric composites (2mg) were suspended in a solution of mercuric chloride (10 ml, 0.02M) and sonicated for half an hour at room temperature and centrifuged. Five ml of the supernatant liquid was pipetted out and titrated against KI solution by conductometric method11,13. The mercuric chloride concentration in the centrifugate was calculated from the plot of conductance Vs volume of KI. The sorption curves were constructed from the concentration of mercuric chloride after adsorption (Ce). The initial concentrations (Co) were in the range of 0.01-0.05M.
Effect of Temperature
The adsorption of HgCl2 solutions on Polymeric composites were studied at 5°C intervals ranging from 303 – 318 K to understand the temperature effect. Polymeric composites (2 mg) and HgCl2 (10ml, 0.02M) were sonicated for 30 minutes, after which the concentration of mercuric chloride was determined.
Effect of Contact Time
A known amount (2mg) of adsorbent was sonicated with 10ml of 0.02M of HgCl2 solution at different equilibrium time (10-60minutes). The optimum time required for maximum adsorption of HgCl2 was found to be 30 minutes.
Effect of pH
The influence of pH on the adsorption capacity of polymeric composites were investigated in the pH range 1-13. The compounds (10mg) were suspended in 2.5 ml of conductivity water. HgCl2 (2.5ml, 0.05M) and hydrochloric acid (10-1 to 10-6 M) were added and sonicated for 30 minutes to understand adsorption behaviour in low pH. Similarly, NaOH solutions (10-1 to 10-6M) were used for the study at alkaline pH.
Results and Discussion
Novel organic pani composites polyanilinechloride-(E)-2-((4s-chlorobenzylidene)amino) -3- (3a,7a-dihydro-1H-indol-3-yl)propanoic acid (PTP4ClB) and polyanilinechloride-(E)-3-(3a,7a-dihydro-1H-indol-3-yl)-2-((2-hydroxy-3,5-diiodobenzylidene)amino)propanoic acid (PTPDISA) were prepared, characterized by UV-Visible , FTIR and proton NMR spectra and compared for their adsorption capacity.
UV-Visible Spectra
Electronic spectra of the composites exhibit two bands from 290 nm to 357 nm due to π- π* transitions in benzenoid rings and carbonyl present in carboxylic acid group of tryptophan moiety while polyaniline chloride shows absorptions11 at 310 and 583 nm. This shift in λmax value to lower wavelength confirms the doping of schiff bases on polymer. A small shift observed in both the compounds confirms the adsorption of mercuric ion.
Table 1: Uv-Vmolecule isible spectral analysis of polymer composites
|
Name of the compound |
Λmax (nm) |
|
PTP4ClB |
301, 329 |
|
PTP4ClB- HgCl2 |
299,329 |
|
PTPDISA |
297,357 |
|
PTPDISA-HgCl2 |
298,363 |
|
PaniCl |
310,583 |
|
PaniCl-HgCl2 |
260,602 |
FTIR Spectra
The presence of absorption bands in the range 3500-4000 cm-1 may be OH stretching frequency of -COOH group of tryptophan of molecule in schiff base doped on pani chloride. Appearance of bands at 1645 – 1656 cm-1 due to CH=N stretching vibrations of imines confirms the doping of schiff base on polymer. The composites exhibit peaks between 2312-2358cm-1 due to the presence of iminium sites on pani matrix. The vibrations around 1487-1514 cm-1 indicate the signature peaks of the pani back bone arising due to the stretching modes of the imino benzenoid rings. The broad peaks in the region 1000-1100cm-1 may be attributed to C-N stretching modes of primary amine. The bands around 940-990cm-1 are generally assigned to bending mode of O-H bond. The bending vibrations of the pani back bone are observed around 600-690cm-1. Both PTP4ClB and PTPDISA exhibit a band at about 3300-3400cm-1 due to N-H stretching of amine present in schiff base. A peak at 597cm-1 due to C-Cl and 555 due to C-I further supports the presence of schiff base on the composite. The peaks at 1224 cm-1, 1261 cm-1 and 1004 cm-1 may be attributed to C -N stretching vibration.
Table 2: FTIR spectral analysis of polymeric composites
|
Name of the polymer |
νN-H |
ν O-H |
ν C-H |
ν C=N |
νC-N |
νC-H |
δC-C |
δC-H
|
|
PTP4ClB |
3732 |
3400 |
2358 |
1654 |
– |
1265 -1008 |
947, 642 |
597-553 |
|
PTP4ClB- HgCl2 |
3857-3739 |
– |
2987-, 2318 |
1701-1645 |
1514 |
1049 |
977-921 |
559-513 |
|
PTPDISA |
3859-3741 |
– |
2380- 2312 |
1683-1649 |
1514- 1425 |
1004 |
947 |
599-555 |
|
PTPDISA-HgCl2
|
– |
3377-3000 |
2353- 2154 |
1651 |
1363 |
1093 |
991 |
495-,459 |
|
PaniCl |
3820-3713 |
3423 |
2985- 2358 |
1692- 1588 |
1487 |
1239 |
798 |
505 |
H1NMR Spectral Analysis of Polymeric Composites
Proton NMR spectral data (Fig.1a, b) further supports the doping of imines on pani back bone. Signals at 10.1&9.98 ppm for both the compounds envisage the presence of carboxylic acid proton in indole derivative of adsorbents. The signals around 8.0 and 8.3 are due to imine protons of PTP4ClB and PTPDISA. Appearance of multiplets in the range 6.6-7.7 for both the composites may be attributed to NH & CH protons of the aromatic rings.
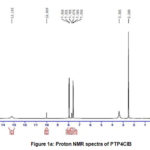 |
Figure 1a: Proton NMR spectra of PTP4ClB |
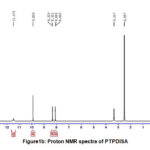 |
Figure1b: Proton NMR spectra of PTPDISA |
Adsorption Studies of Mercuric Chloride on Pani Composites
Experiments on adsorption of mercuric ion by two new organic adsorbents were carried out by batch process. Concentration of mercuric ion in the filtrate after adsorption was measured conductometrically.
Effect of Variation of Mercuric Ion
Langmuir, Freundlich, Temkin, Dubinin Radush- Kevich and Redlich- Peterson models are employed to evaluate the adsorption capacity and the surface properties of adsorbent related to adsorption.14-16
Langmuir Isotherm
This model is used to calculate the amount of Hg2+ ions adsorbed (qm) by Polymeric composites. From the plot of 1/qe vs 1/Ce , it is observed that the process obeys the Langmuir model. The Langmuir constants qm and KL determined from the slope and intercept of the plot are presented in Table 3.
1/qe = 1/ KL qm Ce +1 / qm …………………(1)
In Langmuir equation(1) qm is the maximum monolayer adsorption capacity of the adsorbent (mg/g).
The essential characteristics of the Langmuir isotherm can be expressed by a dimensionless constant called the separation factor RL.
RL=1/1+KLC0 ……………….…(2)
Where KL is Langmuir constant (mg g-1) and C0 is initial concentration of adsorbate (mg g-1).
The RL values indicate that the adsorption process using the adsorbents under investigation is favourable (0<RL<1)17. qm value is greater (0.884 mg/g) for PTP4ClB composite with KL (11.06 L/g) and hence the Langmuir model is best fitted for PTP4ClB in comparison with PTPDISA.
Freundlich Isotherm
The Freundlich adsorption isotherm gives the sorption equilibrium for both monolayer and multilayer adsorption, and is evidenced by equation (3),
log qe= log kF + 1/n log Ce …………………………(3)
where n is related to the intensity of adsorption and kF denotes adsorption capacity. From the plot of log qe Vs log Ce the Freundlich isotherm constant kF (sorption capacity) and 1/n (intensity of sorption) are calculated17-21. The correlation coefficients R2 are shown in Table 3. The higher value of kF is found for PTPDISA (kF = 1.873) indicating multilayered formation.
Dubinin Radush-Kevich Isotherm
The Linear form of DR isotherm is
ln qe = ln qD-Bε2 …………………. (4)
A plot of lnqe Vs ε2 is found to be a linear trace and the constants qD and B calculated from the slope and intercept are presented in Table 3. Dubinin Radush-kevich (DR) isotherm has been usually applied to know whether the adsorption of metal ion is physisorption or chemisorption. The isotherm constant B is relatively higher for PTP4ClB (2.198). From this model it is found that physical nature of adsorption is more suitable for both the composites.
Temkin Isotherm
This isotherm is used to understand the adsorbent –adsorbate interactions. The linearity of Temkin isotherm is represented by equation (5)
qe= BT ln AT + BT ln Ce ……………………………..(5)
The Temkin isotherm equilibrium binding constant (AT) and the Temkin heat of adsorption (BT) are calculated using the slope and intercept of the plot qe Vs lnCe. Temkin heat of adsorption BT is found to be high for PTP4ClB. The higher values of binding constant is observed for PTP4ClB.
Redlich-Peterson Isotherm
RP isotherm can be applied for homogeneous or heterogeneous systems due to its versatility17-21. The mathematical relation of this isotherm is given by equation (6).
Ce/qe = 1/KRP + αRP/KRP Ceβ …………………. (6)
Where, KRP , αRP and β are constants. A plot of Ce/qe Vs Ce is linear and the constants KRP and αRP are determined from the slope and intercept (Table 3 ). KRP value of 4.878 is found for PTPDISA (R2= 0.993) indicating heterogeneous adsorption. The KRP value of 0.9115 for PTP4ClB suggesting homogeneous adsorption.
Table 3: Adsorption studies of HgCl2 on Polymeric composites
|
Isotherm type |
Parameter |
PTP4ClB |
PTPDISA |
|
Langmuir |
KL |
11.06 |
3.03 |
|
qm |
0.884 |
0.549 |
|
|
R2 |
0.992 |
0.952 |
|
|
R |
0.995 |
0.975 |
|
|
|
RL |
0.016 |
0.053 |
|
Freundlich |
N |
0.789 |
1.972 |
|
kF (L/mg) |
0.600 |
1.873 |
|
|
R2 |
0.927 |
0.966 |
|
|
R |
0.962 |
0.982 |
|
|
Dubinin Radushkevich |
qD (mg/g) |
5.926 |
5.185 |
|
B |
2.198 |
1.580 |
|
|
R2 |
0.907 |
0.938 |
|
|
R |
0.952 |
0.968 |
|
|
Tempkin |
BT (L/mg) |
0.042 |
0.037 |
|
AT (KJ/mol) |
0.025 |
0.023 |
|
|
R2 |
0.935 |
0.900 |
|
|
R |
0.966 |
0.948 |
|
|
Redlich Peterson |
KRP (L/mg) |
0.911 |
4.878 |
|
αRP |
28.11 |
92 |
|
|
R2 |
0.905 |
0.988 |
|
|
R |
0.951 |
0.993 |
Effect of Variation of Temperature
In order to verify the influence of temperature variation on the process of adsorption , the experiment was conducted at the temperatures between 303-318 K. The distribution coefficients (Kd) are calculated22 using the equation (7).
Kd = qe/Ce…………………….. (7)
Where qe – the amount of metal adsorbed at equilibrium and Ce – equilibrium concentration of metal ions in solution.
The standard free energy change (ΔG⁰) is calculated from Van’t Hoff equation (8)
ΔG⁰ = -RTln Kd ……………………… (8)
Where R= universal gas constant (8.314 J mol-1K-1)
The slope and intercept values of the plot of lnKd Vs 1/T are used to determine the values of ΔH⁰ and ΔS⁰.
lnKd=-ΔH⁰/RT+ΔS⁰/R ………………….. (9)
Thermodynamic parameters23,24 such as standard free energy of adsorption (ΔG⁰), standard enthalpy of adsorption (ΔH⁰) and the standard entropy of adsorption (ΔS⁰) are very helpful in understanding the adsorbent- adsorbate system. The negative value of ΔG⁰ indicates the feasibility of adsorption process (Table 4). The exothermic nature of adsorption is understood from ΔH⁰ values. The positive value of ΔS⁰ for both the investigated polymers shows the spontaneity of the adsorption process19. It also shows the affinity of adsorbent towards adsorbate species.
Table 4: Thermodynamic parameters for the adsorption of HgCl2 on Polymeric composites
|
Name of the pani composite |
1/T*10-3 |
ΔG⁰ (KJ/mole) |
ΔH⁰ (KJ/mole) |
ΔS⁰ (J/mole) |
|
PTP4ClB |
3.30 3.24 3.19 3.14 |
-3.030 -2.249 -1.660 -0.154 |
-21.44 |
6.881 |
|
PTPDISA |
3.30 3.24 3.19 3.14 |
-2.767 -0.951 -0.580 -0.062 |
-25.68 |
8.091 |
Powder XRD Study
The XRD patterns show several sharp peaks (Fig. 2a) in the region of 10˚-60˚(2Ɵ) with a step size of 0.001⁰ . The average particle size (D) is calculated from Debye Scherrer’s formula (10).
D= 0.9λ/β cos θ …………………………………….. (10)
Where λ = wavelength of CuKa radiation (1.54Å), β= full width at half maximum of peaks25. The Particle size varies from 40-160 nm for the composites. The sharp peaks in the region of 20-62˚ illustrate the crystalline nature of polymeric composite . (Figure 2a,b).
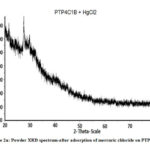 |
Figure 2a: Powder XRD spectrum-after adsorption of mercuric chloride on PTP4ClB |
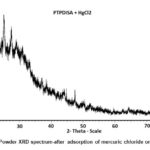 |
Figure 2b: Powder XRD spectrum-after adsorption of mercuric chloride on PTPDISA |
Sem Analysis
The difference in morphology is observed in SEM picture of Polymeric composites before and after adsorption of HgCl2 confirming the adsorption of metal ion (Figure. 2 a-d). The particles are of small spherical in nature before adsorption while after adsorption the particles are larger, rod shaped and non-uniform in their size distribution. The embedded molecules of HgCl2 on Pani backbone are clearly visible.
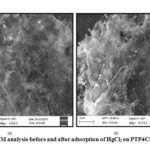 |
Figure 3a,b: SEM analysis-before and after adsorption of HgCl2 on PTP4ClB composite |
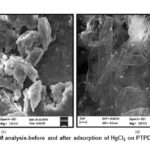 |
Figure 3c,d: SEM analysis-before and after adsorption of HgCl2 on PTPDISA composite |
EDX Analysis
Energy dispersive X- ray technique is used to find out the elemental composition and chemical characterisation of samples. The EDX spectra of the chosen composites present sharp peaks at 2-3 KeV strongly supporting the adsorption of mercuric ions on pani matrix.(Fig.3a,b)
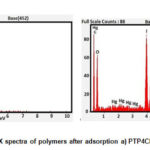 |
Figure 4: EDX spectra of polymers after adsorption a) PTP4ClB b) PTPDISA |
Conclusion
Two schiff base (TP4ClB and TPDISA) doped polymer composites (PTP4ClB amd PTPDISA) were prepared and characterized by UV-Visible, FT-IR and proton NMR spectroscopic techniques. The adsorption behaviour of the adsorbents were understood from Langmuir, Freundlich, Dubinin Radushkevich, Temkin and Redlich Peterson isotherm models. It is observed that adsorption of mercuric chloride on both the new polymeric compounds is a favorable process as the adsorbents are best fitted for all the isotherms studied. The thermodynamic parameters calculated in the present work further confirms the feasibility of the adsorption process. SEM micrograph, PXRD and EDX spectra recorded after adsorption are the supporting tools to indicate the adsorption of mercuric ion on the chosen adsorbents.
Acknowledgement
The authors express their heartfelt thanks to the Management, Principal, Vice principal of Seethalakshmi Ramaswami College, Trichy for the facilities provided and the continuous encouragement to carry out this research work.
Conflict of Interest
The authors decided that there is no conflict of interest regarding the publication of this paper.
References
- Babu Rao, G.; Krishna Prasad, M.; Murthy, Ch. V. R.; Int.J.Chem.Sci., 2015, 13, 1893-1910.
- Nishiyama, Y.; Hanafusa, T.; Yamashita, J.; Yamamoto, Y.; Ono, T.; J.Radioanal Nucl. Chem., 2016, 307, 1279-1285.
CrossRef - Dalia, M.; Saad, Ewa. M.; Cukrowska; Appl. water Sci., 2013, 3, 527-534.
CrossRef - Saad, D.W; Cukrowska, E. M.; Tutu, H.; Appl. Water Sci, 2013, 3,527-534.
CrossRef - Bayazeed, H.; Abdullah, ; Yousif, M. Salh.; Orient.J.Chem.,2010, 26, 763-773.
- Qin, Li.; Li Sun.; Ya Zhang.; Yan Qian.; Jianping Zhai. ; Desalination, 2011, 266, 188-194.
CrossRef - Iqbal, S. A.; Sibi Jose.; Ishaq Zaafrany; Orient.J.Chem, 2012,28, 613-618.
CrossRef - Padmavathy, K. S.; Madhu, G.; Haseena, P. V.; Procedia Technology, 2016,24, 585-594.
CrossRef - Joseph, A.; Ramamurthy, P. C.; Subramanian, S.; J.Appl.Polymer Sci, 2012,123, 526-534.
CrossRef - Vivekanandan, J.; Ponnusamy, V.; Mahudeswaran, A.; Vijayanand, P. S.; Scholars research library, Archives of applied science research, 2011, 3,147-153.
- Dhivya, C.; Vandarkuzhali, S. A. A.; Santhi, R.; Radha, N.; Indian J. Appl.Res., 2013,6 , 62.
- Rajeswari, B.; Santhi, R.; Radha, N.; International Journal of Research and Analytical Reviews, 2018, 5 , 25-30.
- Abu nasar.; Fouzia Mashkor.; Environmental science and pollution research, 2019, 26, 5333-5356.
CrossRef - Ayawei, N.; Godwin, J.; Wankasi, D.; Int.J.Chem.Sci, 2015,13, 1197-1217.
- Djebbar, M.; Djafri, F.; Bouchekara, M.; Djafri, A.; Appl Water sci, 2012, 2, 77-86.
CrossRef - Singh, V. K.; Soni, A.B.; Singh, R.K.; Int.J.Chem.Sci., 2016,14, 2116-2138.
- Nethaji, S.; Sivasamy, A.; Mandal, A. B.; Int. j. Envir.Sci.Technol., 2013, 10, 231-242.
CrossRef - Moftakhar, M. K.; Yaftian, M.R.; Ghorbanloo, M.; Int. J. Environ. Sci.Technol., 2016, 13, 1707-1722.
CrossRef - Jameer Ahammad, S.; Sumithra, S.; Subha, R.; International Journal of chemical scinces, 2017, 15 ,161-172.
- Nimibofo Ayawei.; Augustus Newton Ebelegi.; Donbebe wankasi.; Hindawi journal of chemistry, 2017, 1-17
CrossRef - Mustapha, S.; Shuaib, D.T.; Nasirudeen, M.B.; Applied water science,2019 ,9,142.
CrossRef - Renu , Madhu Agarwar, Singh, K.; Journal of water reuse and desalination, 2017.
CrossRef - Ayawei, N.; Ekubo, A.T.; Wankasi, D.; Dikio, E.D.; Orient.J.Chem ,2015, 31,1307-1318.
CrossRef - Reza Amini.; Nizomov, Z.; Razazi, M.; Ganiev, I.N.; Obidov, Z.R.; Orient.J.Chem, 2012, 28, 841-846.
CrossRef - Madavan, R.; Murugesan, M.; Manikavasakam, K.; Sathish, R.; Manikandan, R.; Savariraj Sagayam, C.; Brindha, P.; International journal of pharmacy and pharmaceutical sciences, 2012, 4, 163-166.

This work is licensed under a Creative Commons Attribution 4.0 International License.
![]()
A New Edition of Web of Science
Journal Impact Factor
2022: 0.5
Five Year: 0.8
Journal is Indexed in

Cabells Whitelist
![]()


