Green-Synthesized Silver Nanoparticles as Sensor Probes for the Naked-Eye Detection of Hydrogen Peroxide
Darwin Fetalbero Reyes
Chemistry and Environmental Science Department, College of Arts and Sciences, Nueva Ecija University of Science and Technology, General Tinio St., Cabanatuan City, Nueva Ecija, Philippines 3100
Corresponding Author E-mail : darwin.chem@gmail.com
DOI : http://dx.doi.org/10.13005/ojc/360407
Article Received on : 24 June 2020
Article Accepted on : 24 July 2020
Article Published : 24 Jul 2020
The application of noble metal nanoparticles such as silver (AgNPs) in sensing small molecules has attracted many researchers worldwide. In this present investigation, AgNPs were synthesized via a one-pot and green strategy of using alkaline sucrose solution as the reducing agent. The AgNPs were characterized by UV-Vis spectroscopy and dynamic light scattering techniques. The AgNPs were confirmed through its surface plasmon band and had a narrow size distribution and good colloidal stability. The AgNPs were then applied as sensor probes in the visual detection of hydrogen peroxide. The sensing mechanism is based on the reduction-oxidation reactions that led to the observed color changes. The detection limit was found to be 1 x 10⁻³ M as monitored through visual observation and image analysis. The study showed a great promise on the potential of AgNPs in the detection of small molecule targets for environmental and health sensor applications.
KEYWORDS:Green Synthesis; Hydrogen Peroxide; Sensor Probes; Silver Nanoparticles; Visual Detection
Download this article as:| Copy the following to cite this article: Reyes D. F. Green-Synthesized Silver Nanoparticles as Sensor Probes for the Naked-Eye Detection of Hydrogen Peroxide. Orient J Chem 2020;36(4). |
| Copy the following to cite this URL: Reyes D. F. Green-Synthesized Silver Nanoparticles as Sensor Probes for the Naked-Eye Detection of Hydrogen Peroxide. Orient J Chem 2020;36(4). Available from: https://bit.ly/30Heo5F |
Introduction
Extensive research on metal nanoparticles, especially silver, has been increasing due to its excellent physical and chemical properties.1 One of the unique properties of silver nanoparticles (AgNPs) is its optical property based on the resonant oscillation of the conduction electrons upon interaction with light. This phenomenon is known as surface plasmon resonance (SPR).2 Due to this phenomenon, AgNPs exhibit color change that is dependent on its size and morphology, thus, AgNPs have been developed as a promising sensor probe for the detection of different molecules from various matrices facilitating the detection of a target with the naked eye.3 AgNPs have been used recently for the detection of Hg(II) and Fe(II),4 ammonia,5 Ba(II) and Ni(II)6, endrin7 and triethylamine.8 Compared to the gold precursor, the precursor for AgNPs has lower cost ,and AgNPs are easier to synthesize.9
The progression of green synthesis of metal nanoparticles is an advancing key field of nanotechnology.10 Green synthesis does not require extreme reaction conditions such as high temperature, pressure and energy, and the use of toxic chemical reagents. Moreover, green synthetic alternatives are low-cost and utilize environment-friendly reagents.1 Recently, the use of fruit extracts,11 medicinal plant extracts,12 polysaccharides,13 amino acids,14 and cyanobacterial extracts15 as the reducing agents in the green synthesis of AgNPs have been reported. These methods showed interesting and efficient strategies in producing AgNPs with interesting physical and chemical properties.
Encouraged by these facts, herein, AgNPs were prepared via a green strategy of using sucrose as the reducing agent. The synthesized AgNPs were then utilized as sensor probes for a simple colorimetric assay for the visual detection of a small molecule, hydrogen peroxide (H2O2). H2O2 has been used in the industry as an oxidizing, whitening, and sterilizing agent in packaging materials due to its antimicrobial properties. Thereby, specific amounts of H2O2 is released in the environment.16 Moreover, in living organisms, H2O2 decomposes to reactive oxygen species (ROS) that may lead to irreversible biological damage and eventual dysfunction of biological processes.17 Therefore, H2O2 detection and measurement are not only vital from an analytical point of view, but they are also essential in aspects of human health and the environment.18 Several methods for H2O2 detection (and its detection limits) have been reported such as a spectrometric method that used a peroxidase enzyme immobilized on a glass substrate (1.5 x 10⁻⁵ M),19 a colorimetric detection utilizing a dioxide-vanadium(V) complex (5.7 x 10⁻⁶ M)20 and a method that used a fullerene C60-coated piezoelectric quartz crystal sensor (2 x 10⁻³ M) .21 The results of these methods showed high accuracy and reliability of performance in determining H2O2 in samples. However, these methods utilized expensive reagents, enzymes, and instrumentation. In this study, a simple and easy method was developed for H2O2 detection without costly and complicated detection instruments.
Materials and Methods
Chemicals and equipment
Chemical reagents such as silver nitrate (AgNO3), sucrose, sodium hydroxide (NaOH), and H2O2 solution (20 volumes) were used without any further purification. Distilled and deionized waters were used as the solvent to prepare all the solutions used in this study.
A UV1800 UV-Vis spectrophotometer (Shimadzu, Japan) was used for the AgNP characterization and estimation of concentration. A ZetaSizer Nano ZS (Malvern, UK) was used to determine hydrodynamic size and zeta potential values.
Synthesis of Green AgNPs
The green synthesis of AgNPs was adapted from previous literature with some modifications.22 In brief, 5 grams of sucrose were dissolved in 100 mL of distilled water. The pH of the sucrose solution was adjusted to pH 10 using a dilute NaOH solution. The resulting mixture was then allowed to boil for some minutes, and afterward, 2.5 mL of 1 x 10⁻² molar concentration (M) of AgNO3 precursor solution was added. The reaction mixture was boiled for another 30 minutes with vigorous stirring. The observable change in the color of the reaction mixture signified the completion of the synthesis. The synthesized AgNPs were transferred to an amber reagent bottle and stored at 4 °C before characterization experiments.
Characterization of Green AgNPs
The synthesized AgNPs were characterized using UV-Vis spectroscopy and dynamic light scattering (DLS) experiments. The synthesized green AgNPs were diluted with distilled water, and the absorbance values from 350-700 nm were obtained. The concentration was estimated from its absorbance at the maximum absorption wavelength (λmax) and molar extinction coefficient of 300 x 108 from a tabulated reference data-set.23 For the hydrodynamic size measurements, the dilute solution of AgNPs was prepared in filtered deionized water, and the hydrodynamic size was measured at 25 °C after an equilibration time of 120 seconds. The zeta potential (ZP) was measured by placing an AgNP solution in a folded capillary cell, and the ZP were measured after an equilibration time of 120 seconds at 25 °C. Triplicate measurements were conducted for all samples.
Colorimetric Assay for the Visual Detection of H2O2
The colorimetric assay for the detection of H2O2 was performed by mixing 1 mL of various concentrations of H2O2 solutions (1 x 10⁻⁷ to 1.7 M) and diluted AgNP solution (0.2 mL in 2.8 mL of water). The diluted H2O2 solutions were prepared from the stock H2O2 solution in which the concentration was verified by permanganate titration.24 The reaction mixture was kept at room temperature for 30 seconds reaction time. The changes in the intensity of the color of the solutions were visually monitored. The photographs of the solutions were taken inside a lightbox using a smartphone camera, and images were analyzed using ImageJ software (https://imagej.nih.gov/ij/).
Results and Discussion
Synthesis and Characterization of Green AgNPs
The completion of the synthesis was signified by the change in the color of the reaction mixture. The initial colorless solution turned to a yellow-colored solution and is attributed to the reduction reaction of Ag+ to Ag0 that indicated the formation of AgNPs.4 Adjusting the pH of the solution to an alkaline pH using NaOH caused the hydrolysis of sucrose to yield glucose and fructose products that were responsible for the reduction reaction of Ag+ .25 Reducing sugars such as glucose and fructose contains a free carbonyl group that can donate electrons to oxidized molecules such as Ag+ ion.26 Further, glucose is an aldohexose that can be oxidized to form gluconic acid.8 According to this literature,8 a large number of hydroxyl (-OH) and oxygen molecules of sugars act as a covering to the nanoparticles that protect against agglomeration. Therefore, sucrose can also act as a capping agent in the synthesis.
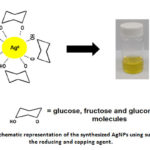 |
Figure 1: Schematic representation of the synthesized AgNPs using sucrose as the reducing and capping agent. |
UV-Vis spectroscopy is one of the useful techniques in confirming the formation of metal nanoparticles.27 The λmax for the AgNPs was observed to be at 411 nm (Figure 2), which is within range of 320–580 nm that is considered as a fingerprint of AgNPs.15 From these absorbance values, the concentration of AgNPs was estimated to be equal to [2.52 (± 0.01 )]x 10-2 nM.
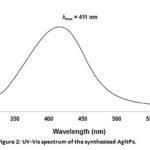 |
Figure 2: UV-Vis spectrum of the synthesized AgNPs. |
It is reported that the addition of NaOH in the reaction system increases the reaction rate and, subsequently, the formation of smaller particles.28 Thus, the hydrodynamic size of the AgNPs is 30.1 ± 4.2 nm, with a polydispersity index (PdI) of 0.55 (Figure 3). PDI is a dimensionless number used to describe the non-uniformity of the size distribution of the tested particles. Samples with a PdI greater than 0.7 is an indication of broad particle size distribution.29 The PdI obtained in the synthesis is below 0.7, which indicates the narrow size distribution of the AgNPs.
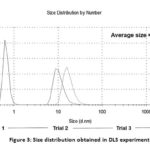 |
Figure 3: Size distribution obtained in DLS experiments. |
ZP was measured to assess the colloidal stability of AgNPs. It is defined as the measure of the potential difference between the bulk fluid (dispersing medium), and a stationary layer of fluid that is associated with the nanoparticle surface30. The magnitude of the ZP predicts the stability of the nanoparticle dispersion. Nanoparticle with values greater than ±30 mV has been reported to have a high degree of stability31. Therefore, the ZP value of -26.3 ± 1.7 mV of the synthesized AgNPs showed that the AgNPs have good stability (Figure 4). Moreover, the negative value is attributed to the presence of the hydrolysis products of sucrose that contains negative carboxylate moieties.
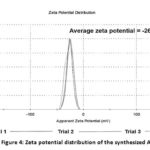 |
Figure 4: Zeta potential distribution of the synthesized AgNPs. |
Application of AgNPs for the Naked-Eye Detection of H2O2
To establish an analytical strategy, H2O2 solutions with varying concentrations were mixed with the AgNP sensor probes, and the changes in the color of the AgNP solution were monitored. It is observed that the intensity of the yellow color decreases with increasing H2O2 concentration (Figure 5). This observation is attributed to the oxidation of Ag0 by H2O2 as the oxidizing agent (1).32
2Ag + H2O2 → 2Ag+ + 2OH– (1)
It is also reported that the change in color is due to the AgNP aggregation, thereby the yellow coloring fades as the concentration of H2O2 increases.33 Results showed that the yellow color of the AgNP solution was not visible in 1 x 10⁻³ M of H2O2. Hence, the visual detection limit was set to 1 x 10⁻³ M.
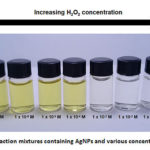 |
Figure 5: Reaction mixtures containing AgNPs and various concentrations of H2O2. |
The variation in the intensity of the color of the solutions was also analyzed by monitoring the change in the intensity of the red, green, and blue (RGB) color values using an ImageJ, as reported in a recent literature.32 Blue is the complementary color of the yellow-colored AgNP solution. Thus, the intensity values of the blue channel were monitored.34 Results showed that the change in the intensity value of the blue channel is evident at 1 x 10⁻³ M that confirms the visually observed detection limit (Table 1).
Table 1: Intensity values (in intensity units) of the blue channel in reaction mixtures containing various concentrations of H2O2
|
Concentration of H2O2 solution, M |
0 |
1×10⁻⁷ |
1×10⁻⁶ |
1×10⁻⁵ |
1×10⁻⁴ |
1×10⁻³ |
1×10⁻² |
1×10⁻¹ |
1.7 |
|
Intensity of blue channel, intensity units |
112 |
115 |
122 |
125 |
133 |
213 |
218 |
217 |
219 |
Conclusion
In this report, AgNPs were prepared via a one-pot and green method of using alkaline sucrose solution as the reducing and capping agent. Characterization experiments revealed that the synthesized AgNPs were in the nano range size with a narrow size distribution. It has good stability, as shown by its zeta potential value. It is suggested to explore the other types of biomolecules to be used as the reducing and capping agents. Moreover, the green synthesized AgNPs were used as sensor probes for the naked-eye detection of H2O2 in sample solutions. The changes in the characteristic color of the sample solution were observed visually, and the color change was further assessed by image analysis. The results of the study demonstrated the potential of green AgNPs as sensor probes for the development of simple chemosensors in detecting small molecule targets without the use of expensive instruments.
Acknowledgments
The author would like to thank the Chemistry Department and Materials Science and Engineering Research Laboratory of the Ateneo de Manila University for the instrumental analysis and to the Nueva Ecija University of Science and Technology for the financial support.
Conflicts of Interest
The author declares that there are no conflicts of interest related to this article.
References
- Ismail M.; Khan, M. I.; Akhtar, K.; Seo, J.; Khan, M. A.; Asiri, A. M.; Khan, S. B. Mater. Sci.: Mater. Electron. 2019. 30, 7367–7383.
- Ullah, A.; Ateeq, M.; Shah, M. R.; Muhammad, M. T.; Shah, F.; Khan, I.; Fazil, P.; Khalique, A.; Khan, M. I J. Environ. An. Ch. 2018. 98(10), 977-985.
- Derayea, S. M.; Omar, M. A.; Hammad, M. A.; Hassan, Y. F. App. Pharm. Sci. 2017. 7(2), 016-024.
- May, B. M. M.; Oluwafemi, O. S. J. Electrochem. Sci. 2016. 11, 8096 – 8108.
- Buccolieri, A.; Serra, A.; Giancane, G.; Manno, D. Beilstein J. Nanotechnol. 9, 499-507.
- Shrivas, K.; Maji, P., Dewangan, K. Acta A. 2017. 173, 630-636.
- Shrivas, K.; Nirmalkar, N.; Ghosalea, A.; Thakur, S. S. RSC Adv. 6, 29855-29862.
- Filippo, E.; Manno, D.; Buccolieri, A.; Serra, A. Actuators B Chem. 2013. 178, 1-9.
- Almaquer, F. E. P.; Ricacho, J. S. Y.; Ronquillo, R. L. G. Environ. Res. 2019. 29, 23.
- Ahmed, S.; Ahmad, M.; Swami, B. L.; Ikram, S. J. Res. 2016. 7(1), 17-28.
- Legaspi, D. S.; Fundador, G. V. J. Sci. 2020. 149(1), 239-246.
- Ahmed, R. ; Mustafa, D. E. Int. Nano. Lett. 2020. 10, 1-14.
- Wang, Y.; Dong, X.; Zhao, L.; Xue, Y.; Zhao, X.; Li, Q.; Xia, Y. Nanomaterials (Basel). 10(1), 83.
- Sharma, R. J. Chem. 2020. 36(2).
- Hamouda, R. A.; Hussein, M. H.; Abo-Elmagd, R. A.; Bawazir, S. S. Rep. 2019. 9(1), 13071.
- Fusco, G; Bollella, P.; Mazzei, F.; Favero, G.; Antiochia, R.; Tortolini, C. Anal. Methods Chem. 2016. 2016, 8174913.
- Jacewicz, D.; Siedlecka-Kroplewska, K.; Drzeżdżon, J.; Piotrowska, A.; Wyrzykowski, D.; Tesmar, A.; Żamojć, K.; Chmurzyński, L. Rep. 2017. 7, 45673.
- Amirjani, A.; Fatmehsari, D. H. 2018. 176, 242-246.
- Hsu, C. C.; Lo, Y. R.; Lin, Y. R.; Shi, Y. C., Li, P. L. Sensors (Basel). 15(10), 25716–25729.
- Kurbah, S. D.; Syiemlieh, I.; Lal, R. A. R. Open Sci. 2015. 15(10), 171471.
- Chuang, C. W.; Luo, L. Y.; Chang, M. S.; Shih, J. S. Chin. Chem. Soc. 2009. 56, 771-777.
- Filippo, E.; Serra, A.; Buccolieri, A.; Manno, D. Non-Cryst. Sol. 2010. 356(6-8), 344-350.
- Paramelle, D.; Sadovoy, A.; Gorelik, S.; Free, P.; Hobleya, J.; Fernigb, D. G. Analyst, 139, 4855.
- Huckaba, C. E.; Keyes, F. G. Am. Chem. Soc. 1948. 70(4), 1640-1644.
- Valodkar, M.; Bhadoria, A.; Pohnerkar, J.; Mohan, M.; Thakore, S. Res. 2010. 345(12), 1767-1773.
- Agudelo, W.; Montoya, Y.; Bustamante, J. 2018. 85(206), 69-78.
- Edison, T. N. J. I.; Atchudan, R.; Lee, Y. R. Clust. Sci. 2016. 27, 683-690.
- Lakkappa, B. A.; Jasmith, S. C.; Prabhuodeyara, M. G. Organic & Medicinal Chem IJ. 3(5), 555622.
- Danaei, M.;Dehghankhold, M.; Ataei, S.; Hasanzadeh Davarani, F.; Javanmard, R.; Dokhani, A.; Khorasani, S.; Mozafari, M. R. 2018. 10(2), 57.
- Barba, A. A.; Bochicchio, S., Dalmoro, A.; Caccavo, D., Cascone, S., Lamberti, G. Nanomaterials for Drug Delivery and Therapy. 267-304.
- Shnoudeh, A. A.; Hamad, I., Abdo, R. W.; Qadumii, L.; Jaber, A. Y.; Surchi, H. S., Alkelany, S. Z. Biomaterials and Bionanotechnology. 572-612.
- Koshy, O.; Thankappan, A.; Vibin, B.; Thomas, S.; Mujeeb, A. Bionanosci. 2016. 10(5), 377-380.
- Noghabi, M. P.; Parizadeh, M. R.; Ghayour-Mobarhan, M.; Taherzadeh, D.; Hosseini, H.A.; Darroudi, M. Mol. Struct. 2017. 1146, 499-503.
- Firdaus, M. L.; Aprian, A.; Meileza, N.; Hitsmi, M.; Elvia, R.; Rahmidar, L.; Khaydarov, R. R. 2019. 7(2), 25.

This work is licensed under a Creative Commons Attribution 4.0 International License.
![]()
A New Edition of Web of Science
Journal Impact Factor
2022: 0.5
Five Year: 0.8
Journal is Indexed in

Cabells Whitelist
![]()


