Fabrication, Characterization and Antibacterial Study of Poly (Vinyl Alcohol) PVA/Cuprous Oxide (Cu2O) Nanofluids and Polymer Nanocomposite Films
1Department of Chemistry, Centurion University of Technology and Management, Odisha, India
2Silicon Institute of Technology, Bhubaneswar, Odisha, India
Corresponding Author E-mail: dr.skbiswal@cutm.ac.in
DOI : http://dx.doi.org/10.13005/ojc/360416
Download this article as:
![]()
Nanofluid-a term coined by Choi (1995) is obtained by the colloidal suspension of nanoparticles (NPs) like metal oxides, metals, fullerene, graphene, carbon nanotube, etc. in a base fluid such as water, plant extract, polymer solution, etc. Polymer nanocomposites(PNCs) are developed by homogeneous dispersion of NPs in a solution of polymer or copolymer. Here the focus is on the synthesise of cuprous oxide (Cu2O) nanoparticles at room temperature using aqueous leaves extract of Calotropis gigantea. L. via chemical reduction route and development of poly (vinyl alcohol) PVA-cuprous oxide (Cu2O) nanofluids (NFs) and nanocomposite films. The NFs and nanocomposite films so fabricated were subjected to characterization by spectrophotometers, diffractometer, High resolution microscope, and disk diffusion antibacterial test. UV- Visible spectrum shows a characteristic broad absorption band observed near 470 nm suggesting presence of cuprous oxide NPs in the NFs. The shift in the vibrational band of –OH group of PVA in the presence of metal oxide NPs reveals chemical interaction between –OH group of PVA and NPs. XRD study suggests the occurrence of Cu2O NPs in the PNC film and NPs are crystalline in nature. SEM image shows the presence of agglomerated NPs in a polymer matrix. From the antibacterial study, it is found that NPs in aqueous plant extract without PVA exhibits superior antibacterial activity in comparison to NPs in presence of PVA polymer.
KEYWORDS:Antibacterial Activity; Calotropis Gigantea.L; Nanofluids (NFs); Nanocomposites; Polymer Nanocomposites (PNCs)
Introduction
Polymer nanocomposites (PNCs) are the ultra-small counterparts of the polymer matrix which carry the organic or inorganic nanofillers. These nanofillers aregenerally one dimensional and are arranged uniformly through a nanoscale dispensation. In recent time nanocomposites especially PNCs grabs the attention in the field of research and Industry for its wide applications. Due to light weight, cost efficiency and excellent physiochemical properties, polymeric materials are being used in the place of conventional materials.1 The addition of nanofillers evince tremendous improvement in the properties of the polymer. The use of nanofillers also lowers the content loading on the polymer matrix than that of the use of micro fillers.2,3 Several researches have been carried out to synthesize various polymeric nanocomposites for the study of their utilization in different fields. Several types of polymers (like polypropylene, polyvinyl alcohol (PVA), polyaniline, polyethylene, polyvinyl chloride polyamide, etc.) are loaded with various types of nano-fillers such as CuO, Cu2O(cuprous oxide), ZnO, ZnS, CdSe, CuS, CdS, Graphene Oxide, FeO, etc. for the enhancement in structural, optical, mechanical, and electrical properties of PNCs.1-3
Metal oxide NPs play a very crucial role in material science. Metallic elements can form a number of oxides. Distinctive physical and chemical properties results from their minute size and high packing fraction at corner or edge sites of NPs. For nanoparticles to have superior mechanical or structural stability, it must have lower surface free energy. This structural property has been detected in TiO2, VOx, Al2O3or MoOx oxides..1-3 The selection of synthetic approach is done based on desired characteristics needed in the NPs e.g. size, morphology, crystal structure, etc.
Metal oxide NPs also exhibit optical and electrical conductivity more prominently as well as catalysis activity. Metal oxide also posses’ unique and tunable properties like magnetic, mechanical, thermal, catalytic, biomedical, photochemical etc. These properties made them excellent candidates for several technological applications like fuel cell, chemical sensors, optical devices, solar cells, and magneto- resistance and so on. There are various metal oxide nanoparticles like ZnO, NiO, TiO2, and Fe3O4 which grabs all the attention of the research but in this thesis, we will put a light on Cu2ONPs. Now-a- days PVA is extensively used as a material in different functions. PVA nanocomposites comprise fillers in the nano-scopic range and these fillers made from metals (Ag, Au, etc.), non-metals (graphene), metal oxides (TiO2, Cu2O, ZnO, etc) metal sulphides (Ag2S), inorganic (CNT, clays, silicates, etc.), or combinations of these materials.4-6 “Cao and Xiao7 have prepared Cu2O/PVA/Chitosan composite films via a one-step liquid phase precipitation-reduction method and tape casting process”. Composite films exhibit efficient photocatalytic activity for decolorization of dye X-3B under visible light irradiation. Using PVA–Cu(II) complex as precursor salt, hybrid composite like PVA–Cu2O has been developed via chemical route.8 Wang et al.9 reported that using a simple and practical approach, one can synthesize polymer composites where PVA is the matrix and grapheme acts as reinforcing agent. PVA/Cu2O PNCs films were prepared by irradiation of γ-ray.10 “They reported that such PNCs film can used for radiation detection and personal dosimeter in rural sectors and low economic countries”. “Qian et al.11 prepared PVA based nickel, cobalt, and iron sulfide nanocomposites via a hydrothermal process”. “Saini et al.12 used PVA grafted silicon carbide (SiC) nano crystals to enhance the properties of PVA”. “Krkljes et al.13 prepared Ag- PVA PNCs loaded with various Ag-contents”. γ-irradiation is used to reduce silver ions in presence of PVA solution in water.
In this work, we have adopted a wet chemical route in synthesizing Cu2O NPs using Calotropis gigantean leaf extract in an aqueous medium. The saponin extract and hydrazine hydrate were used as stabilizing and reducing agent in the aqueous medium.
Experimental
Preparation of Polyvinyl Alcohol (PVA) Solution
White crystalline polyvinyl alcohol solid weighing 6g was taken in a beaker containing 200 ml of de-ionized water to prepare 3% (wt) PVA solutions. Then the solution was put in a magnetic stirrer whose temperature was fixed at 80 0C for 3 h. A watch glass was placed on the beaker to avoid water loss. When the crystalline PVA solid dissociates completely with the deionized water, we got PVA solution.
Preparation of Calotropisgigantea.L leaf Extract in Water
Green leaves were collected from Arka tree (Calotropis gigantea. L.) present near the campus of SIT, Odisha. Then, green leafs weighing 10g was taken and washed thoroughly with distilled water. Then the cleaned 10g leaves were taken in a beaker. It contains 100 ml of ion-free water (i.e., 1000 mg/L). After maintaining the temperature of the hot magnetic stirrer plate at 800 the , the beaker was placed on it for 90 minutes. A watch glass was placed on it to avoid any loss of water during the process of heating. After cooling the sample, we use Whatman 42 paper (2.5 µm) filter paper to remove the solid particles. To avoid it from any ageing process, we preserved the sample at -10 0C.
Synthesis of Cu2O NPs
We have adopted a wet chemical route to synthesize NPs in an aqueous medium. At first required amount of copper sulphate (CuSO4. 5H2O) crystal was added to the requisite volume of double distilled water to prepare a solution of various concentrations (i.e., 0.05 M, 0.1 M, 0.2 M, 0.3 M and 0.4 M). Then freshly prepared leaf extract was added to the CuSO4 solution in a ratio of 3:1 at RT (that means 75ml of leaf extract was mixed with 25ml of CuSO4 solution). On addition of CuSO4 solution to the leaf extract the color changed from fade yellow to blue and the solution was stirred continuously in room temperature for 30 minutes and hydrazine hydrate was added drop as a reducing agent. The colour changed to permanent reddish-brown after some time indicating formation of cuprous oxide NPs as a dispersed phase in aqueous dispersion medium with plant extract. The color change is due to the conversion of Cu2+ to Cu2O by hydrazine in presence of plant extract. The nano-colloids so obtained were preserved for synthesis of PNCs. Some portion of nano-colloids were kept standstill for overnight to facilitate settling of Cu2O NPs at the bottom of the container. After careful decantation, NPs were collected and kept in an oven at 80 0C to get nano-powders.
Development of PVA-Cu2O PNC Films and NFs
Nano-colloids of variable volume were poured into a constant volume of PVA solution taken in a beaker with continuous stirring. Five samples of NFs have been prepared with various proportions of Cu2O NPs. For PNCs development, the NFs were filled in petridises and then kept in oven at 90 0C for 10 h for complete removal of the solvent. After drying the films, it was kept in an evacuating chamber till characterizations.
Characterizations
UV-Visible
The UV-Visible spectra of liquid samples in water were studied in 200-900 nm regions by a Perkin-Elmer Lambda 750 UV-Visible spectrophotometer. The spectra were recorded against water taken as the reference. The machine automatically subtracts the reference spectrum from the sample and gives the resultant ones. This spectrometer records the absorption over the wavelengths (λ) as per the degree of absorption at each λ-value within the band. The resulting spectrum is presented as a graph of absorbance Vs λ. It is a very sensitive analytical tool for characterizing optical and related properties of the materials.14 As the transition between two electronic levels is almost invariably accompanied by simultaneous transitions between the vibrational and rotational energy levels, an electronic spectrum of is generally very complex and bands are broad in nature.
FTIR
The FTIR spectra of the liquid samples were recorded within 400 to 4000 cm-1by help of a perkin-Elmer (Spectrum 65) spectrophotometer in ATR mode on a Zinc Selenide crystal . The sharp and broad bands are observed at an accuracy of ± 2 cm-1and ± 5 cm-1. It is used by researchers to determine functional groups in molecules and any interaction occurs between molecules.15
XRD Analysis
The
crystalline structures of Au-NPs were analyzed in terms
of the wide angled X-ray diffractometer (PHILIPS model PW-1710). The
diffraction patterns were recorded using a filtered monochromatic radiation of CuKα
of λ = 0.15405 nm through a Ni filter by casting the samples on the Si
plate at a scanning angle (2ϴ) of 100 to 1000 scanning
speed of 0.05 m/s and voltage of 40 kV to current 20 mA. Average crystallite
size (D) was analyzed from peak-widths of the diffracted pattern with the help
of Debye-Scherrer formula16
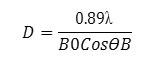
Where B0 is the full-width at half maximum intensity (fwhm) and 2ϴB is the position of a characteristic diffraction peak from a crystallographic plane (hkl).
SEM (FESEM)
Then microscopic images were taken at selective scales of magnifications of some of the samples with the help of Oxford model Leo1550 VP SEM. The images were taken at an accelerated voltage in the 2- 10 kV range by depositing the liquid samples on Si substrate dried in desiccators coated with thin Au film.17
Antibacterial Study
The anti-bacterial study of the samples was done by disk–diffusion and broth or agar dilution methods to know the antibiotic sensitivity of bacteria. In this test, agar plates are immunized with a standardized inoculate of the test microorganisms. Then, filter paper discs (~ 6 mm in diameter) containing the test sample at a desired concentration is placed on the agar surface. Then Petri dishes are incubated under suitable conditions (35 0C for 2 days). Usually the antimicrobial agent in the sample diffuses into the agar and inhibits germination and growth of the test microorganisms. If the sample/antibiotics prevent the bacteria from either growing or killing it, then there will be an area around the paper where the bacteria have not grown enough to be visible. This is called a zone of inhibition. Then diameters of inhibition growth zones are measured for comparison of efficacy of samples towards antibacterial activity.18,19
Results and Discussion
UV-Visible Analysis
The optical absorption spectrum of PVA-Cu2O NFs in 250–600 nm regions confirms the formation NPs and stability of NPs in an aqueous medium. Fig.1 shows the UV-Vis spectra of PVA-Cu2O NFs consisting of (a) 10.00, (b) 20.00, (c) 30.00, (d) 50.00, and (e) 100.00 nM Cu2O NPs in an aqueous leaf extract of Calotropis gigantea.L. Two broad bands, one near 290 nm and another near 460 nm for our samples were observed. The band near 460 nm suggests presence of Cu2O NPs in the nanofluids.20-24 The band near 290 nm is from n—> π* electronic transition of PVA polymer.25 It is observed from the Fig.1.that this band is shifting to lower wavelength side with an increase in the NP-contents. This suggests that PVA- Cu2O PNC film could be used for UV protection coating.
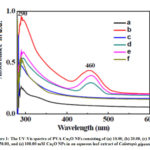 |
Figure 1: The UV-Vis spectra of PVA-Cu2O NFs consisting of (a) 10.00, (b) 20.00, (c) 30.00, (d) 50.00, and (e) 100.00 |
FTIR Analysis
FTIR study also helps in identifying, capping and stabilizing capacity of saponin and polymer. The FTIR spectra of five NFs consisting of (a) 10.00, (b) 20.00, (c) 30.00, (d) 50.00, and (e) 100.00 mM Cu2ONPs in an aqueous leaf extract of Calotropisgigantea.L. in the wavenumber range of 600-3500 cm-1 is shown in Fig.2. It is observed that a relatively broad and intense O-H stretching band was appeared between 3220 – 3500 cm-1 which indicates the presence of polymeric association of the free hydroxyl groups and bonded OH stretching vibration.25 The band appeared between 600-1500 cm-1 suggests that O-H plane bending motion is coupled strongly with other molecular motions in this range. A distinct absorption band occurring at 2933 cm-1 resulted from symmetric CH2stretching bands of CH2 group.22-24 We found a band at 1712 cm-1 and its ascribe to the carbonyl group of the acetate groups.22,25 A band at 1425 cm-1 is comes from the symmetric bending of CH2 moiety. It is reported that if a vibrtional spectrum contains a band at 1142 cm-1 then it is consider as crystalline and taken as a measure of the degree of crystallinity.25,26 The band at about 1093 cm-1 is assigned to C-O stretching vibration of the ether group.22,25-27All these bands found in the spectra reveals that PVA is present in the PNC film. The band observed at 640 cm-1 is due to Cu-O stretching vibration.27,29,30 This suggests that Cu2O NPs are present in the PNC.20,23 Also we observed that with the increase in Cu2O NPs content in the film, the intensity of band near 1700 cm-1 has drastically decreased. It suggests that PVA polymer is strongly interacting with Cu2O NPs.26
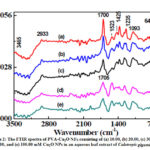 |
Figure 2: The FTIR spectra of PVA-Cu2O NFs consisting of (a) 10.00, (b) 20.00, (c) 30.00, (d) 50.00, and (e) 100.00 |
Microstructural Analysis using SEM image
The morphological data of Cu2O NPs in the polymer nanocomposite films were examined using SEM images. The Fig.3 showed the images for two samples containing: (a) 10 mM and (e) 100 mM Cu2O NPs. From the images we found that the particles were of non-spherical in shape but in the nano range (200-300 nm). The size distribution is non-uniform in nature. From the Fig. 3, we have seen that Cu2O NPs were embedded in PVA polymer matrix. The agglomeration of NPs (see image B) is due to cross-linking between NPs via PVA polymer. So, PVA is not only acts as a capping agent but also a cross-linking agent.
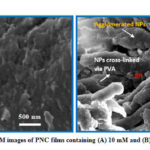 |
Figure 3: SEM images of PNC films containing (A) 10 mM and (B) 100 mM Cu2O |
XRD Pattern Analysis
We studied the diffraction pattern obtained from the X-ray diffractometer to know about the presence of Cu2O NPs in the composites and their crystalline nature. Fig.4 depicts the XRD patterns of the samples consisting of 20 mM Cu2O NPs without and with PVA polymer. Films were used for XRD study. The characteristic diffraction peaks observed at 2θ values of 38.2º, 44.3º, 77.8º are indexed to (111), (200) and (222) planes of Cu2O NPs (Fig. 4) and compared with the single-phase cubic structure (JCPDS file no. 05- 0667). From the XRD study, we confirm the synthesis of Cu2O NPs.20,22,27,28From Fig. 4 it is observed that the highly intense peak corresponds to (111) plane. It reveals that the NPs were mainly oriented in (111) plane. The average particle size (D) of Cu2O NPs has been determined by using the formula, D = 0.89λ/βcosθ. The size of the NPs were lies between 60-70 nm for Cu2O NPs. PVA-Cu2O.PNC film gives a broad peak at 2θ = 200 that corresponds to (101) plane of PVA [26].It reveals that PVA is crystalline in nature in the PNC film. From the XRD pattern of Cu2O NPs without PVA we found that there is no change in the XRD pattern, i.e., the pattern is almost similar to NPs with PVA. This suggests that the crystalline natures of Cu2O NPs are not disturbed by PVA.
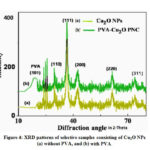 |
Figure 4: XRD patterns of selective samples consisting of Cu2O NPs (a) without PVA, and (b) with PVA. |
Analysis of the antibacterial activity of PVA-Cu2O Nanofluids with Plant Extract
Gram negative bacterial strain was used to study antibacterial effect of prepared samples by Agar disk diffusion method. The gram negative bacteria were Escherichia coli. The agar diffusion antibiotic susceptibility test is used to test the sensitivity of bacteria towards sample. There is no ZOI for negative control (i.e., for plant extract). The ZOI for samples consisting of (a) 10.00, (b) 20.00, (c) 30.00, (d) 50.00, and (e) 100.00 mM Cu2O NPs in an aqueous leaf extract of Calotropisgigantea.L. found to be 12 mm, 13 mm,14 mm, 15 mm and 20 mm, respectively. So, maximum ZOI was found for the sample consisting of 100.00 mM Cu2O NPs against gram-negative bacteria.
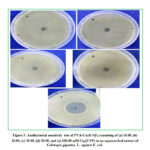 |
Figure 5: Antibacterial sensitivity test of PVA-Cu2O NFs consisting of (a) 10.00, (b) 20.00, (c) 30.00, (d) 50.00, and (e) 100.00 |
Fig. 5 shows the antibacterial sensitivity test of 50.0 mM Cu2O NPs (a) without PVA and (b) with PVA in an aqueous leaf extract of Calotropis gigantea. L. against E. coli. In the absence of PVA, we found ZOI of 20 mm against the bacterium and in the presence of PVA the antibacterial activity of NPs has decreased, i.e., ZOI is only 10 mm. This suggests that encapsulation of Cu2O NPs by PVA reduces the antibacterial activity of NPs towards microbes as they are coated by a polymer layer. In this method, for highly effective samples diameter of ZOI is large while ineffective samples create a very small ZOI. In general, the larger the ZOI, smaller is the minimum inhibitory concentration of sample for that bacteria.
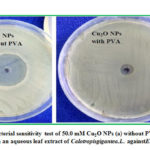 |
Figure 6: Antibacterial sensitivity test of 50.0 mM Cu2O NPs (a) without PVA and (b) with PVA |
Conclusion
We have developed Cu2O NPs using a chemical reduction method. We used an aqueous leaf extract of Calotropis gigantea. L. Shrub as a capping agent and hydrazine as a reducing agent in synthesizing NPs. Then we developed PVA-Cu2O PNCs and NFs of various NP-contents. UV-Vis spectral analysis and XRD analysis confirmed the presence of Cu2O NPs in the PNCs and NFs. The FT-IR analysis confirmed the strong interaction of PVA polymer with Cu2ONPs where as SEM studies reveal that Cu2O NPs were embedded in PVA polymer matrix. The antibacterial activity of the synthesized NFs was evaluated against pathogenic bacteria and it showed effective bactericidal activity. Major achievements made in this work involve the synthesis of Cu2O NPs at room temperature using Calotropis gigantea. L. Shrub as capping agent and hydrazine as reducing agent in an aqueous medium and development of PVA-Cu2O PNCs using Cu2O NPs synthesized at RT.The present work indicates that there is a need of other studies in synthesized PNCs and NFs such as Raman, Rheological study, Antifungal, Catalytic activity and Heat transfer study of PNCs.
Acknowledgement
The authors are very grateful to the authorities of Centurion University of Technology and Management and Silicon Institute of Technology for their whole hearted support to accomplish this research work.
Conflicts of Interest
There are no conflicts of interest to declare.
References
- Koo JH. Polymer nanocomposites. McGraw-Hill Professional Pub.2006.
- Paul DR.; Robeson LM. Polymer nanotechnology: nanocomposites. Polymer. 2008, 49(15),3187-204.
CrossRef - Hussain F.; Hojjati M.; Okamoto M.; Gorga RE. Journal of composite materials. 2006, 40(17), 1511-75.
CrossRef - Aslam M.; Kalyar MA.; Raza ZA.Polymer Engineering & Science. 2018, 58(12), 2119-32.
CrossRef - Moulay S.Polymer- Plastics Technology and Engineering. 2015, 54(12), 1289-319.
CrossRef - Friedrich K, Fakirov S, Zhang Z, editors. Polymer composites: from nano-to macro- scale. Springer Science & Business Media; 2005.
CrossRef - Cao C.; Xiao L. Advanced Materials Research. 2014, 1015, 623-626
CrossRef - Hajipour AR.; Mohammadsaleh F.; Sabzalian MR. Journal of Physics and Chemistry of Solids. 2015, 83, 96-103.
CrossRef - Wang J.; Wang X.; Xu C.; Zhang M.; Shang X. Polymer International. 2011, 60(5), 816-822.
CrossRef - Omer MA.; Bashir EA. Journal of Radiation Research and Applied Sciences. 2018, 11(3), 237-41.
CrossRef - Qian XF.; Yin J.; Yang YF.; Lu QH,; Zhu ZK.; Lu J. Journal of applied polymer science. 2001, 82(11), 2744-2749.
CrossRef - Saini I.; Sharma A.; Dhiman R.; Aggarwal S.; Ram S.; Sharma PK. Journal of Alloys and Compounds. 2017, 714, 172-80.
CrossRef - Krklješ AN.; Marinović-Cincović MT.; Kacarevic-Popovic ZM.; Nedeljković JM. European Polymer Journal. 2007, 43(6), 2171-2176.
CrossRef - Banwell, C. N.; McCash, E. M. Fundamentals of molecular Spectroscopy, Tata McGraw-Hill, 4th NewDelhi.
- Colthup, N. B., Daly, L. H., and Wiberley. S. E. Introduction to infrared and Raman spectroscopy, Academic Press, NewYork. 1975
- Chatterjee S.K. X-ray diffraction: Its theory and applications. PHI Learning Pvt. Ltd.; 2010
- Wells, O. C. Scanning electron microscopy, McGraw Hill, NewYork.
- Balouiri M.; Sadiki M.; Ibnsouda SK. Journal of pharmaceutical analysis. 2016, 6(2), 71-79.
CrossRef - CLSI, Performance Standards for Antimicrobial Disk Susceptibility Tests, Approved Standard, 7th ed., CLSI document M02-A11. Clinical and LaboratoryStandards Institute, 950 West Valley Road, Suite 2500, Wayne, Pennsylvania 19087, USA, 2012.
- Behera M.; Giri G. Materials Science-Poland. 2014, 32(4), 702-8.
CrossRef - Behera M.; Giri G. International Journal of Industrial Chemistry. 2016, 7(2), 157-166.
CrossRef - Maity M.; Pramanik SK.; Pal U.; Banerji B.; Maiti NC.Journal of nanoparticle research. 2014, 16(1), 2179.
CrossRef - Bhaisare ML.; Khan M.S.; Pandey S.; Gedda G.; Wu HF.RSC Advances. 2017,7(38),23607-23614.
CrossRef - Liyanage CS.; De Silva SN.; Fernando CA. International Journal of Nanoelectronics and Materials. 2018, 11, 129-136.
- Shehap AM. J. Solids. 2008, 31(1), 75-91.
CrossRef - Mallakpour S.; Dinari M.; Azadi E. International Journal of Polymer Analysis and Characterization. 2015, 20(1), 82-97.
CrossRef - Li P.; Lv W.; Ai S. Journal of Experimental Nanoscience. 2016, 11(1), 18-27.
CrossRef - Muthuvinothini A.; Stella S. Asian Journal of Chemistry. 2019, 31(1),109-113
CrossRef
Accepted on: 12 Aug 2020


![]()


