Synthesis and Analyzing of Optical, SEM, TEM, Thermal and Fluorescence Studies of Thiourea Cadmium Sulphate Single Crystal
1Department of Physics, Research and Development Center, Bharathiar University Coimbatore, Tamilnadu, India.
2Department of Basic Sciences, Kongu Polytechnic College, Perundurai, Tamilnadu, India.
3Department of Physics, Thiruvalluvar Government Arts College, Rasipuram, Tamilnadu, India.
Corresponding Author E-mail: udaymphil@gmail.com
DOI : http://dx.doi.org/10.13005/ojc/360313
Download this article as:
![]()
Thiourea Cadmium Sulphate crystal is prepared by a slow evaporation technique. The atomic groups appear in TCS crystals are assessed by the mechanism of FTIR spectroscopy. The UV–vis–NIR spectral analysis is utilized to examine the optical presence of absorption and transmission characteristics of the crystal. The TEM and SEM images are inspected and photoluminescence spectral analysis was reported. Finally, the Non Linear Optical (NLO) property of TCS crystal is endorsed by (SHG) evaluation at significant wavelength1064nm.
KEYWORDS:Band Gap; Crystal; SEM; SHG; TEM; TCS
Introduction
The strategy of projecting and evaluating modern materials with relevant physical and chemical properties is the major factor for innovative research and scientists. Interpret the way in which molecules interact with each other across intermolecular forces is imperative for new compounds and materials [1-2]. NLO crystals are employing in the frequency revolutionize of lasers in optical science and technology to outcome laser radiation [3]. The hasty advancement of optical intelligence systems has led to the pursuit for more adequate components for the migration of optical signals. Organ metallic substances have the combined advantages of high optical nonlinearity and chemical resilience of organic substances with the thermal stability and mechanical lustiness of inorganic NLO material [4]. Using water as a solvent, the thiourea single crystal is growing by a slow evaporation technique [5-6]. Non Linear Optical (NLO) crystals are practicing in scientific harmonic generators and parametric oscillators, so they have fascinate much debate and afford immense utilization [7-8]. The electrical characteristics of semiconductors mightily rely up on the optical band gap [9-10]. The rapid expansion in the field of nanotechnology, optoelectronics and Photonics necessitate the quest for advanced and competent Non Linear Optical (NLO) materials that can be utilizing for optical computing, optical communications, electro-optic frequency shifting and optical data depot for flourish technologies in telecommunications [11-13]. We report the surge and characterization of TCS crystal by adopting FTIR, UV–vis–NIR spectroscopic studies, SEM, TEM, TGA/DTA and Fluorescence studies. Finally, the generation of the second harmonic reveals the title compound.
Materials and Methods
Crystal Synthesis
The molecular weights of thiourea and cadmium sulphate are 7.612gms and 20.847gms. The total molecular weight of the material (After the preparation of the sample in 100ml water) is 28.459gms is stirred well using magnetic stirrer up to 2hrs and the solution was poured on Petri dishes after filtering with whatman filter paper at room temperature. The required materials are purchased from NICE and SPECTRUM chemicals in India. .The compound is lay by dissolving the aqueous solution of thiourea and cadmium sulphate at a ratio of 1:1 at room temperature. The qualitative seed is chosen and kept dropping in the super-saturated solution. The mixture is purified by replicated recrystallization before it is used for growth of TCS crystal. Finally in the span of 27 days the required TCS unique crystal has been obtained.
Characterization Techniques
The TCS single crystal is undergone a numerous characterization mechanisms of FTIR spectrum analysis, UV spectral analysis, TEM, SEM, TGA/DTA, Fluorescence and (SHG) assessments..
Results and Discussion
Fourier Transforms Infrared Spectroscopic Studies
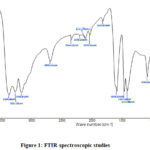 |
Figure 1: FTIR spectroscopic studies |
The FTIR spectrum was estimated in the zone of 400–4000cm−1 using a Perkin-Elmer Spectrophotometer by KBr pellet technique. The FTIR spectrum of TCS single crystal at intervals of the higher energy regions 3369 to 2035cm-1 the NH2 asymmetric stretching mode is identified at peaks 1589cm–1, 2688cm-1 and 3368cm-1. The NH stretching mode is occurred at 3166cm-1. [14-15]. The NH3 stretching mode is located at 2193cm-1. The CN asymmetric stretching mode is identified at 1467cm-1. The C-S asymmetric stretching mode is located at 1414cm-1. The CN symmetric stretching mode is discovered at 1086cm-1[16-17]. The C-S symmetric stretching mode is viewed at 730cm-1. The NCN asymmetric bending mode is monitored at 490cm-1[18].
Optical Studies of TCS Crystal
Optical Absorption Studies of TCS Crystal
The absorption spectrum of TCS specimen is recorded in the wavelength range of 190–1100nm. The UV-vis -NIR regions of the TCS single crystal is detected as transparent. The transparent view facilitates the relevance of thiourea cadmium sulphate crystal in Photonics and optoelectronics. The ultraviolet cut-off wavelength ofTCSappears at 260nm. It is fine recognized that an efficient NLO crystal has an optical transparency lower cut-off wavelength in the intervals of 200nm to 1100nm.
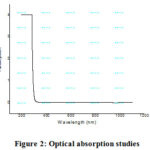 |
Figure 2: Optical absorption studies |
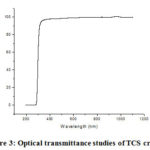 |
Figure 3: Optical transmittance studies of TCS crystal |
The transmission spectrum ofTCS crystal is shown in Figure 2. The TCScrystals are very transparent in the zones of wavelength 260nm [19-20]. The excellent transmittance of the crystal in entire visible light region provides its compatibility for its SHG [21-22]. The UV absorption peak for the grown crystal is identified at 260 nm. The credence of optical absorption coefficient and the photon energy, assist to examine the band structure and the type of progression of electrons [23-25].
TGA & DTA Study of TCS Crystal
The thermal performance of particular TCS crystal is shown in Figure 4. It was examined in the temperature range from 100°C to 700°C using NETZSCH STA 409 C/CD system. Thermal studies are practiced to discern the thermal stability, decomposition, exothermic and endothermic transitions of a solid sample. Thermo gravimetric (TG) and Differential Thermal Analysis (DTA) were carried out by employing the TG/DTA analyzer (Perkin Elmer make). TG/ DTA thermal curves of TCS crystal [26-27] are shown in Figure 4. The first weight loss occurs at 160oC and hence the sample is stable up to this temperature. The primary exothermic peak was observed at 260oC the premier endothermic peak at 280oC is due to the expel of water molecules presence in sample. The endothermic peak at 220oC is due to the decomposition of the crystal sample and there is huge weight destruction is noticed. Further weight Loss in the temperature range 250-500oC is analogous to the liberation of gaseous molecules from the specimen. The total weight failure occurred at 300oC.
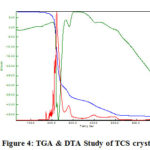 |
Figure 4: TGA & DTA Study of TCS crystal |
SEM Analysis of TCS Crystal
SEM images, Figure 5(a), (b), (c), (d) reported for four distinctive magnifications 778X, 2.25KX, 3.55KX and 3.94KX, affirmed the morphology and size distribution of thiourea cadmium sulphate sample [28]. It is evident that the size and morphology of crystals are disparate. The SEM images show equally evolved grain morphology of compressed microstructure. The detailed exploration of SEM micrograph from a selected region of TCS indicates that these crystals are uneven shaped. The size distribution and size of the particles are not uniform. The grain size varies from 2μm to 20μm. The acquired TCS Crystal is very elegant and accumulation.
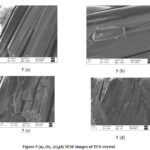 |
Figure 5: (a), (b), (c),(d) SEM images of TCS crystal |
TEM Analysis of TCS Crystal
The TEM images of Figure 6(a), (b), (c) were recorded at 20KV at SAIF, AIIMS-NEW DELHI using TECNAI instrument. The physical and chemical characteristics of nonlinear crystal materials rely on their crystal and surface form. The analytical method of transmission electron microscopy is large scale in the physical, chemical and biological sciences. In the field of cancer research, virology, and material science in addition to pollution, nanotechnology and semiconductor research the TEM plays a vital role , but besides fields like paleontology and palynology.
Image Formation
In order to more easily illustrate, the TEM image is simplified to a single lens microscope [29], where only the Image can be formed by a single lens, while the intermediate and Projection lenses are ignored. The main advantage of TEM is that it can obtain information in real space (Imaging mode) and peer space.
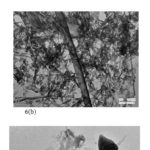 |
Figure 6: (a), (b), (c) TEM images of TCS crystal |
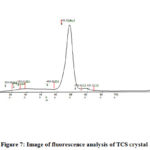 |
Figure 7: Image of fluorescence analysis of TCS crystal |
Fluorescence Studies of TCS Crystal
Figure 7 of the fluorescence analysis of TCS crystal presented a large amount of green photoluminescence at 453.22 nm (4.77ev), the spectrum secreted by the radioactive recombination of photo generated minority carriers is a direct method to approach its band gap energy. Despite, abundant amount of impurities induces a large free carrier density in the bands. The ferment spectrum was measured in the wavelength range of (260-300) nm, the specimen was excited at 453.22nm, and peaks at 452 and 682 are identified in the emission spectrum [30-31].
Second Harmonic Generation (SHG)
The NLO property of grown thiourea cadmium sulphate mono crystal is presented by Kurtz powder technique [32]. SHG is estimated by using an Nd-YAG, 10ns laser with a pulse repetition rate of 10Hz working at 1064nm. The sample was ground into a fine powder and tightly packed in a microcapillary. It was embedded in the path of the laser beam of 9.6-mJ pulse energy achieved by splitting the original laser beam. The output light is diverged by a monochromator, which deportation the second harmonic (green) light at 532nm.
Conclusion
The cadmium sulphate doped thiourea single crystal has been evolved by the slow evaporation mechanism. The existence of each functional group is affirmed by FTIR spectroscopic study. Light absorption review has been shown that the absorption of crystals in the total visible and NIR region is considerably low. The optical transmittance of the crystal establishes the transparency of the crystal achieved. The photoluminescence of the crystal and the morphology of the TCS crystal are presented by TEM &SEM image analysis. Thermal analysis of crystal is noted by TG/DTA. Finally, the SHG for the TCS crystals are good enough for fabrication of nano-materials, optoelectronic, electroscopic and photonic devices.
Acknowledgement
I sincerely thank full to my co-authors for this pioneer research in the field of non linear optics and my sincere thanks to Thiruvalluvar Government of Arts College,salem,Tamilnadu,India for providing lab for the development of my samples.
References
- Sotiles, A.R., Gomez, N.G. & Wypych.F, Journal of Thermal Analysis and calorimetry, 2020,140, 1715-1723,
- Chopra.S, Pandley, Agarwal.R.C, Journal of Physics D, 1980, 13, 1757-1765.
- Sandhyarani, Chenthamarai.S, Indian Journal of Science, 2014, 9 051-057.
- Selva Kumar.S, Rajarajan.K, Ravikumar.M, Vetha potheher.I, Premanand.D, Ambujan.K, Sagayaraj.P, Cryst.Res.Technol, 2006, 41, 766-770.
- Vadivel, Sasikala, Ferdouse, Thehaseen , Anna Lakshmi, Muppudathi , Jeyaperumal, Kalyana Sundar. Material Research Express, 2019, 6, 114-121.
- Dhahir, Tariq, Bakr, Nabeel, Mohammed, Saja.B, Diyala Journal for Pure Science, 2017, 13, 81-94
- Jethva.H.O, Hajiyani.R.R, Material Science Research India, 2012, 9, 165-167.
- Dimitriev.V.G, Gurzadyan.G, NikigosyanD.N, Handbook of Nonlinear opticals, 1999, 64, 414-420
- Sengupta.M.S.K, Indian Journal of Pure and Applied Physics, 1979, 17, 192-198.
- Mell.B.W, Stuke.H, Physica Status Solids B, 1971, 45, 153-162.
- Gunter.P, Bosshard.CH, Sutter.K, Journal of the optical society of America B, 1993, 10, 867-885.
- Kagawa.K Sagawa.M, Kakuta.A, Saji.M, Nakayama.H, Journal of Crystal Growth, 1994, 139,309-318.
- Dou.S.X, Josse.D, Zyss.J, Journal of the Optical Society of America B, 1993, 10, 1708-1715.
- John Xavier.K.V, Spectrochimica Act 60, 2005,709.
- Roshan.A, Cyriac Joseph.S, Materials Letters, 2001, 49, 299-302.
- Porchelvi, R. Rajasekaran, Indian Journal of Science and Technology, 2016, 9, 1-8
- Johanna, Christian Prasanna, Anuradha.A, Madhavan.J, Sagayaraj.P, Asian Journal of Chemistry, 2013,25, 969-971.
- Malliga.P, Senthamilselvi.C, Joseph. A, Academia Journal of Scientific Research, 2017, 5, 224-229.
- Sudhahar.S, Muthulakshmi.V, Muniyasamy.S, Savari Rajeev. A, Krishna.R, Mohan Kumar.R, Journal of Physical Sciences, 2017, 1, 59–69.
- Sajikumar.A.C, Jisha.V.T, International Journal of Physics and Applications, 2016, 8, 45-51.
- Sivasankaran.S, Ilangovan.S, Arivoli.S, International Journal of Innovative Research in Science, Engineering and Technology, 2017, 6, 051-059.
- Durgaa.R, Sundararajanb.R.S, Anand.S, Ramachandrarajab.C, Journal of Computational Methods in Molecular Design, 2016, 6, 39-59.
- Gopinath.S, Palanivel.R, Rajasekaran.R, International Journal of Pure and Applied Sciences and Technology, 2010, 1, 104-113.
- Pricilla Jeyakumari.A, Ramajothi.J, Dhanuskodi.S, Journal of Crystal Growth, 2004, 269, 558–564.
- Manimegalai.M, Annaraj.J, International Journal of Advance Engineering and Research Development, 2018, 5, 1711-1717.
- Gunasekaran.S, Anand.G, Arunbalaji.R, Dhanalakshmi.J, Kumaresan.S, Pramana Journal of Physics, Indian Academy of Sciences, 2010, 75, 683-690.
- Kanagasabapathy.K, Gowri shanmugapriya.G, Vetrivel.S, .Rajasekaran, Indian Journal of Pure and Applied Physics, 2016, 54, 193-198.
- Rajasekar.M, Muthu.K, Adityaprasad.A, Agilandeshwari.R, Meenakshisundaram.S.P, Structural Science Crystal Engineering Materials, 2015, 71, 46-54.
- Dumbrava.A, Badea.C, Prodan.G, Ciupina.V, Chalcogenide Letters, 2010, 7,111 –118.
- Shaikh.R.N, Mohd Anis, Shirsat.M.D, Hussaini.S.S, Materials echnology, 2016, 31, 187-191.
- Maadeswaran.P, Thirumalairajan.S, Chandrasekaran.J, Optoelectronics and Advanced materials – Rapid Communications, 2009, 3, 36 – 39.
- Kurtz.S.K, Perry.T.T, Journal of Applied Physics, 1968, 39, 3798-3813.
Accepted on: 25 May 2020


![]()


