Determination of 2-Amino-3-Hydroxyphenazine (AHP) and 2, 3-Diaminophenazine (Toxicologically Relevant Impurities) by RPHPLC-MS Method in Carbendazim Technical
Jitendra G. Patil1* , Rama S. Lokhande1, Devender T. Seshadri2 and Narendra H. Petha2
1Jaipur National University, Jaipur, Rajasthan-302017, India
2Indofil Industries Limited, Thane, Maharashtra-400607, India
Corresponding Author E-mail: jpatil@indofil.com
DOI : http://dx.doi.org/10.13005/ojc/360327
Article Received on : 19 May 2020
Article Accepted on : 09 Jun 2020
Article Published : 11 Jun 2020
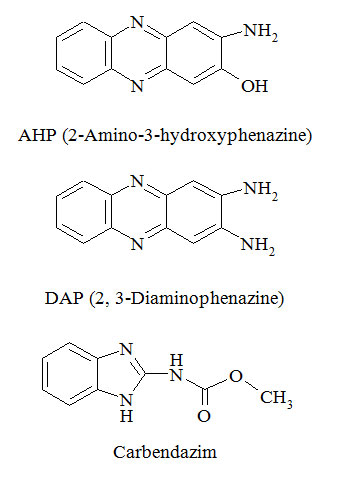
AHP (2-Amino-3-hydroxyphenazine) and DAP (2, 3-Diaminophenazine) are process relevant impurities in Carbendazim Technical (fungicide), but as they are classified as toxic impurities these should be monitored at trace level. As their quantification limit are too low (0.5 mg Kg-1 for AHP and 3.0 mg Kg-1 for DAP), the research work is carried on mass spectrometer (MS) as detector by using HPLC. The chromatographic condition was optimized using gradient elution program on C18 stationary phase in reverse phase HPLC using selective ion monitoring (SIM) mode in MS detector. 2.0 mM aqueous Ammonium acetate and Acetonitrile (organic modifier) were used in mobile phase. The detector response was found linear over the concentration range of 0.0001 to 0.0024 mg L-1 (equivalent to 0.049 mg Kg-1 to 1.184 mg Kg-1) for AHP with coefficient of correlation 0.997 and at a concentration of 0.0001 to 0.0123 mg L-1 (equivalent to 0.051 mg Kg-1 to 6.129 mg Kg-1) for DAP with coefficient of correlation 0.997. The detection limit (LOD) was 0.02 mg Kg-1 for AHP and 0.02 mg Kg-1 for DAP, where as the quantification limit (LOQ) was 0.051 mg Kg-1 for AHP and 0.049 mg Kg-1 for DAP. The % RSD for method precision was 1.92 % and 2.21 % for AHP and DAP, respectively. The accuracy was found to be between 97.32 % - 104.47 % for AHP and 96.57 % - 98.87 % for DAP. This analytical method can be applied for quantification of AHP and DAP in Carbendazim Technical.
KEYWORDS:AHP; DAP; Carbendazim; Method development; Method Validation; 2-Amino-3-Hydroxyphenazine; 2, 3-Diaminophenazine
Download this article as:| Copy the following to cite this article: Patil J. G, Lokhande R. S, Seshadri D. T, Petha N. H. Determination of 2-Amino-3-Hydroxyphenazine (AHP) and 2, 3-Diaminophenazine (Toxicologically Relevant Impurities) by RPHPLC-MS Method in Carbendazim Technical. Orient J Chem 2020;36(3). |
| Copy the following to cite this URL: Patil J. G, Lokhande R. S, Seshadri D. T, Petha N. H. Determination of 2-Amino-3-Hydroxyphenazine (AHP) and 2, 3-Diaminophenazine (Toxicologically Relevant Impurities) by RPHPLC-MS Method in Carbendazim Technical. Orient J Chem 2020;36(3). Available from: https://bit.ly/37iP4po |
Introduction
Carbendazim is broad-spectrum benzimidazole fungicide widely used in agriculture and cultivating home garden. AHP and DAP are process related impurities in Carbendazim technical, which are toxic and carcinogenic in nature. As per FAO the acceptable limit of AHP is 0.5 mg Kg-1 and DAP is 3.0 mg Kg-1 in Carbendazim Technical.1
Available method for determination is by Reverse-Phase liquid chromatography (HPLC) with fluorescence detector.2 HPLC methods with UV detector are also available but for analysis of these low level impurities required higher concentration of sample, it may over load column and small interference in baseline gives significant effect on analysis.3-6
Hence, AHP (2-Amino-3-hydroxyphenazine) and DAP (2, 3-Diaminophenazine) formed in Carbendazim (Fungicide) technical was analysed by advanced chromatographic techniques like High performance liquid chromatography coupled with mass spectrometry (HPLC-MS). The method was developed and validated in accordance with SANCO guidelines and CIPAC.7-8
Materials and Methods
Materials
Analytical standard of known purity of DAP (2, 3-Diaminophenazine) was ordered from Sigma Aldrich. AHP (2-Amino-3-hydroxyphenazine) and Carbendazim technical were taken from Indofil Industries Limited. Mobile phase was prepared with MS grade solvents and samples were prepared with HPLC grade solvents.
Experimental Design and Method
Chromatographic Conditions
The analysis was performed and optimized using Phenomenex C18 as stationary phase, (5 µm x 4.6 mm × 250 mm) column. The optimized mobile phase is Acetonitrile (solvent A) and 2.0 mM Ammonium acetate in water (solvent B) using gradient program. Optimized analytical method conditions were mentioned as fallows;
|
Instrument |
: |
a) Waters e2695 separation module with e2998 PDA detector |
||||||||||||||||||||||||||
|
b) Quattromicro Triple Quad (LC-MS/MS) |
||||||||||||||||||||||||||||
|
Column |
: |
Phenomenex C18, 5 µm x 4.6 mm × 250 mm |
||||||||||||||||||||||||||
|
Mobile Phase |
: |
Solvent A :- Acetonitrile |
||||||||||||||||||||||||||
|
Solvent B :- 2.0 mM Ammonium acetate |
||||||||||||||||||||||||||||
|
Program |
: |
Gradient |
||||||||||||||||||||||||||
|
||||||||||||||||||||||||||||
|
Flow rate (mL minute-1) |
: |
1.0 |
||||||||||||||||||||||||||
|
Column Oven Temperature (° C) |
: |
30 |
||||||||||||||||||||||||||
|
Injection Volume (µL) |
: |
20 |
||||||||||||||||||||||||||
|
Total Run Time (minutes) |
: |
35 |
||||||||||||||||||||||||||
LC-MS Parameters
|
Ionization Mode |
: |
ESI +ve mode |
|
Capillary Voltage (kV) |
: |
3.0 |
|
Cone Voltage (V) |
: |
30 |
|
Extractor (V) |
: |
3.0 |
|
RF Lens |
: |
0.0 |
|
Source Temperature (°C) |
: |
120 |
|
Desolvation Temperature( °C) |
: |
400 |
|
Desolvation Gas Flow(L/hr) |
: |
1150 |
|
Cone Gas Flow (L/hr) |
: |
50 |
Mobile Phase Preparation
Solvent A
Acetonitrile (HPLC grade) sonicated to degas it for 15.0 minutes.
Solvent B
Dissolved and diluted 77.0 mg of Ammonium acetate in 1000 mL of HPLC water and degas it for 15.0 minutes.
Diluent
Mixture of solvent A and solvent B in 70: 30 (% v/v) proportions was used as diluent.
Preparation of Standard and Sample
Standard Preparation
AHP Standard preparation
Weighed and transferred 20.0 mg of AHP standard into a volumetric flask of 100 mL capacity, added 0.5 mL formic acid and 20 mL of diluent into it. Sonicated to dissolve and diluted to the volume with diluent.
Pipetted 0.1 mL from above into volumetric flask of 100 mL capacity and diluted to the volume with diluent (0.2 mg L-1) (Stock-A).
DAP Standard preparation
Weighed and transferred 20.0 mg of DAP standard into volumetric flask of 100 mL capacity, added 0.5 mL formic acid and 20 mL of diluent into it. Sonicated to dissolve and diluted to the volume with diluent.
Pipetted 0.5 mL from above into volumetric flask of 100 mL capacity and diluted to the volume with diluent (1.0 mg L-1) (Stock-B).
AHP and DAP Standard Mixture
Pipetted 0.6 mL of the stock-A and stock-B into a volumetric flask of 100 mL capacity and diluted to the volume with diluent (0.0012 mg L-1 of AHP and 0.006 mg L-1 of DAP).
Sample Preparation
Weighed and transferred 200.0 mg of Carbendazim technical into a volumetric flask of 100 mL capacity, added 0.5 mL formic acid and 20 mL of diluent, content was sonicated to dissolve and diluted to the volume with diluent (2000.0 mg/L).
Formula
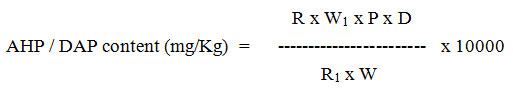
Where,
W1 = Weight of standard AHP / DAP in mg for standard solution preparation.
W = Weight of sample taken in mg for the test solution preparation.
R1 = Mean Peak Area of AHP / DAP in standard Chromatogram
R = Mean Peak Area of AHP / DAP in sample chromatogram
P = Percent purity of AHP / DAP standard
D = Dilution factor. (For AHP = 0.000006, for DAP = 0.00003)
Results and Discussion
The chemical structures of AHP (molecular weight 211) and DAP (molecular weight 210) are presented. The molecular weights of both compounds were confirmed by the presence of 212 (m+1) for AHP and 211 (m+1) for DAP in the positive-ion mode mass spectra (refer figure 01).
These masses were used for analysis in selective ion monitoring (SIM) mode experiment and analyte quantification, using MS as detector.
HPLC Separation
As there is no much structural difference between AHP and DAP, hence the HPLC conditions were optimized to achieve better resolution as mentioned above for chromatographic separation.
Method Validation
Specificity/Selectivity
Method Specificity is a criteria to measure the analyte response and any interference from diluents and any other analytes. Figures 02 to 06 shows that there was no interfering peak from the blank at the retention times of AHP (11.91 minutes) and DAP (12.76 minutes) standard and vice versa. Therefore, it can be concluded that the method is specific due to non-interference at the retention time of analyte from blank chromatograms.
Hence the described method is specific for the identification and quantification of AHP and DAP in Carbendazim Technical.
Selectivity is the ability of the method to measure several different analytes in presence of each other in sample. As the analysis was done in selective ion mode in MS for the masses 212 (m+1) for AHP and 211 (m+1) for DAP in ESI +ve mode selectively.
Acceptance Criteria
No interference at the retention times of AHP and DAP from each other and as well from blank and sample.
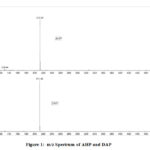 |
Figure 1: m/z Spectrum of AHP and DAP |
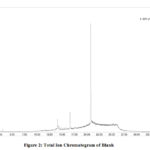 |
Figure 2: Total Ion Chromatogram of Blank |
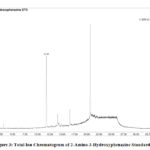 |
Figure 3: Total Ion Chromatogram of 2-Amino-3-Hydroxyphenazine Standard |
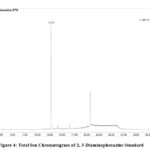 |
Figure 4: Total Ion Chromatogram of 2, 3-Diaminophenazine Standard |
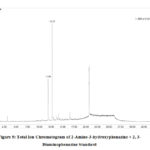 |
Figure 5: Total Ion Chromatogram of 2-Amino-3-hydroxyphenazine Click here to View Figure |
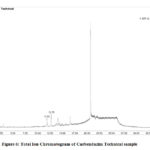 |
Figure 6: Total Ion Chromatogram of Carbendazim Technical sample Click here to View Figure |
Linearity
The linearity of a method was obtained by the linear detector response which was directly corresponding to the concentration of the solute within a given range. The detector response was determined by analyzing standard solutions at eight different levels of concentration, ranging from 0.0001 mg L-1 to 0.0024 mg L-1(equivalent to 0.049 mg Kg-1 to 1.184 mg Kg-1 at analysed sample concentration) for AHP and 0.0001 mg L-1 to 0.0123 mg L-1 (equivalent to 0.051 mg Kg-1 to 6.129 mg Kg-1 at analysed sample concentration) for DAP. The response was found to be linear for the specified concentrations of the standard. The correlation coefficient was 0.997 for AHP and 0.997 for DAP. The linearity curves are presented in figure 07 and 08.
Acceptance criteria
Correlation coefficient (r2) > 0.99
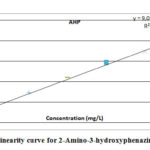 |
Figure 7: Linearity curve for 2-Amino-3-hydroxyphenazine standard |
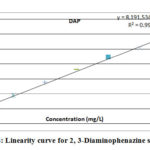 |
Figure 8: Linearity curve for 2, 3-Diaminophenazine standard |
Detection Limit (LOD) and Quantification Limit (LOQ)
The detection limit (Signal-to-noise ratio of > 3:1) and quantification limit (Signal-to-noise ratio of > 10:1) were found to be 0.00004 mg L–1 (equivalent to 0.020 mg Kg–1 at analysed sample concentration) and 0.00010 mg mL–1 (equivalent to 0.051 mg Kg–1 at analyzed sample concentration), respectively for AHP and 0.00004 mg L–1 (equivalent to 0.019 mg Kg–1 at analysed sample concentration) and 0.00010 mg mL–1 (equivalent to 0.049 mg Kg–1 at analyzed sample concentration), respectively for DAP (refer table 01).
Acceptance Criteria
S/N ratio should be > 3.0
S/N ratio should be > 10.0
Table 1: Detection Limit and Quantification Limit
|
Component Name |
Detection Limit |
S/N Ratio |
Quantification Limit |
S/N Ratio |
||
|
mg mL-1 |
mg Kg-1 |
mg mL-1 |
Mg Kg-1 |
|||
|
AHP |
0.00004 |
0.020 |
4.63 |
0.00010 |
0.051 |
11.57 |
|
DAP |
0.00004 |
0.019 |
4.04 |
0.00010 |
0.049 |
10.23 |
Precision
Precision (Repeatability) of analytical method was determined by analyzing seven sample solutions for AHP and DAP content by injecting each solution in duplicate. The percentage relative standard deviation (% RSD) was 1.92 % and 2.21 % for AHP and DAP content in Carbendazim technical respectively. This shows that the method is precise for determining AHP and DAP content in Carbendazim technical.
Acceptance Criteria
% RSD of AHP and DAP content should not be more than 15.94 and 15.49, calculated from the Horwitz equation.
Accuracy
Accuracy of the method measures the results in terms of recovery of standard added against the theoretical value. In this experiment known quantity of standard was added to calculate the percentage recovery by standard addition technique at three different concentration levels; LOQ level, 100 % and 150 % of the limit level concentration to the sample. The samples were prepared as per the described procedure. The percentage recoveries of AHP and DAP at each level were determined and the mean of percentage recoveries for AHP and DAP were calculated. The mean percentage recovery results was found in the range of 97.32 % to 104.47 % for AHP and 96.57 % to 98.87 % for DAP. Recovery experimental data shows that results obtained are within the acceptance criteria, hence the method is accurate for the quantification of AHP and DAP in Cabendazim.
Acceptance Criteria
Percentage recovery should be in the range of 75 % to 125 %.
Sample Results
Three commercial batches of Carbendazim technical were analysed for AHP and DAP content by using above procedure. The analysis was done in triplicate and results are shown in table-02., The results shows that AHP and DAP found in Carbendazim technical sample was less than 0.5 mg Kg-1 and less than 3.0 mg Kg-1 below the acceptance limit stated by FAO.
Table 2: AHP (2-Amino-3-hydroxyphenazine) and DAP (2, 3-Diaminophenazine) content in Carbendazim technical
|
Batch No. |
AHP (mg Kg-1) |
DAP (mg Kg-1) |
Mean AHP (mg Kg-1) |
Mean DAP (mg Kg-1) |
|
1 |
0.056 |
0.053 |
0.06 |
0.05 |
|
0.054 |
0.051 |
|||
|
0.062 |
0.053 |
|||
|
2 |
0.065 |
0.070 |
0.07 |
0.07 |
|
0.068 |
0.067 |
|||
|
0.066 |
0.068 |
|||
|
3 |
0.042 |
Not detected |
0.04 |
Not detected* |
|
0.039 |
Not detected |
|||
|
0.040 |
Not detected |
(*Detection limit for DAP is 0.019 mg Kg-1)
Conclusions
From the results of method validation experiment it can be concluded that this method is appropriate for the detection and quantification of AHP and DAP, which are toxicologically relevant impurities in Carbendazim technical. The quantification limit (LOQ) is well below the acceptable limit (for AHP 0.5 mg Kg-1 and for DAP 3.0 mg Kg-1), a simple method using Reverse-Phase liquid chromatography (HPLC) with mass detector was successfully developed and validated for the determination of AHP and DAP as potential relevant impurities in Carbendazim technical.
Acknowledgement
We would like to thank, Dr. A.G. Pawar, Ex. Exec. Vice President R&D and Dr. S. K. Singh, Vice President R&D of Indofil Industries Limited, Thane, India for providing samples and necessary research facility to carry out this work.
Conflicts of Interest
There are no conflicts of interest to declare.
References
- Food and Agriculture Organization of the United Nations Rome, 1988 (FAO) Specification for plant protection products carbendazim (AGP: CP/220). Available online: http://www.fao.org/fileadmin/templates/agphome/documents/Pests_Pesticides/Specs/CBZ2.pdf
- I. du Pont de Nemours and Company DuPont Agricultural Products. Determination of Phenazines (DAP and AHP), Reversed-Phase Liquid Chromatography (RPLC) with Fluorescence Detection, Method No. E9650.220.01.BE, First Revision: January 30, 1995, page 1 to 17. Available online: http://www.fao.org/fileadmin/templates/agphome/documents/Pests_Pesticides/Specs/Method.pdf
- Xing, Jun; Yang, Wen-han; Ma, Ya-guang; Li, Xiu-jie; Yu, Liang. Agrochemicals. 2014,53(10), 732-735. Available at http://www.oriprobe.com/journals/ny/2014_10.html
- Cao, L. Y., Chen, G. X., Feng, J. Y., & Mo, W. M. Journal of Instrumental Analysis.2008, 27(4), 412-414. Available at http://en.cnki.com.cn/Article_en/CJFDTotal-TEST200804016.htm
- Lopez, P. J., Pujol, M., & Andreu, G. Analytical letters. 1998, 31(8), 1351-1356. DOI: 10.1080/00032719808002871.
- Koppen, B. Journal of Chromatography A. 1992, 623(1), 168-173. DOI: 10.1016/0021-9673(92)85313-I.
- EUROPEAN COMMISSION Directorate General Health and Consumer Protection, Guidance for generating and reporting methods of analysis of technical Material and Preparations, SANCO/3030/99 rev.5 22/03/2019. Available online: https://ec.europa.eu/food/sites/food/files/plant/docs/pesticides_ppp_app-proc_guide_phys-chem-ana_3030.pdf
- CIPAC Guideline for analytical methods for the determination of relevant impurities referred to in FAO and/or WHO specifications for pesticide technical grade active ingredients and formulations, CIPAC rev.7, June 2009. Available online: https://www.cipac.org/images/pdf/CIPAC_Guideline%20Relevant%20impurities_June%202009.pdf

This work is licensed under a Creative Commons Attribution 4.0 International License.
About The Author
![]()
A New Edition of Web of Science
Journal Impact Factor
2022: 0.5
Five Year: 0.8
Journal is Indexed in

Cabells Whitelist
![]()


