Comparison of Different Organic Solvents on Antioxidant Activity of Astaxanthin Extracted from Hematococcus Pluvialis USING Colorimetric and Non-Colorimetric Methods
Bayan Yousef AL-Tarifi1, Azizah Mahmood1, Suvik Assaw2,3 and Hassan I. Sheikh1*
1Faculty of Fisheries and Food Science, Universiti Malaysia Terengganu, 21030 Kuala Nerus, Terengganu. Malaysia.
2Faculty of Science and Marine Environment, Universiti Malaysia Terengganu, 21030 Kuala Nerus, Terengganu. Malaysia.
3Biomedicine Science Program, School of Health Sciences, Universiti Sains Malaysia, 16150 Kota Bharu, Kelantan. Malaysia.
Corresponding Author E-mail: Sheikh@umt.edu.my
DOI : http://dx.doi.org/10.13005/ojc/360316
Download this article as:
![]()
Astaxanthin is a polar compound with a strong color which might contribute to its reported antioxidant activity as most antioxidant tests are colorimetric assays. The aim of the study was to compare the antioxidant activity of astaxanthin extracted from Haematococcus pluvialis using colorimetric and non-colorimetric methods. The astaxanthin extract was dissolved in solvents with different polarities (40% acetone, dimethyl sulfoxide or methanol). Antioxidant potential was assayed using 2,2-diphenyl-1-picrylhydrazyl (DPPH), ferric reducing antioxidant power (FRAP) and hydroxyl radical scavenging activity (HRSA). Results showed that dimethyl sulfoxide (DMSO) sample had the highest antioxidant activity in DPPH (IC70 = 12.9 mg/ml) and FRAP (389.4± 0.05 µM TE/g) assays. DMSO was significantly lower than 40% acetone (p<0.05) in Hydroxyl radical scavenging activity (HRSA) assay. DMSO showed highest astaxanthin recovery in high performance liquid chromatography analysis (HPLC). Colorimetric DPPH and FRAP assays gave significantly different results compared to non-colorimetric HRSA assay. This difference could be due to the solubility of astaxanthin and not due to its color.
KEYWORDS:Antioxidant; Astaxanthin; DPPH; FRAP; HRSA
Introduction
Astaxanthin (3,3′-dihydroxy-β,β-carotene-4,4′-dione) is one of the best exogenous antioxidant agents. Astaxanthin was also found to be 800 times better than coenzyme Q10, 75 times better than alpha-lipoic acid, 550 times better than catechins (from green tea) and about 6000 times greater than Vitamin C.1 Astaxanthin was also reported that has a singlet oxygen quenching activity over 500 times better than alpha-tocopherol2 and 40 times more potent than that of β-carotene on singlet oxygen quenching.3 These results seem to be extreme and it can be argued that the strong color of astaxanthin affected these test which are mostly colorimetric.
Antioxidant assays vary in terms of the antioxidant type (enzymatic or non-enzymatic), solvent characterization (organic and non-organic), type of reagent (radical or non-radical) and mechanism of reaction.4 However, in vitro antioxidant activity is mainly classified into colorimetric methods and non-colorimetric methods. The most common and simple colorimetric methods are 2,2-diphenyl-1-picrylhydrazyl (DPPH) and ferric reducing antioxidant power (FRAP), while hydroxyl radical scavenging assay (HRSA) is a non-colorimetric methods.5
The DPPH is often used due to its time effectiveness, simplicity and low cost.6,7 Other researcher8 suggested that colorimetric method such as DPPH are not appropriate for colored compound. Few studies9,10 on the antioxidant activity of colored compounds such as anthocyanin reported that the activity could also be underestimated. In term of mechanism DPPH and FRAP are both colorimetric assays based on electron transfer (ET).11 However, DPPH is based on the scavenging of an organic radical (DPPH radical), while the reaction in FRAP assay involves reduction of Fe3+ to Fe2+.12 HRSA is a non-colorimetric assay based on the ability of the sample to donate hydrogen rather than electron transfer ability utilized in DPPH and FRAP assays.13 HRSA might be better tool to evaluate colored compounds, however, its reaction is highly influenced by the polarity of the solvent used to dissolve the compound of interest.14
Hence, this study aimed at comparing antioxidant activity of astaxanthin dissolved in different organic solvents with varying polarity and assessed using colorimetric and non-colorimetric antioxidant assays.
Materials and Methods
Materials
The powder sample of astaxanthin extracted from Hemattococcus Pluvialis was purchased from BGG company in china (AstaZine®; SDHP-05). Astaxanthin was purchased, extracted by spray-dried Hematococcus Pluvialis powder 5%, store below 8°C. The sample was transport and storage at ambient temperature up to 14 days with minimal exposure to light, heat and air. Astaxanthin powder kept in foil bag by using active packaging (oxygen scavenger). The container was flushed with an inert gas (nitrogen gas) when sealing. AstaZine’s carotenoid faction is 97% Pure Astaxanthin 3% supporting carotenoids. Astaxanthin standard was purchased from Sigma aldrich (Malaysia) of ≥97% purity. Analytical grade solvents chloroform, methanol, dichloromethane and acetonitrile were used to dissolve astaxanthin and high-performance liquid chromatography (HPLC) grade were used for HPLC analysis. All solvents were purchased from Fisher Scientific Co. (Fisher Scientific™ UK).
Antioxidant Activity
2,2-DIPHNEYIL-1-Picrylhydrazyl (DPPH) Radical Scavenging Activity
The antioxidant activity of astaxanthin powder was determined by using 2,2-diphenyl-1-picrylhydrazyl free radical scavenging (DPPH) assay15,16. A fresh solution of 0.0024 g/100 ml 2,2-diphenyl-1-picrylhydrazyl solution in methanol was prepared for serial dilution and kept in dark at ambient temperature.
A stock solution of 1 mg/ml was prepared for each solvent and serial dilution was carried out to prepare samples ranging from a concentration of 0.0156 mg/ml to 1 mg/ml. Then, 100µl of samples were mixed with 3.9 ml of DPPH solution to reach final volume 4.0 ml. The mixture was then incubated at room temperature for 30 min and the absorbance was taken at 517 nm using UV-spectrophotometer. The DPPH solution without sample was used as positive control while a solution of absolute methanol was used as blank in this test. Percent scavenging of the DPPH free radical was measured using the following equation:
Percentage of DPPH radical scavenging (%) = [(Ab – As) / Ab] *100
Ab = Absorbance of blank
As = Absorbance of sample solution
GraphPad Prism 5.0 was used to calculate IC50 and IC70 which represented the concentration of the sample that can scavenge 50% and 70% of DPPH radicals, respectively.
Ferric Reducing Antioxidant Power (FRAP) Method
The assay was done according to a previous study17 with slight modifications. The stock solutions included 300 mM acetate buffer prepared by dissolving 3.1 g C2H3NaO2.3H2O and 16 mL C2H4O2 in 1 L distilled water and pH was adjusted to 3.6 and the buffer was stored at 4 °C. Then, 10 mM 2,4,6-tripyridyl-s-triazine (TPTZ) prepared freshly by dissolving 0.031 g of TPTZ powder in 40 mM HCl in water bath at 50 °C. Ferric III chloride solution (20 mM FeCl3.6H2O) was prepared freshly by dissolving 0.054 g of ferric III chloride powder in 10 ml distilled water. The FRAP solution was prepared by mixing 25 mL acetate buffer, 2.5 mL of TPTZ solution and 2.5 mL ferric III chloride solution and then warmed to 37 °C. The samples (0.15 mL) were mixed with 2850 μL of the FRAP solution and incubated for 30min in dark condition at room temperature. Absorbance of the ferrous tripyridyltriazine complex was measured using UV-Visible spectrometer at 593 nm. Standard curve was prepared ranging from 25 and 800 μM Trolox and was linear. The results were expressed as micomolar Trolox equivilant (μMTE) per gram of dry mass.
Hydroxyl (OH) Radical Scavenging Activity (HRSA)
The scavenging activity of the samples on the hydroxyl radical (OH•) measured according to a previous study18 with slight modification. Phosphate buffer saline (PBS, 0.01 M, pH 7.4) was prepared by dissolving 0.24 g monopotassium phosphate, 1.44 g disodium dihydrogen phosphate, 7.9 g sodium chloride and 0.2 g potassium chloride in 1 L of distilled water. Phenanthroline (0.75 M) prepared by dissolving 1.48 g of 1,10-phenanthroline monohydrate in 10ml of ethanol. Ferrous sulphate (0.75 mM) was prepared by dissolving 0.2085 g FeSO4·7H2O in 1 L of distilled water. The assay was carried out by mixting 2 ml phenanthroline solution, 4 ml phosphate buffer, 2 ml ferrous sulphate and 2 ml sample solution and shaken. Then 2 ml 0.01% H2O2 (w/v) was added to the mixture and incubated at 37 °C for 1 h. The absorbance of the resulting solutions were measured at 536 nm. The blank used was mixture of 2 ml phenanthroline solution, 4 ml phosphate buffer, 2 ml ferrous sulphate and 4 ml distilled water. The scavenging activity on hydroxyl radicals was calculated using the following formula:
Hydroxyl radical scavenging activity (%) = [(Ab – As) / Ab] *100.
Ab = Absorbance of blank
As = Absorbance of sample solution
Estimation of Astaxanthin Recovery Using High-Performance Liquid Chromatography (HPLC)
Astaxanthin Extracts’ Preparation
Astaxanthin was diluted in three organic solvents with varying polarities, namely, 40% acetone, dimethyl sulfoxide and methanol. Ten milligrams of astaxanthin powder was diluted in 20 ml of the selected solvents, then all three samples were centrifuged at 5000 rpm for 10 min at 4°C. All the steps were carried out in dim light and the samples were stored in a chiller at 4°C in an un-oxygenated dark condition until use.
Preparation of Calibration Standards
The samples were subjected to high-performance liquid chromatography analysis according to previously described method.19 Stock solutions of astaxanthin were prepared by dissolving 1mg of sample powder in one mL chloroform (HPLC grade). Serial dilutions were prepared by diluting the stock solution with methanol yielding final concentrations 1,10,15,20,30 ppm. All steps carried out in dim light.
HPLC Analysis
High performance liquid chromatography was performed using astaxanthin C18 reversed-phase column (260×4.6 mm, Hypersil GOLD). The mobile phase was a mixure of water:Methanol:Dichloromethane: Acetonitrile (4.5:28:22:45.5 v/v) which was filtered through Nylon membrane filters 47 mm membrane. The injection volume was 10 µl eluted at a flow rate of 1 ml/min and detection was carried out at 476 nm. All samples were prepared in triplicates.
Isocratic elution was carried out at a flow rate of 1.0 mL/min at room temperature. Chromatograms were recorded at 476 nm and the spectral and data were processed using Gold System (lab solution software).20
Statistical Analysis
The experimental data were carried out in triplicates and were recorded as mean ± standard deviation. Data were analyzed using SPSS Statistics 20.0 and the significance level was defined as p<0.05 or lower.
Results
2,2-Diphneyil-1-Picrylhydrazyl (DPPH) Radical Scavenging Activity
Astaxanthin inhibition potential determined by 2,2-diphenyl-1-picrylhydrazyl radical scavenging assay (Table 1). The DPPH scavenging activity of astaxanthin dissolved in different solvents was evaluated and compared with quercetin as a control compound (Fig 1). Univariate analysis of variance from general linear models of SPSS v20 was used to compare the three extracts and seven concentrations. The univariate model was significant for sample (F=123.846, p<0.001) and concentration (F=1211.780, p<0.001). The interaction between sample and concentration was also significant (F=37.932, p<0.001). Tukey post hoc analysis showed that DMSO was significantly higher (p<0.001) that other solvents. DMSO was also significantly higher than qurcetine (p<0.05). 40% acetone showed the least inhibition among all samples tested (p<0.001). In terms of concentration, post hoc analysis using done using bonferroni correction due to high number of comparisons. The analysis showed that inhibition potential dropped slightly from 1 mg to 0.25 mg (p>0.05), while at 0.0625 mg and below inhibition dropped significantly (p<0.001). Pearson correlation analysis also showed that concentration and inhibition were strongly (p<0.001) with a 0.855 correlation coefficient (r). The DPPH results can be summarized as DMSO ˃ quercetin ˃ methanol ˃ 40% Acetone.
Table 1: Astaxanthin inhibition potential determined by 2,2-diphenyl-1-picrylhydrazyl radical scavenging assay
|
Type of sample |
Sample concentration mg/ml |
||||||
|
0.0156 |
0.0313 |
0.0625 |
0.125 |
0.25 |
0.5 |
1 |
|
|
ASTA with 40% acetone |
63 ±0.01 |
65 ±0.01 |
80 ±0.01 |
84 ±0.01 |
85 ±0.01 |
86 ±0.01 |
88 ±0.00 |
|
ASTA with dimethyl sulfoxide |
71 ±0.01 |
79 ±0.01 |
84 ±0.00 |
86 ±0.00 |
87 ±0.00 |
87 ±0.00 |
88 ±0.00 |
|
ASTA with methanol |
65 ±0.02 |
66 ±0.02 |
77 ±0.01 |
87 ±0.01 |
87 ±0.01 |
88 ±0.01 |
89 ±0.01 |
|
Quercetin |
65 ±0.01 |
78 ±0.00 |
83 ±0.00 |
86 ±0.00 |
88 ±0.00 |
88 ±0.00 |
89 ±0.00 |
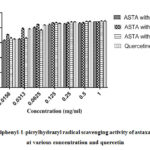 |
Figure 1: 2,2-diphenyl-1-picrylhydrazyl radical scavenging activity |
IC50 and IC70 of 2,2-Diphenyl-1-Picrylhydrazyl (DPPH) Radical Scavenging Activity
The IC50 and IC70 were calculated to determine the concentration of each sample is required to inhibit 50% and 70% of DPPH radical, respectively. The lower values indicated higher antioxidant activity of samples. The values of IC70 showed that quercetin exhibited slight higher antioxidant activity than DMSO sample, followed by methanol, while 40% acetone showed the lowest activity (Table 2). While in IC50 values quercetin was much higher that astaxanthin samples.
Table 2: C70 and IC70 value of 2, 2-diphenyl-1-picrylhydrazyl radical scavenging activity
|
Sample |
IC70 (mg/ml) |
IC50 (ppm) |
|
ASTA with 40% acetone |
39.8 |
5.99 |
|
ASTA with dimethyl sulfoxide |
12.9 |
4.76 |
|
ASTA with methanol |
28.9 |
5.15 |
|
Quercetin |
12.6 |
1.04 |
Ferric Reducing Antioxidant Power (FRAP) Method
The trolox standard curve showed high precision with r² = 0.9926 (figure 2).
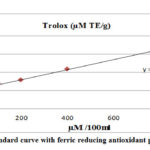 |
Figure 2: Trolox standard curve with ferric reducing antioxidant power assayed value. |
The highest ferric reducing antioxidant capacity observed in DMSO was significantly higher than other solvents (p<0.05), while 40% acetone and methanol samples were not significantly different (p>0.05) (Table 3).
Table 3: Ferric reducing antioxidant power assay for astaxanthin diluted by various solvents
|
Sample |
Ferric reducing antioxidant power (µM TE/g D.W) |
|
ASTA with 40% acetone |
243.9 ± 0.03a |
|
ASTA with dimethyl sulfoxide |
389.4 ± 0.05b |
|
ASTA with methanol |
219.3 ± 0.02a |
All values are calculated as means ± SD of three replicates. Different letters (a-c) indicates significant difference (p<0.05)
Hydroxyl (OH) Radical Scavenging Activity (HRSA)
The scavenging effects of astaxanthin dissolved in 40% acetone was significantly higher that other solvents (p<0.05), while DMSO was insignificantly higher than methanol (p>0.05) (Table 4).
Table 4: Hydroxyl scavenging activity of astaxanthin in various solvents.
|
Sample |
Hydroxyl radical scavenging activity (%) |
|
ASTA with 40%acetone |
38.0 ± 0.02a |
|
ASTA with dimethyl sulfoxide |
22.2 ± 0.02b |
|
ASTA with methanol |
16.0 ± 0.00b |
All values are calculated as means ± SD of three replicates. Different letters (a-c) indicates significant difference (p<0.05)
High-Performance Liquid Chromatography
The results showed that the elution mixture of Water: Methanol: Dichloromethane: Acetonitrile (4.5: 28: 22: 45.5 v/v) gave the complete separation of astaxanthin after 4 min. Calibration curve was prepared using commercial astaxanthin standard (r² = 0.9993) as shown in figures 3, while figure 2 shows the chromatograms of the three samples tested in this study. All samples gave similar retention time of 3.69 ±0.04. The recovery of astaxanthin varied between different solvents. The highest recovery was obtained in DMSO at 3.48 ppm followed by methanol and 40% acetone at 3.37 and 0.74 ppm, respectively (Table 5).
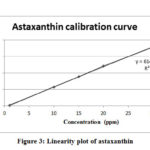 |
Figure 3: Linearity plot of astaxanthin |
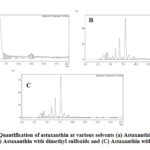 |
Figure 4: Quantification of astaxanthin at various solvents |
Table 5: Yield and precision of astaxanthin recovery in selected solvents
|
Astaxanthin Sample |
Retention time (min) |
Peak |
Concentration (ppm) |
|
40% acetone |
3.74 |
1697 |
0.74 |
|
Dimethyl sulfoxide |
3.68 |
170300 |
3.48 |
|
Methanol |
3.66 |
163640 |
3.37 |
|
Accuracy (mean ±SD) |
96.38±9.1301 |
|
|
|
Slope |
61419 |
|
|
|
C.V |
0.0947 |
|
|
|
RSD |
9.4733 |
|
|
|
LOD |
2.0186 |
|
|
Discussion
Previous studies have raised concerns that antioxidant activity of colored compounds might be wrongly estimated.9,10 This lead to some scientists suggesting that non-colorimetric method should be used for colored compounds8 and these concerns were validated by recent studies. For instance, astaxanthin’s free radical scavenging was previously reported to be 65 times greater than Vitamin C21, however, a recent study22 reported that EC50 of astaxanthin and Vitamin C in DPPH assay were 17.5±3.6 and 19.7±0.2 (µg/mL). These variations in astaxanthin’s reported activity might be due to nature of the assays and solvents used.
In this study, there was a significant difference between using colorimetric and non-colorimetric assays in analyzing antioxidant activity of colored compounds such as astaxanthin. DMSO showed significantly higher antioxidant activity than methanol in all tests, however compared to 40% acetone, the results varied. These variation were also observed in a previous study where antioxidant activity of vitamin C was higher than astaxanthin in FRAP and DPPH assays, however, in HRSA assay vitamin C was approximately 12 times lower than astaxanthin.23 This was regarded to stability and solubility of astaxanthin being affected by the solvents used.
In terms of DPPH, inhibition of all samples ranged from 88 to 89% at the maximum concentration tested (1 mg/ml). A previous study24 reported that astaxanthin extracted using a combination of methanol, 40% acetone and high Pressure (200 megapascal) showed 89.90% DPPH inhibition activity, however, concentration tested was not mentioned. Previous studies on IC50 of quercetin in DPPH assay varied from 0.55 ppm25 to 2.99 ppm.26 IC50 of the quercetin was 1.04 ppm, which was within the expected range. IC50 of astaxanthin samples were 4.76, 5.15 and 5.99 for DMSO, methanol and 40% acetone, respectively. These results were significantly lower that the Quercetin, but higher than a previous study23 where 50% DPPH scavenging activity was achieved using 20 ppm of astaxanthin, however, the astaxanthin sample used contained 2% sunflower oil which might have affected their results.
IC70 was also investigated in the study to apply a more stringent comparison parameter as suggest by a recent study.27 IC70 analysis showed that DMSO sample and the quercetin had similar activity, however, in IC50 quercetin was 4 times more active than DMSO. This indicated that IC50 might overestimate the antioxidant activity and adopting the more stringent IC70 is probably justified and showed be the way forward. In this study, interaction between sample and concentration was significant (p<0.001) in DPPH assay because the inhibition was dose dependent. Astaxanthin was also reported in a previous study28 to dose-dependently inhibit DPPH and galvinoxyl free radicals. However, all three solvents tested in this study gave similar potential at higher concentrations (p>0.05).
In terms of FRAP, highest FRAP quenching activity obtained was 389.4 ± 0.05 (µM TE/g) observed in DMSO which was significantly higher than other solvents (p<0.05). FRAP quenching activity of DMSO was also higher than oleoresin samples obtained from H. Pluvialis’s which was 313.76±5.92 (µM TE/g).29 Oleoresin was prepared by mixing the compound of interest with different vegetable oils in order to stabilize the antioxidant compounds. DMSO samples in this study appeared to be more stable than oleoresin samples.
HRSA was also investigated and was the only assay in which 40% acetone samples showed higher antioxidant activity than DMSO and methanol. A study30 on various extraction solvents and methods on astaxanthin shoed that the highest HRSA obtained was 18.80% using Magnetic-field-assisted extraction (MFAE) method at concentration of from 25 mg/mL. HRSA results obtained in this study were higher and ranged from 16 to 38% at concetration of 0.5 mg/mL. Antioxidant assay such as HRSA and oxygen radical absorbance capacity (ORAC) are based on ability to donate hydrogen, hence, polar samples are expected to have higher HRSA. 40% acetone sample was the most polar and it had the highest HRSA as expected.31,32,33 ORAC value of HPP extract which was dissolved in 40% acetone and methanol was higher compared to DMSO extract.24 Antioxidant activity of H. Pluvialis’s Oleoresin (non-polar) was also found to be very low based on ORAC assay (5.22±0.16 µmol TE/100 g) compared to other antioxidant test such as FRAP.29 Hence, HRSA assay is highly based on polarity.
Recovery of astaxanthin was investigated via HPLC in order to assess the solubility of astaxanthin in selected solvents. During sample preparation, astaxanthin dissolved in DMSO sample showed dark red, methanol sample was light red, while 40% acetone was almost colorless. This variation of color already indicated the low solubility of astaxanthin in 40% acetone. This observation was confirmed by HPLC results where 40% acetone yield was approximately 5 folds lower DMSO and methanol. These results indicated that astaxanthin has low solubility in polar solvents which could significantly affect its antioxidant activity, especially in hydrogen atom transfer (HAT) based assay such as HRSA.
Conclusions
The colorimetric DPPH and FRAP assays gave significantly different results compared to non-colorimetric HRSA assay. Results indicated that the main factor could be the solubility of astaxanthin in selected solvents and not due to its color. DMSO was the best solvent and achieved highest astaxanthin recovery. The hydrogen atom transfer (HAT) based assay such as HRSA might not be suitable for non-polar samples such as astaxanthin because it’s highly affected by solvent polarity. The study also recommends the use of inhibition potential of 70% (IC70) in assessing antioxidant activity as it appeared to be more stringent and accurate.
Acknowledgments
Authors gratefully acknowledges the financial support provided by the University Malaysia of Terengganu research Grant (PGRG No 55193/7), University Malaysia Terengganu, Kuala Terengganu, for providing financial support for this project. Also we would like to express my appreciation to Desy Fitrya Syamsumih from University Malaysia Terengganu (Institution Marine Biotechnology) and Nik Mohd Hafiz. A (UMT, Central lab) for their kind assistance to complete the experiments.
Conflict of Interest
No potential conflict of interest was reported by the authors.
References
- Nishida, Y.; Yamashita, ; Miki, W. Carotenoid Sci., 2007, 11, 16–20.
- Dalei, J.; Sahoo, D. J. Pharm. Sci. Res., 2015, 6, 2532.
- Yamashita, Foods Heal. Dis.,2013, 3, 254–258.
- Akar, Z.; Küçük, M.; Doğan, H. Enzyme Inhib. Med. Chem., 2017, 32, 640–647.
- Machado, F. R. S.; Jr.; Reis, D. F.; Boschetto, D. L.; Burkert, J. F. M.; Ferreira, S. R. S.; Oliveira, J. V.; Burkert, C. A. V. Industrial Crops and Products., 2014, 54(2), 17–21.
- De Camargo, A. C.; Biasoto, A. C. T.; Schwember, A. R.; Granato, D.; Rasera, G. ; Franchin, M.; Rosalen, P. L.; Alencar, S. M.; Shahidi, F. Food Chem,. 2019, 290, 229–238.
- Mishra, K..; Ojha, H.; Chaudhury, K.. Food Chem., 2012, 130, 1036–1043.
- Harnly, J. J. Food Compos. Anal., 2014, 64(2), 145-146.
- Sancho, L. E. G. G.; Yahia, E. M.; González-Aguilar, G. A. Food Nutr. Sci., 2013, 4, 93–100
- Shalaby, E. A.; Shanab S. M. M. Indian J. Mar. Sci., 2013, 42, 556–564
- Huang, ; Boxin, O. U.; Prior, R. L. J. Agric. Food Chem., 2005, 53, 1841–1856.
- Kiren, Y.; Deguchi, ; Hirasawa, Y.; Morita, H.; Prajogo, B. J. Nat. Med., 2014, 68, 754–758.
- Pavithra, .; Vadivukkarasi, S. Cogn. Food Sci. Hum. Wellness., 2015, 4, 42–46.
- Tirzitis, G.; Bartosz, G. Acta Biochim. Pol., 2010, 57, 139–142.
- Dey, S. S.; Dora, K. C. Food Sci. Technol., 2014, 51(3), 449-57.
- Wang, Y.; Sun, D.; Chen, H.; Qian, L.; Xu, P. J. Mol. Sci., 2011, 12(11), 7708-19.
- Polotow, T.; Vardaris, C.; Mihaliuc, A.; Gonçalves, M.; Pereira, B.; Ganini, D.; Barros, M. Nutrients., 2014, 6(12), 5819-38.
- Sasikumar, V.; Kalaisezhiyen, P. Food science and human wellness., 2014,3(2),1.
- Tzanova, ; Argirova, M.; Atanasov, V. Biomed. Chromatogr. 2017; 31(4) 1–8.
- López-Cervantes, ; Sánchez-Machado, D. I.; Rosas-Rodríguez, J. A. J. Chromatogr. A., 2006, 1105(1-2), 106-110.
- Chintong, S; Phatvej, W; Rerk-Am, U; Waiprib, Y; Klaypradit, W. , 2019, 8(5), 128.
- Gangwar, M; Gautam, M. K; Sharma, A. K; Tripathi, Y. B; Goel, R. K; Nath, G. (2014). World J, 2014, (2014), 1-12.
Accepted on: 15 Jun 2020


![]()


