Carbon Nanofilms Blended with Polyvinyl Pyrrolidone and Triton X-100 for Energy Harvesting Application
Asma M. Elsharif1 and Oroob A. Bukhari2
1Department of Chemistry, College of Science, Imam Abdulrahman Bin Faisal University, Dammam 31441, Saudi Arabia
2Department of Biochemistry, College of Science, King Abdulaziz University, Jeddah 21512, Saudi Arabia
Corresponding Author E-mail: aelsharif@iau.edu.sa
DOI : http://dx.doi.org/10.13005/ojc/360306
Article Received on : 30 April 2020
Article Accepted on : 20 May 2020
Article Published : 03 Jun 2020
Carbon nanotubes (CNT) have exceptional intrinsic mechanical, electrical and thermal properties. Carbon nanotube films (CNF), thicknesses ranging from several nanometers to several micrometers, have been prepared using a vacuum filtration method from commercially purchased CNT powders. Polyvinyl Pyrrolidone (PVP) has been studied as a new surfactant system in isopropyl alcohol along with Triton X-100. CNF microstructure was characterized using scanning electron microscopy. The physical, electrical and mechanical properties of these films were measured and the relationships between preparation conditions and film properties were investigated. CNFs having sheet resistance from 4Ω/sq to 300Ω/sq and mechanical strength up to 70MPa were produced. It was found that CNFs fabricated using PVP exhibit better dispersion and mechanical properties than CNFs fabricated using Triton X-100. Laminar structure of the obtained CNF and piezoelectric wafers (PZT) and (PVDF), were prepared and their energy harvesting properties were investigated using light and heat source. Various PVDF/CNF cantilever were prepared and their energy harvesting characteristics were investigated.
KEYWORDS:CNT Dispersion; PVP; PVDF; Self-Reciprocating; Sheet Resistance; Triton X-100; Tensile Strength
Download this article as:| Copy the following to cite this article: Elsharif A. M, Bukhari O. A. Carbon Nanofilms Blended with Polyvinyl Pyrrolidone and Triton X-100 for Energy Harvesting Application . Orient J Chem 2020;36(3). |
| Copy the following to cite this URL: Elsharif A. M, Bukhari O. A. Carbon Nanofilms Blended with Polyvinyl Pyrrolidone and Triton X-100 for Energy Harvesting Application . Orient J Chem 2020;36(3). Available from: https://bit.ly/2Ay2DVS |
Introduction
Recent years have led to fast development in the field of microprocessor, memory storage, wireless technology, etc., which requires batteries to last for long time to power them. But the current state of art batteries also needs to be replaced periodically. As this electronic equipment’s require less and less power to operate, ambient power sources become a possible replacement for batteries and can minimize maintenance cost. Energy harvesting or scavenging devices can be used to power these electronic devices [1]. These devices use energy sources such as mechanical vibrations, electromagnetic sources, light, acoustic, airflow, heat and temperature variations [1]. Energy harvesting is the conversion of energy sources into useful electrical energy. In 1952, Russian scientists, Radushkevich and Lukyanovich discovered the 50nm diameter carbon nanotubes (CNT) and it was largely unnoticed till 1991 [2]. With the re-discovery of multiwall carbon nanotube (MWNT) by S. Iijima in 1991 [3], it has gained vast importance in nanotechnology field. Due to its unique electrical, mechanical, chemical and thermal properties, they are used in many applications such as actuators, transparent electoral-effect transistors, electrodes for electrochemical devices (batteries, capacitors and fuel cells), chemical sensors, superconductors, vacuum electronic devices, field emitters, etc. [1, 4, 5]. CNTs have conducting, insulating or semiconducting properties according to their hexagonal rolling direction [6]. With the discovery of self-reciprocating fluctuation behavior of carbon nanotube film (CNF) by Venu Kotipalli et al[7], it has opened a new area for CNF in the field of energy harvesting. The characteristics of CNT in absorbing photons and its high electrical and thermal conductivity lead CNF/PZT (lead zirconate titanate) laminar structure to vibrate continuously under the energy source infinitely. This avoids the extra energy requirement for modulating the energy source for energy harvesting application.
Carbon nanotubes were first discovered in 1991 by S. Iijima when producing fullerene using arc discharge evaporation method [3]. CNTs can be viewed as long cylinders of rolled graphene with long aspect ratio. A perfect tube is closed by two hemi fullerenes at the ends. It is also called as isomers of fullerenes. C60 is the spherical fullerene and by adding one layer of hexagon carbon atoms produce the smallest carbon nanotube C70. There are two types of CNT: Single wall CNT (SWNT) and Multi wall CNT (MWNT). MWNT are formed by many nested cylinders whose wall distance differs by interlayer spacing of graphite. MWNT may have outer shell diameter >30nm with varying number of shells [6]. SWNT can be visualized as a rolled up single layer of graphene as shown in Fig. 1 [8]. Seamless SWNT diameters range from 0.4nm to 10nm and runs to several micrometers in length. Larger diameter SWNT (> 5nm) are predicted to collapse at the atmospheric pressures. There are three possibilities of rolling up graphene sheets as shown in Fig. 2. The tube diameter is determined by the width of the rectangular strip and there is a requirement for proper orientation of hexagonal lattice structure. This allows for the finite number of roll up choices, i.e., three types; armchair, zigzag and chiral. In armchair type, some of the C-C bonds lie perpendicular to the tube axis. In zigzag, some of the C-C bonds lie parallel to the tube axis and in chiral C-C bond is intermediate between parallel and perpendicular to tube axis. The different rolling has influence on the electronic properties, i.e., in some case it is conducting and other it is insulating. CNTs have the property of light weight and high stiffness combined with electrical conductivity and low thermal expansion which made this material to find new applications [6].
![Figure 1: Visualization of Single wall carbon nanotube [8]](http://www.orientjchem.org/wp-content/uploads/2020/06/Vol36No3_Car_Asm_Fig1-150x150.jpg) |
Figure 1: Visualization of Single wall carbon nanotube [8] |
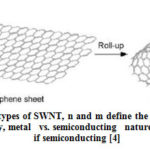 |
Figure 2: Different types of SWNT, n and m define the tube characteristics: |
The big challenge in CNT film fabrication is the dispersion and stabilization of CNTs in solvent [9]. The synthesized CNTs are bundled together by Van der Waals forces [10], which makes difficult to separate them. There are three types of methods commonly available to separate CNTs [9]. (1) Physical blending – in this method, CNTs are separated by mechanical forces such as sonication. The quality of CNT dispersion is poor; it shortens the CNT length and precipitates faster after sonication. (2) Chemical functionalization – in this method, CNTs are treated with strong oxidizing reagents to form functional groups such as carboxylic acids, fluorine, alkanes on the nanotube walls. In this method CNTs can be made water or solvent soluble depending on the groups attached to it [9]. The dispersion quality is good but it reduces CNTs electrical and mechanical properties. (3) Dispersant assisted dispersion – in this method, dispersant or surfactant or polymer is mixed along with CNT in solution and sonicated. CNTs are de-bundled and stabilized by the dispersant through non covalent interactions and this avoids the destruction of chemical, electrical and mechanical properties [9]. As the dispersant assistant dispersion is very powerful, many dispersant/ surfactants/ polymers were investigated. They can be anionic, cationic or non- ionic type. Some of the commonly used surfactants are sodium octyl benzene sulfonate (NaOBS; C8H17C6H4SO3Na), sodium dodecyl benzene sulfonate (NaDDBS; C12H25C6H4SO3Na), sodium butyl benzene sulfonate (NaBBS; C4H9C6H4SO3Na), sodium dodecyl sulfate (SDS; CH3(CH2)11-OSO3Na), sodium benzoate (C6H5CO2Na), dodecyltrimethylammonium bromide (DTAB; CH3 (CH2)11 N(CH3)3 Br), Triton X-100 (TX-100; C8H17C6H4 (OCH2CH2)n – OH; n ~ 10), and dextrin [11]. Some of the block polymer and copolymers are poly(styrene)-poly-(ethylene oxide) (PS-PEO) diblock copolymer [11], poly(m- phenylene vinylene), poly(propionylethylenimine-co-ethylenimine) [12], poly(3-alkylthiophene), poly(aryleneethynlene) poly(ethylene oxide) (PEO) with poly(propylene oxide) (PPO) (PEOPPO-PEO), polystyrene (PS) with poly(t- butylacrylate) (PBA) or poly(vinyl pyrrolidone) (PVP) [9], polystyrene sulfonate (PSS), poly(1-vinyl pyrrolidone-co-vinyl acetate), poly(1-vinyl pyrrolidone-co- acrylic acid), polyvinyl sulphate, dextran, dextran sulphate [13].
The mechanism of adsorption of surfactant on the CNT was proposed by Islam et al [11]. The authors varied the concentration of surfactant to CNT ratio from 5:1 to 10:1 in water and found that NaDDBS as a suitable surfactant compared to SDS and Triton X-100. They found the minimum concentration of surfactant was greater than critical micelle concentrations for the CNT concentration more than 0.1mg/ml. Fig. 3 shows the schematic representation of adsorption of surfactant on the CNT walls. The authors believed that CNT surface was covered by hemi-micelles [14]. The superior dispersing capability of NaDDBS compared to that of SDS (dispersing capability ≤0.1 mg/ml) or TX-100 (≤0.5mg/ml) can be explained in terms of graphite- surfactant interactions, alkyl chain length, head group size, and charge as pertains particularly to those molecules that lie along the surface, parallel to the tube central axis [11]. The like stacking of benzene rings in the surfactant is important for the strong binding between CNT surface and the surfactant which results in good dispersion. Alkyl chains in the surfactant lie parallel to the surface of CNT, which is energetically favorable rather than surrounding the tube diameter. Longer chain groups increase the stability giving similar rings and head groups [11].
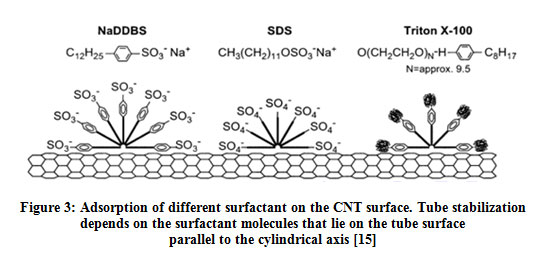 |
Figure 3: Adsorption of different surfactant on the CNT surface. Tube stabilization |
Ji. et al [15] has carried out systematic study on the different type of surfactants (cationic, anionic and neutral) in dispersing high concentration of CNTs in aqueous solution. They have used different concentration of surfactants; Igepal CO-990 (IGP) [polyoxyethylene (100) nonylphenyl ether] (neutral), cetyltrimethylammonium bromide (CTAB) (cationic), and sodium dodecylsulfate (SDS) (anionic) and found that optimum concentration of surfactants was slightly higher than the critical micelle concentrations which indicated that they are adsorbed on the walls of CNTs. Authors have introduced the use of IGP as good surfactant compared to CTAB and SDS. Authors believe that interaction of ionic surfactants with the nanotube surface may be weaker than that of neutral surfactant (IGP) because they do not have aromatic rings. Among ionic surfactants, CTAB disperses better compared to SDS because it has longer alkyl chain length (~2nm) than SDS (~1.5nm) [15]. Micheal et al [13] has explained that wrapping of polymers on surface of CNTs is a general phenomenon of water soluble polymers such as PSS and PVP (Fig. 4). Igal et al showed that copolymers are designed in such a way that one block of polymer will form a close interaction with the CNT walls, while the other blocks will provide solubility to the exfoliated CNT by forming a steric barrier or repulsion interaction between polymer wrapped nanotubes [9, 16].
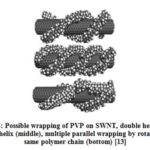 |
Figure 4: Possible wrapping of PVP on SWNT, double helix (top) |
Polymers with higher molecular weights were able to facilitate the dispersion of higher amounts of carbon nanotubes. Higher molecular weights of the hydrophilic group (PEO) led to better dispersions when compared to other polymers with lower molecular weight hydrophilic groups or high molecular weight hydrophobic groups. This is due to the fact that hydrophilic groups extend into the water, impeding the carbon nanotube aggregation. Therefore, it works to increase distance between the carbon nanotubes reducing the Van der Waals forces. This type of stabilization doesn’t occur in ionic surfactant solutions, because the surfactant systems work on charge repulsion. This procedure, involves the mechanical separation of the carbon nanotubes through sonication, which allows the polymer to coat the carbon nanotubes [9, 13, 16]. Some of the commonly used solvents are water, chloroform, isopropyl alcohol, toluene and tetrahydrofuran (THF) [9]. The optimal sonication time depends on the CNT preparation and functionalization, the surfactant choice, CNT and surfactant concentration, the sonication power and amplitude, solution volume and temperature and pH value [15].CNT films (CNF) are emerging materials with exceptional electrical, mechanical and optical properties which can be utilized into many novel devices. These properties suggest they have applications in conducting or semiconducting layers in different types of electronic, optoelectronic and sensor systems [17]. Formation of CNF is the basic step for many of the applications. The following list shows the methods available for the fabrication of films [17]. (1) Chemical vapor deposition (CVD), (2) Electrophoretic deposition, (3) Drop drying from solvent, (4) Langmuir–Blodgett technique, (5) Self-assembling method, (6) Electro-polymerization and (7) Vacuum filtering method. Out of these methods, vacuum filtration technique is very simple and can be used to produce films in large scale (Fig. 5). This technique can be used to produce ultrathin, transparent, optically homogeneous, electrically conducting films composed of pure CNTs. This process consists of three steps: vacuum filtering the dilute, surfactant based CNT dispersion through membrane, then washing the film to remove the surfactant and finally removing the membrane filter using solvent or peeling off the film from filter after drying.
![Figure 5: Vacuum filtration technique for preparing CNT film [18]](http://www.orientjchem.org/wp-content/uploads/2020/06/Vol36No3_Car_Asm_Fig5-150x150.jpg) |
Figure 5: Vacuum filtration technique for preparing CNT film [18] |
Venu et al[7] developed a cantilever with CNF and PZT for thermal, light and vibration energy harvesting in single unit. Typical device of 20mm x 8mm x 300 microns produces a maximum of 0.85μW and generates open circuit voltage up to 8V. The PZT and CNF cantilever is seen to have self-reciprocating response due to the characteristics of CNF. CNT absorbs and converts photon energy into thermal and electrostatic energy. Temperature rise of CNT coupled with its high thermal conductance increases the temperature of CNF rapidly, resulting in the expansion of CNF and its actuation. When light is incident on the CNTs, they stretch, bend and repel. Non uniform charge distribution exists in CNF due to the electron-hole pair generation in the CNTs, resulting in formation of electrostatic field, which causes the CNF to expand [18].
Experimental
CNF Fabrication
SWNT (Cheaptube.com, >90 wt%, CVD method) was used for CNF fabrication. For dispersing CNTs, Isopropyl alcohol (IPA) (Fisher Scientific, >99.5%) was used for most of the experiments and deionized water for a few experiments. Polyvinyl pyrrolidone (PVP) (Aldrich, 25000 molecular weight) and Triton X-100 (Aldrich) were used as surfactant. Ultrasonic bath (Fisher Scientific, FB11078 and Fisher Scientific, FB15051) was used to sonicate the CNTs in solution. As the ultrasonic equipment available could not be used for more than 2hr continuously, magnetic stirring (MS) was used overnight to keep the CNTs from not getting agglomerated (when timer was not available). Ultrasonic stirring with a timer was used for later part of experiments where 15min cooling time was provided for every 2 hrs. of continuous stirring. Various concentration of CNTs (10, 20, 30 and 40mg/100ml IPA) were dispersed under various sonication time (10hrs to 35hrs) with different surfactant concentration. Summary of experiments carried out are listed in Table 1. Two types of solution were used for film fabrication; dispersed and centrifuged supernatant solution. For supernatant solution, centrifuging unit (Fisher Scientific, accuSpinTM 400) was used at 3000 rpm to remove less dispersed CNTs. Mixed Cellulose Ester (MCE) membrane filter (Whatman ME24ST, Ø47mm, 0.2µm pore size) was used to vacuum filter (Fig. 6) the dispersed CNT solution. Vacuum was allowed for 20-30min to ensure good film formation. CNF was washed with IPA and water alternatively for three to four times. CNF from filter was removed by two methods; for thick films, CNF was directly peeled from the film and for thin films, filter was dissolved in acetone and the film was cleaned several times in acetone to remove filter completely. The films were dried in electric oven at 80̊ C for 2hrs or 150̊ C for 30min to remove any residual organic solvents and surfactants.
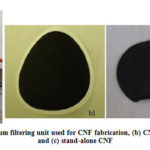 |
Figure 6: (a) Vacuum filtering unit used for CNF fabrication,(b) CNF |
Table 1: Summary of experiments used for CNF fabrication
|
SI No |
Concentration Mg/100 ml |
Solvent |
Surfactant |
CNT: Surfactant ratio |
Ultrasonic time |
|
1 |
40 |
IPA |
Triton X-100 |
1:1.5 |
11, 13, 16, 20, 24 |
|
2 |
10 |
IPA |
PVP |
1:2 |
17.5, 22, 35 |
|
3 |
20 |
IPA |
PVP |
1:2 |
17.5, 22 |
|
4 |
30 |
IPA |
PVP |
1:1, 1:2 |
6.25, 7, 8.5, 14.5, 20, 22 |
|
5 |
40 |
IPA |
PVP |
1:2, 1:5, 1:10 |
11, 13, 16, 20, 22, 24, 35 |
|
6 |
20 |
water |
PVP |
1:5, 1:10, 1:15 |
2.75, 18 |
CNF Characterization
CNF thickness was measured using a micrometer. Electrical resistance measurements were carried out using a four-point probe method. The four point probe equipment has four equally spaced tungsten tips with finite radius (Fig. 7). Each tip is supported by spring to avoid any damage during pressing and releasing against the sample. Current is supplied through outer two probes and voltage across the inner two probes is measured in voltmeter. Typical spacing between probes is 1mm3.
![Figure 7: Four point probe configuration [19]](http://www.orientjchem.org/wp-content/uploads/2020/06/Vol36No3_Car_Asm_Fig7-150x150.jpg) |
Figure 7: Four point probe configuration [19] |
For thin sheets (thickness << spacing between probes), current rings are formed. Current flows across the sheets instead of through thickness as in bulk sample. Therefore, the expression of area A= 2πxt.
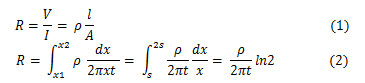
As the current is superimposed at the outer two tips, R=V/21, then the sheet resistance for thin sheet is:
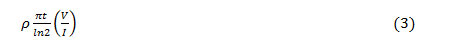
In general, sheet resistance Rs=p/t can be expressed as;
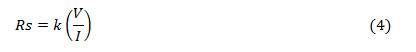
Where k=4.53 which is equal to π/ln2 from the equation (2-3) for semi-infinite thin sheet.
Current was varied to check the voltage changes and using equation (2-4), resistance of the film was calculated. Resistance measurements were taken at three different locations on the film. At each location the current was increased from 1mA to 10mA and the corresponding voltage generated was measured and recorded. The calculated three resistance values were averaged and the averaged value was used for plotting the graphs. Tensile strength and Young’s modulus of the film was characterized using a micro tensile testing machine (DEBEN Microtest). 2N load cell was used. Two thick plastic sheets were fixed at two sample holder; double sided tape was used to attach the film specimen on the testing fixture. 1mm to 2mm width and 10mm to 15mm length specimen sizes were used for tensile testing. Force versus displacement curve was plotted automatically (Fig. 8).
 |
Figure 8: Typical force vs displacement curve generated by micro tensile testing machine |
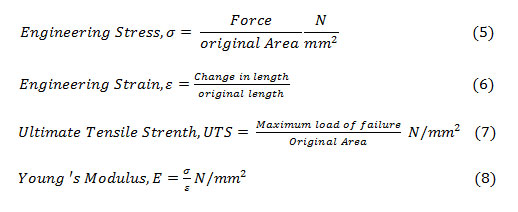
Engineering stress, strain, tensile strength and Young’s modulus were calculated using the formulas (2-5) to (2-8) from the available data.
CNTs distribution in CNF was viewed using Philips XL30 SFEG scanning electron microscope (SEM).
Energy Harvesting Device
Cantilever type energy harvesting device was fabricated using Piezoelectric material (PZT and PVDF) and CNF with approximately 10mm width x 25mm length x thickness (depends on the piezoelectric material and CNF) dimensions. PZT (piezo systems, Inc) of different thickness (127µm, 191µm and 267µm, Nickel electrodes on both sides) and PVDF (Precision Acoustics, 52 µm and 110µm poled, gold electrodes on both sides) were used for experiments. Piezoelectric material and CNF were bonded using double sided tape. Electrical leads were connected at both sides of piezoelectric material. 100W electric bulb at the distance of 60mm from the device was used as the light and thermal energy source. A thermocouple was attached near to the cantilever to measure the temperature. An oscilloscope (Agilent Technologies, MS06104A) was used to observe the output signal.
Results and Discussion
Physical Properties of Carbon Nanotube Film (CNF)
Uniform standalone CNF was obtained with varying thicknesses and transparency (thousands of nanometers to several micrometers). Thickness of the film produced depends upon the quantity and concentration of the CNT solution used for vacuum filtration. CNF produced were mostly uniform in thickness which was confirmed by measuring the thickness in many places of CNF. Uniformity of CNF can be explained as follows; as the CNTs accumulate in the filter membrane, permeation rate of the filter cake differs locally and this automatically adjusts the permeation rate in other places. This leads to uniform distribution of CNTs on the filter membrane. Also, vacuum assists in stretching CNT bundles parallel to the surface of filter membrane and increases the chances of interaction between CNTs by means of overlapping and interpenetration between them[17].
SEM Characterization
Fig. 9 shows the SEM image of agglomerated SWNT powders. Fig. 10 shows the SEM image of CNF. From both the figures it is seen that CNTs are entangled /overlapping/ interconnected together and various diameter of the CNT bundles. The different bundle diameters of CNTs show that they were separated during ultra-sonication.
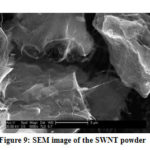 |
Figure 9: SEM image of the SWNT powder |
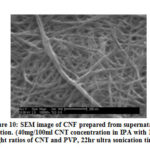 |
Figure 10: SEM image of CNF prepared from supernatant solution. |
CNT Dispersion
The dispersion quality of CNT in IPA was visually assessed. The dispersed CNT solution with PVP shown better dispersion compared to Triton X-100. Dispersed CNT solution with Triton X 100 (150wt% of CNT) settled down after 1-2hr as compared to the CNT solution with PVP (200wt% of CNT) which lasted for more than two months. CNT solution containing same amount of PVP as CNT settled faster compared to twice the amount of CNT. This shows equal amount of CNT and PVP does not form a good dispersion system due to insufficient surfactant available to cover the CNTs to keep them dispersed in solution. Centrifuging of CNT solution with Triton X-100 (150wt% of CNT) has yielded a clear solution indicating the quantity of surfactant was not sufficient for CNT dispersion.
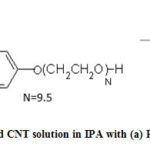 |
Figure 11: Centrifuged CNT solution in IPA with (a) PVP (b) Triton X-100 |
The difference in dispersion capability of surfactant can be explained as: dispersion stability increases with the increasing alkyl chain length, head group size and molecular weight. As molecular weight of PVP (25000g/mol) is higher compared to Triton X-100 (625g/mol), it has resulted in better dispersion compared to Triton X-100 [15]. The surfactant to be used also depends on the critical micelle concentration, which is not dealt within this project and the quantity of surfactant used was on lower side compared to the established literature (minimum 5 to 10 times the CNT concentration was used). According to this attempt, for lower surfactant concentration, CNT solution with Triton X-100 has yielded a clear solution after centrifugation compared to CNT solution with PVP.
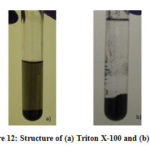 |
Figure 12: Structure of (a) Triton X-100 and (b) PVP. |
The varying PVP concentration in water shown that minimum of 1:10 weight ratio (CNT: PVP) of PVP is required for dispersing CNT. PVP concentration of 5 times the CNT has resulted in settling/ agglomeration of CNTs within one minute after the removal of solution from ultrasonic bath.
Effect of Ultrasonic Time on Sheet Resistance
Sheet resistance of CNFs fabricated range from 4Ω/sq to 300Ω/sq and it is in accordance with the established literature [20, 21]. Rs of most of the CNF produced have reduced by 2%-20% after drying, which indicates that most of the surfactants were removed during washing.
CNF with Triton X-100
Fig. 13 shows the variation of CNF sheet resistance with increase in ultrasonic time and Table 2 shows the summary of data. From the figure it is seen that sheet resistance ranges between 5 Ω/sq and 19 Ω/sq and the range is narrow. With increase in ultrasonic time there is slight decrease in Rs and with the same ultrasonic time, there is a decrease in Rs with increase in thickness.
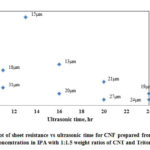 |
Figure 13: Plot of sheet resistance vs ultrasonic time for CNF prepared |
Table 2: Summary of sheet resistance for CNF prepared from dispersed solution (40mg/100ml CNT concentration in IPA with 1:1.5 weight ratios of CNT and Triton X-100)
|
SI No |
Ultrasonic Time (hr) |
Thickness ( µm) |
Rs±2.5% (Ω/sq) |
|
1 |
11 |
18 |
10 |
|
2 |
11 |
31 |
7 |
|
3 |
13 |
15 |
19 |
|
4 |
16 |
13 |
11 |
|
5 |
16 |
20 |
6 |
|
6 |
20 |
21 |
8 |
|
7 |
20 |
27 |
5 |
|
8 |
24 |
19 |
6 |
|
9 |
24 |
24 |
5 |
CNF with PVP
Fig. 14 shows the variation of CNF sheet resistance with increase in ultrasonic time and Table 3 shows the summary of data for CNF produced from dispersed solution. The range of Rs is between 9 Ω /sq and 41 Ω /sq. With increase in ultrasonic time there is slight decrease in Rs and with the same ultrasonic time, there is a decrease in Rs with increase in thickness. The variation of Rs (CNF produced with PVP) with respect to ultrasonic time in this case follows similar trend as of CNF produced with Triton X-100.
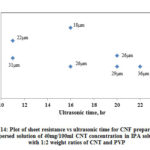 |
Figure 14: Plot of sheet resistance vs ultrasonic time for CNF prepared from |
Table 3: Summary of sheet resistance for CNF prepared from dispersed solution (40mg/100ml CNT concentration in IPA with 1:2 weight ratios of CNT and PVP)
|
SI No |
Ultrasonic Time (hr) |
Thickness ( µm) |
Rs±2.5% (Ω/sq) |
|
1 |
11 |
18 |
27 |
|
2 |
11 |
31 |
19 |
|
3 |
13 |
15 |
41 |
|
4 |
16 |
18 |
33 |
|
5 |
16 |
26 |
15 |
|
6 |
20 |
26 |
20 |
|
7 |
20 |
29 |
15 |
|
8 |
22 |
36 |
15 |
|
9 |
24 |
23 |
17 |
Fig. 15 shows the variation of CNF sheet resistance with increase in ultrasonic time and Table 4 shows the summary of data for CNF produced from supernatant solution. The range of Rs is between 10 and 44Ω/sq. The variation of Rs (CNF produced with PVP) with respect to ultrasonic time in this case follows similar trend as of CNF produced with Triton X-100 and CNF produced with PVP using dispersed solution.
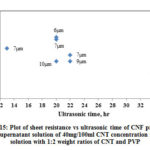 |
Figure 15: Plot of sheet resistance vs ultrasonic time of CNF prepared |
Table 4: Summary of sheet resistance for CNF prepared from supernatant solution (40mg/100ml CNT concentration in IPA with 1:2 weight ratios of CNT and PVP)
|
SI No |
Ultrasonic Time (hr) |
Thickness ( µm) |
Rs±2.5% (Ω/sq) |
|
1 |
13 |
4 |
44 |
|
2 |
13 |
7 |
23 |
|
3 |
20 |
6 |
28 |
|
4 |
20 |
7 |
27 |
|
5 |
20 |
10 |
17 |
|
6 |
22 |
7 |
20 |
|
7 |
22 |
9 |
17 |
|
8 |
35 |
16 |
10 |
The explanation for the above behavior is stated here. As the thickness increases there is increase in CNT network which results in more percolation pathway, the current carrying pathways increases (percolation pathway – refers to the ability of a charge to conduct from one point to another. Percolation limit – minimum number of CNT network required to allow the charge to flow across the two points). As there is no sharp change in Rs, it is clear that the thickness has already reached the percolation limit; hence there is only slight decrease in Rs as the thickness increases. As the ultrasonic time increases, there is a slight decrease in Rs. This is due to more CNT bundles/ individual CNTs were produced as a result of sonication. Due to separation of small CNT bundles/ individual CNTs from the starting thick CNT bundles, there is increase in surface area or more number of contacts are created. This increased tube- interaction has resulted in more current carrying pathways. This has led to decrease in Rs.
Fig. 16 shows comparison of thickness versus Rs for CNF produced from dispersed and supernatant solutions. From the figure it is shown that Rs for CNF produced from supernatant solution is lower compared to the CNF produced from dispersed solutions. The thickness and Rs of CNF produced from supernatant solution is lower than CNF produced from dispersed solution. The difference in Rs observed can be explained; though the thickness of CNF produced using dispersed solution is thicker, the density of CNF produced using supernatant solution is higher, which increases the possibility of flow of electrons. The higher density of CNF produced from the supernatant solution can be verified by comparing the strength of CNF produced from the dispersed (weaker) and the supernatant solution (stronger).
Moreover, the supernatant solution contains mostly dispersed CNTs, whose surface area is more compared to the CNT bundles. As the current is carried in the outer shell of the CNT bundles, even though more CNTs are available in thicker CNF, current carrying capacity is reduced because of less surface area available. Hence CNF produced from the supernatant solution showed lower Rs compared to CNF produced using the dispersed solution.
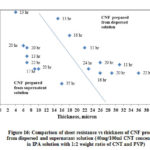 |
Figure 16: Comparison of sheet resistance vs thickness of CNF |
Comparison of Sheet Resistance of CNF Produced with Triton X-100 and PVP
Fig. 17 shows the comparison of Rs for CNF produced using PVP and Triton X-100 from the dispersed solutions. From the figure, it is shown that Rs of CNF produced using Triton X-100 are lower than the CNF produced using PVP. This may be due to the less covering of Triton X-100 over CNTs compared to better polymer wrapping of CNTs by PVP. As PVP has wrapped the CNTs there may be a more contact resistance at the intersection between CNT bundles in CNF. As already seen from dispersion, CNT solution with Triton X-100 has not dispersed compared to CNT solution with PVP, and most of the surfactant was washed away during cleaning. As there were few surfactants left and CNTs were not fully covered by Triton X-100, CNF might have shown low Rs. Moreover, PVP has dispersed CNTs to some extent in solution and has increased the tube-tube interactions in CNF, which could increase the contact resistance, thus leading to higher Rs compared to CNF produced with Triton X-100.
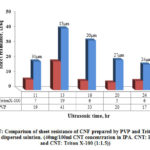 |
Figure 17: Comparison of sheet resistance of CNF prepared by PVP and Triton X-100 |
Effect of Ultrasonic Time on Tensile Strength
CNF with Triton X-100
Fig. 18 shows the variation of tensile strength with ultrasonic time of CNF prepared from the dispersed solution and Table 5 shows the summary of results. From the figure it is shown that, tensile strength ranges between 2.5 MPa and 5 MPa. Range is very small and there is no considerable trend noticed. The low mechanical strength of CNF may be due to non-dispersion of CNTs in solution and the CNF formed consists only of CNT bundles rather than the dissociated CNTs. From the dispersion point of view, the CNT solution has settled faster indicating there was not enough surfactant to cover the CNTs. As there is no considerable change in the strength as the ultrasonic time increases, it can be concluded that CNT surfactant ratio was not sufficient to disperse the CNTs in solution.
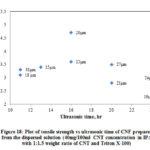 |
Figure 18: Plot of tensile strength vs ultrasonic time of CNF prepared |
Table 5: Summary of mechanical properties for CNF prepared from dispersed solution (40mg/100ml CNT concentration in IPA with 1:1.5 weight ratios of CNT and Triton X-100)
|
SI No |
Ultrasonic Time (hr) |
Thickness ( µm) |
UTS ±7.5%(Mpa) |
E ±7.5%(Mpa) |
|
1 |
11 |
18 |
3.1 |
76 |
|
2 |
11 |
31 |
3.3 |
52 |
|
3 |
13 |
15 |
3.4 |
45 |
|
4 |
16 |
13 |
3.6 |
130 |
|
5 |
16 |
20 |
4.7 |
59 |
|
6 |
20 |
21 |
2.8 |
42 |
|
7 |
20 |
27 |
3.5 |
43 |
|
8 |
24 |
19 |
2.6 |
40 |
|
9 |
24 |
24 |
2.7 |
30 |
CNF with PVP
Fig. 19 shows the variation of tensile strength with ultrasonic time of CNF prepared from dispersed solution and Table 6 shows the summary of results. From the graph it is seen that tensile strength ranges between 6 MPa and 22 MPa. The range is narrower, and there is a slight increase in strength as the ultrasonic time increases. The slight increase may be attributed to the increasing dispersion of CNTs in solution as the ultrasonic time increases.
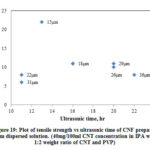 |
Figure 19: Plot of tensile strength vs ultrasonic time of CNF prepared |
Table 6: Summary of mechanical properties for CNF prepared from dispersed solution (40mg/100ml CNT concentration in IPA with 1:2 weight ratios of CNT and PVP)
|
SI No |
Ultrasonic Time (hr) |
Thickness ( µm) |
UTS ±7.5%(Mpa) |
E ±7.5%(Mpa) |
|
1 |
11 |
22 |
8 |
114 |
|
2 |
11 |
31 |
6 |
57 |
|
3 |
13 |
15 |
22 |
303 |
|
4 |
16 |
18 |
11 |
73 |
|
5 |
16 |
26 |
11 |
61 |
|
6 |
20 |
26 |
10 |
48 |
|
7 |
20 |
29 |
11 |
141 |
|
8 |
22 |
36 |
8 |
39 |
|
9 |
24 |
23 |
10 |
39 |
Fig. 20 shows the variation of ultrasonic time with tensile strength of CNF prepared from the supernatant solution and Table 7 shows the summary of results. Tensile strength of CNF produced range from 10 MPa to 65 MPa. There is a considerable increase in strength as the ultrasonic time increases. As the supernatant solution contains mostly dispersed CNTs the interaction between CNTs are better than the un-dispersed CNTs. The surface area phenomenon explained for the sheet resistance will hold well for the increased strength in CNF produced using supernatant solution. As the centrifuging force and time increases, the quality of the CNT dispersion obtained would be better which in turn resulted in higher strength.
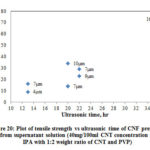 |
Figure 20: Plot of tensile strength vs ultrasonic time of CNF prepared |
Table 7: Summary of mechanical properties for CNF prepared from supernatant solution (40mg/100ml CNT concentration in IPA with 1:2 weight ratios of CNT and PVP
|
SI No |
Ultrasonic Time (hr) |
Thickness ( µm) |
UTS ±7.5%(Mpa) |
E ±7.5%(Mpa) |
|
1 |
13 |
4 |
41 |
277.2 |
|
2 |
13 |
7 |
16 |
115.7 |
|
3 |
20 |
6 |
14 |
100.4 |
|
4 |
20 |
7 |
14 |
102.8 |
|
5 |
20 |
10 |
34 |
200.5 |
|
6 |
22 |
7 |
29 |
297.8 |
|
7 |
22 |
9 |
23 |
127.9 |
|
8 |
35 |
16 |
67 |
225.7 |
Comparison of Tensile Strength of CNF Produced from Dispersed and Supernatant Solution with PVP
Fig. 21 shows the comparison of tensile strength for CNF produced from both dispersed and supernatant solution. From the figure it is shown that CNF produced from supernatant solution are stronger than the CNF produced from dispersed solution. The difference in the strength is attributed to the dispersion quality of CNT in solution and the surface area available for the tube-tube bonding by Van der Waals forces. As supernatant solution contains dispersed CNTs and the surface area or contact points available for interaction between dispersed CNTs are more than un-dispersed CNT bundles, CNFs produced using this solution are stronger than CNFs produced using dispersed solution.
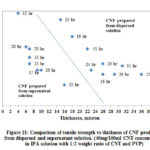 |
Figure 21: Comparison of tensile strength vs thickness of CNF produced |
Comparison of Tensile Strength of CNF Produced with Triton X-100 and PVP
Fig. 22 shows the comparison of tensile strength over ultrasonic time for CNF fabricated using Triton X-100 and PVP surfactant. It is shown from the figure that CNF produced with PVP surfactant is stronger than the CNF produced with Triton X-100. It is evident from above discussions that tensile strength is fluctuating over a narrow range. From 16 hrs to 24 hrs, strength varies marginally for CNF produced using PVP surfactant. This indicates that ultrasonic time between 16 hrs and 20 hrs is sufficient for CNT dispersion. Lower strength of CNF produced using Triton X-100 may be due to insufficient quantity of surfactant available to disperse the CNTs as indicated earlier. From the results obtained it is clear that the ratio of Triton X-100 used was not sufficient to disperse the CNTs in solution and further investigation is required to establish the relationship between ultrasonic time and strength.
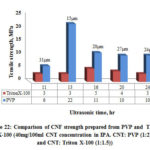 |
Figure 22: Comparison of CNF strength prepared from PVP and Triton |
Energy Harvester Characterization
Fig. 23 depicts the oscilloscope reading of the PZT/CNF cantilever under light source for 267µm PZT and 14µm CNF and Fig. 24 shows oscilloscope reading of the PVDF/CNF cantilever under light source for 52µm PVDF and 14µm CNF. Table 8 shows the summary of obtained voltages for different piezo/CNF cantilevers under exposure to energy source. From the figures, it is seen that, at switching on and off of the energy source, there is an increase in OCV and gradually it reduces to a minimum and from there onwards it keeps oscillating up and down continuously. The oscillating or fluctuating behavior is called self-reciprocating behavior and this is due to CNF characteristics. Self-reciprocating behavior of piezo/CNF has been explained under literature review[18]. The sudden rise and fall at switching on and off of the light source can be attributed to the pyroelectric effect of the PZT and PVDF. The self-reciprocating behavior of CNF has resulted in continuous generation of voltage. This phenomenon is very important in energy harvesting, because any piezo or pyro electric effect requires fluctuation in the energy to generate the voltage. As CNF absorbs and dissipates the light and heat energy continuously without any external interruption, these devices can generate energy continuously without any interruption and there is no need for any additional switching on and off requirement as in other energy harvesting methods utilizing pyro and piezo electric effects.
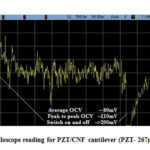 |
Figure 23: Oscilloscope reading for PZT/CNF cantilever (PZT- 267µm, CNF –14µm) |
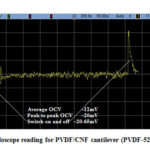 |
Figure 24: Oscilloscope reading for PVDF/CNF cantilever (PVDF-52µm, CNF-14µm) |
Table 8: Summary of OCV produced by different cantilever
|
Cantilever type (Piezo/CNF thickness in µm) |
Average OCV, mV |
Peak to Peak OCV, mV |
OCV at switch on and off |
|
|
PZT/CNF(267/14) |
60 |
110 |
>200 |
|
|
PVDF/CNF(110/14) |
7 |
10 |
20-40 |
|
|
PVDF/CNF(52/14) |
12 |
20 |
20-65 |
|
|
PVDF/CNF(52/29) |
6 |
13 |
20-80 |
|
From the above table, it is shown that out of 4 cantilevers, maximum voltage is produced from PZT/CNF cantilever compared to PVDF/CNF. PZT/CNF cantilever has produced higher voltage because PZT has higher piezoelectric coefficient than compared PVDF. The reason for choosing PVDF is due to its ease of handling and flexibility compared to PZT. Comparing the different thickness of PVDF along with CNF, it is seen that thinner PVDF has produced higher voltage (12mV) compared to thicker PVDF (7mV). This can be explained as: thicker material is stiffer than thinner material, hence thinner material can bend more compared to thicker material, resulting in more charge generation in piezoelectric material. Hence thinner piezoelectric material will be beneficial in producing higher voltages compared to thicker piezoelectric material. Comparing the different CNF thicknesses (14µm and 29µm) with same thickness of PVDF (52µm), it is seen that thinner the CNF, higher the voltage produced. Similar result has been reported recently by Gong et al [22]. The behavior can be due to the fast distribution of heat and phonon by thinner CNF compared to thicker CNF. Thicker films will absorb more heat and dissipates more heat, but it will be slow due to volume effect compared to thinner films. Hence thinner films fluctuate more often compared to thicker films. With the increase in fluctuation, cantilever containing thinner CNF also fluctuates more frequently resulting in producing higher voltage.
Conclusions
PVP as a new surfactant in IPA solution has been successfully investigated and the dispersion of CNT in IPA solution were stable for more than two months. CNF with strength up to 70 MPa and Young’s modulus up to 650 MPa have been produced. CNF produced using PVP surfactant shown higher strength compared to CNF produced using Triton X-100 surfactant for the surfactant ratios reported. Films produced with supernatant solution showed considerable improvement in mechanical strength due to the uniformly dispersed CNTs in solution. Sheet resistance of CNF from 4 Ω/sq to 300 Ω/sq have been produced. Electrical resistance of CNF produced using supernatant solution was better than the CNF produced using dispersed solution. Laminar structure of PZT/CNF and PVDF/CNF cantilever has been successfully fabricated for energy harvesting application and self-reciprocating behavior of CNF has been verified. PZT/CNF cantilever produces higher voltage compared to PVDF/CNF cantilever.
Acknowledgements
Facilities provided by Imam Abdulrahman Bin Faisal University are gratefully acknowledged.
Conflicts of Interest
Authors don’t have any conflicts of interest
References
- Yildiz, F. Journalof Technology Studies 2009, 35, 40-48
- Patel, V.K. Carbon Nanotubes the Wondrous Materials 2009
- Iijima, S. Nature 1991, 354, 56-58
- Stephen, A. H.; Mustafa, K. B.; Karl, S. C.; Milo, S. P. S. Chem Soc Rev. 2012, 41, 4409-4429
- Yao, Z.; Zhu, C.; Cheng, M.; Liu, J. Comput Mater. Sci. 2001, 22, 180-184
- Gogotsi, Y. Carbon nanomaterials, CRC/Taylor & Francis Boca Raton, FL 2006
- Kotipalli, V.; Gong, Z.; He, Y.; Yadav, S.; Penmetsa, S.; Wei, J.; Que, L. Proc of IEEE Sens. 2010, 1165
- Ströbel, R.; Garche, J.; Moseley, P. T.; Jörissen, L.; Wolf, G. J Pow Sour 2006, 159, 781-801
- Zou, J.; Liu, L.; Chen, H.; Khondaker, S. I.; McCullough, R. D.; Huo, Q.; Zhai, L. Adv Mater. 2008, 20, 2055-2060
- Girifalco, L. A.; Hodak, M.; Lee, R. S. Phys Rev B – Condensed Matter and Materials Physics 2000, 62, 13104-13110
- Islam, M. F.; Rojas, E.; Bergey, D. M.; Johnson, A. T.; Yodh, A. G. Nano Lett 2003, 3:269-273
- Riggs, J. E.; Walker, D. B.; Carroll, D. L.; Sun, Y. J Phys Chem B 2000, 104, 7071-7076
- O’Connell, M. J.; Boul, P.; Ericson, L. M.; Huffman, C.; Wang, Y.; Haroz, E.; Kuper, C.; Tour, J.; Ausman, K. D.; Smalley; R. E. Chem Phys Lett 2001, 342, 265- 271
- Manne, S.; Cleveland, J. P.; Gaub, H. E.; Stucky, G. D.; Hansma, P. K. Langmuir 1994, 10, 4409-4413
- Shin, J.; Premkumar, T.; Geckeler, K. E. Chem Eur J 2008, 14, 6044-6048
- Szleifer, I.; Yerushalmi-Rozen, R. Polym 2005, 46, 7803-7818
- Yellampalli, S. Carbon Nanotubes – Synthesis, Characterization, Applications, InTech Croatia. 2011
- Kotipalli, V.; Gong, Z.; Pathak, P.; Zhang, T.; He, Y.; Yadav, S.; Que, L. Appl Phys Lett. 2010, 97, 124102-3
- Chan, J.; Friedberg, P. Four Point Probe Manual available 2002
- Gu, H.; Swager, T. M. Adv Mater 2008, 20, 4433-4437
- Shi, Z.; Chen, X.; Wang, X.; Zhang, T.; Jin, J. Adv Funct Mater 2011, 21, 4358- 4363
- Gong, Z.; Tseng, Y. H.; He, Y.; Que, L. J Nanosci Nanotechnol. 2012, 12, 350-355

This work is licensed under a Creative Commons Attribution 4.0 International License.
![]()
A New Edition of Web of Science
Journal Impact Factor
2022: 0.5
Five Year: 0.8
Journal is Indexed in

Cabells Whitelist
![]()


