Simple Synthesis, Characterization of Cadmium Bismuth Iodide Nanostructure and its Visible-Light-Induced Photocatalytic Degradation of Toxic Dyes.
Department of Chemistry, Government Meera girls college, Mohanlal Sukhadia University. Udaipur – 313001, Rajasthan, India.
Corresponding Author E-mail: suraj.sharma3059@gmail.com
DOI : http://dx.doi.org/10.13005/ojc/360211
Download this article as:
![]()
Pollutants such as dyes, detergents, agro wastes, inorganic substances, pesticides, and herbicides, etc. are the main reason for water pollution. Many toxic organic contaminants in wastewater have been degraded through photocatalysis. So, nowadays researchers have been working for the removal and degradation of organic pollutants using some metal iodides as a photocatalyst. Present work comprises the synthesis of Cadmium Bismuth Iodide photocatalyst and its precursors through simple precipitation method and solid-state reaction. Cadmium Bismuth Iodide characterizes through XRD, FESEM, EDX UV-Vis analysis. Comparative photocatalytic degradation of Azure-A and Toluidine blue was studied using an as-prepared catalyst. The impact of several factors like pH, the concentration of Azure-A and Toluidine blue dyes, amount of Cadmium Bismuth Iodide and irradiation time were examined. Increment in the reaction rate of both dyes was monitored with the help of a spectrophotometer. A tentative mechanism has been proposed for photocatalytic decomposition of both dyes.
KEYWORDS:Cadmium Bismuth Iodide; DRS; EDS; FESEM; XRD
Introduction
The rapid development of various manufacturing technologies such as- textile, food, leather, paper, and printing, etc. enhanced the well-established living system of humans. The toxic effluents from these industries generate high risk for living as well as non-living things.1 The following industries contain residual dyes and other pollutants that directly discharge to the water bodies to get them polluted. Photocatalysis considered as one of the best promising methods for degrading toxic organic pollutant from various industrial effluents.2 Synthesized or modified photocatalyst such as- TiO2, CdS, Fe2O3, ZnO, Ag3PO4, etc. show redox processing in the presence of light because their electronic structure found in the form of chemical combination that was described as a filled and empty band of conduction and valence respectively.3 Photocatalyst of metal oxides, metal sulfide, and oxyhalides are found in larger amounts in nature and used at large scale as photocatalyst. It is due to their biocompatibility, extraordinary durability in a different phase and ability to generate charge carries.4 Heterogeneous photocatalyst perform good efficiency to mineralized various organic compounds into simple and biodegradable substance.5 This kind of photo-induced degradation process is mainly required for an obtained better quality of water by the eviction of micro-organism and cyanotoxins.6 and other pollutants as this can render water reusable.7 Hence, the synthesis of some different types of photocatalyst which can generate charge separation in visible-light absorption is still challenging and demanding.
In recent years, researchers produced different kinds of photocatalyst such as metal oxides8, nanomaterials9, nanocomposites10, nanofibers11, and nanoparticles12, etc. There was limited work reported on the synthesis of different metal iodides. Especially, A2BI4, ABI3 type ternary metal iodides are synthesized for degradation of organic contaminants from wastewater streams13.
Azure-A and Toluidine blue both are belonging to the Thiazine group having almost the same structural composition. The rapid use of these dyes is mainly in textile paper, colouring, and biological industries. These dyes harm for the human being. Acute exposure to dyes causes vomiting, jaundice and increased heart rate. So, the present work aims to successfully achieve the controlled synthesis of Cadmium bismuth iodide photocatalyst. Taking Azure-A (AA) and Toluidine blue (TB) dyes as a degradable product we have studied the photocatalytic efficiency of the synthesized photocatalyst.
Experimental
Materials and Reagents
Chemical compounds which were used in the experimental work, such as Cd(NO3)2.4H2O, KI and Bi(NO3)3.5H2O were of analytical grade and purchased from Merck company and used as received without further purifying. All the required aqueous solution of reagents and dyes were made up in double distilled water
Synthesis of Photocatalyst
In the typical experimental procedure, Cadmium bismuth iodide was synthesized from Cd(NO3)2.4H2O, Bi(NO3)3.5H2O and KI as starting materials.
Firstly CdI2 (Black) precipitation was prepared by 0.1M concentration of Cd(NO3)2.4H2O. Cadmium nitrate was dissolved in double distilled water to obtain its aqueous solution. After that approx 8 ml of concentrated HNO3 was added which showed common ion effect and after stirring for 5 min with a magnetic stirrer at room temperature, while stirring 0.1M aqueous solution of KI was added dropwise into the cadmium nitrate solution to obtain a black precipitate of CdI2. Similarly, BiI3 was synthesized by using 0.1M Bi(NO3)3.5H2O, concentrate HNO3 and 0.1M KI.
Finally, Cadmium bismuth iodide was synthesized by mixing CdI2 and BiI3 in a 1:1 ratio and the fine powder was prepared by using a pestle mortar. The resulted powder underwent thermal treatment at 50-60o C in the oven for 8hrs. Subsequently, the catalyst was allowed to cool at the room temperature.
Characterization
XRD patterns were recorded by a Rigaku Ultima IV X-ray diffractometer using Ni-filtered Cu Ka radiation. FESEM images were taken on Hitachi-PU 5.0kV. DRS spectra were recorded using a UV-Vis spectrophotometer Hitachi 330 (PerkinElmer UV WinLab 6.0.3.0730 / 1.61.00 Lambda 900).
Photocatalytic Activity
The efficiency of Cadmium Bismuth Iodide was investigated by degrading Azure-A and Toluidine blue dye under visible light irradiation. The photodegradation reaction rate was monitored by measuring the optical density. The solution of Azure-A dye having catalyst was exposed under visible light for 100 min and sampling was done at 5 min intervals. The change in absorbance versus time was observed using a visible spectrophotometer (Chino) at the absorption band maximum 600 nm and 590 nm. Irradiation was carried out by exposure of 200 W tungsten lamp (Philips, light intensity = 74 mW/cm2) as a source of visible light. The light intensity was determined from the solarimeter (Surya Mapi Model CEL 201) in a unit of mW/cm2. A cut off water filter was placed on the reaction mixture to remove any thermal radiation
Results and Discussion
XRD Result
XRD analysis is a promising technique to determine crystalline structure and size. This is employed to investigate the crystalline structure of prepared precursors fig. 1(a & b) and photocatalyst fig.1(C). The X-ray diffraction pattern of precursor BiI3 is shown the diffraction lines of this pattern attributed to BiI3 (JCPDS=72-2373) shows the powder phase. Same as CdI2 also having the powder phase according to (JCPDS= 12-574).14
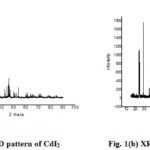 |
Figure 1: (a) XRD pattern of CdI2.(b) XRD pattern of BiI3 |
In fig. 2 the XRD pattern of Cadmium Bismuth Iodidethat synthesis at relatively low temperature in the oven for 8h and the mole ratio of CdI2: BiI3 is 1: 1. The structure of mixed metal iodides did not change when they undergo thermal treatment at low temperature. Heterogeneous iodides reveal the major diffraction peaks of Cadmium Bismuth Iodide at 2 theta values having the same plane of its precursor iodides. There are approximately the same peaks at the same intensity which shows no impurities and changes in structure and phase in the catalyst.
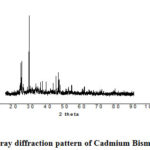 |
Figure 2: X-ray diffraction pattern of Cadmium Bismuth Iodide |
Table 1: Particle size of Cadmium Bismuth Iodide at 2 theta value
|
2 Theta |
Theta |
Theta in radian |
FWHM |
FWHM in radian |
Particle size (nm) |
Average (Particle size) |
|
24.12 |
12.06 |
0.2105 |
0.8872 |
0.0154 |
8.7526 |
|
|
23.98 |
11.99 |
0.2092 |
0.1305 |
0.0022 |
59.5245 |
|
|
24.45 |
12.22 |
0.2133 |
0.1272 |
0.0022 |
61.0150 |
|
|
28.74 |
14.37 |
0.2508 |
0.1151 |
0.0020 |
66.8352 |
49.5787 nm |
|
45.79 |
22.89 |
0.3995 |
0.1478 |
0.0025 |
49.4964 |
|
|
44.47 |
22.23 |
0.3880 |
0.1582 |
0.0027 |
46.4645 |
|
|
36.54 |
18.27 |
0.3188 |
0.1372 |
0.0023 |
54.9626 |
The crystallite size obtained by employing the Scherrer equation. DC = 0.9ʎ / B cosƟ where B= FWHM and ʎ is the X-ray wavelength (Cu Ka radiation 1.54 Ao). At different 2 theta value, we obtained particle size which tabulated in table 1. from this we calculated average particle size. The calculated average crystal size of the synthesized photocatalyst is approximate 49.5787 nm.
FESEM and EDX analysis
Fig.3(a-b) shows field emission electron micrograph of Cadmium bismuth iodide synthesized at relatively low temperature. Structure of catalyst pretends as on the sheet-like structure tiny particles of cadmium distributed uniformly. These images show the presence and systematic distribution of respective elements (Bi and Cd). Chemical purity of as prepared cadmium bismuth iodide photocatalyst has been investigated by Electron Diffraction X-ray spectroscopy (EDX). Fig.4 shows the product contains Cd, Bi, and I. The EDS spectrum shows no other peaks for any other element which confirms the purity of the phase.
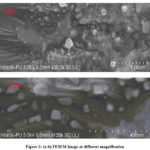 |
Figure 3: (a-b) FESEM image at different magnification |
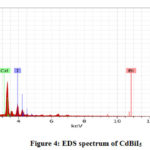 |
Figure 4: EDS spectrum of CdBiI5 |
UV-Vis NIR spectroscopy analysis
Fig. 5 (a) shows the Diffuse reflectance spectra of the prepared catalyst. The product shows a broad absorption spectrum from 200 nm to 800 nm. Two sharp peaks at 250 nm and 450 nm are observed from the figure. It can conclude that it absorbs visible light as well as in the UV region, therefore, it can be used in the photocatalyst applications.
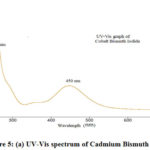 |
Figure 5: (a) UV-Vis spectrum of Cadmium Bismuth Iodide |
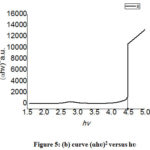 |
Figure 5: (b) curve (ɑhʋ)2 versus hʋ |
The bandgap of crystalline photocatalyst can be determined by using the absorption spectrum of the prepared catalyst. Following equation can be applied to evaluate band gap (Eg).15
(Ahʋ)n = B(hʋ – Eg)
Where hʋ, A, B are the incident photon energy, absorbance, material constant respectively, and n is 2 or ½ for direct and indirect transitions. So the bandgap of the product was obtained from the extrapolating of the linear line of)2 v/s optical band gap energy (h curve. In fig. 5(b) shows a 4.46 nm bandgap for Cadmium Bismuth Iodide.
Photocatalytic Degradation
The photocatalytic efficiency of Cadmium Bismuth Iodide was studied by observing the rate of degradation of Azure-A and Toluidine blue. Stock solution (1.0 x 10⁻³) of the following dyes was prepared by dissolving 0.029 g Azure-A and 0.030 g Toluidine blue dye in 100 ml. double-distilled water. A further working solution was made from this solution as and when desired. The optical density of the experimental solution was studied by spectrophotometrically at ʎmax 600 nm for Azure-A and 590 nm for Toluidine blue. The required pH of the reaction mixture was obtained by adding standard 0.1 N HCl and 0.1N sodium hydroxide solution. The experimental solution was illuminated with a 200 W tungsten lamp. The 100 ml. the beaker was filled with 50 ml. of the reaction mixture and approx 3 ml. of the sample were drawn. After every 10 min, the sample was examined under spectrophotometer. The light intensity was measured by solarimeter (Suryamapi, CEL 201). The illumination was varying by changing the distance between the lamp and the experimental solution. As the time of exposure increase, the absorbance was decreasing for both Azure-A and Toluidine blue dye. A straight line was obtained between 1+logA and time which indicates that photocatalytic degradation follows pseudo-first-order kinetics. The rate constant can be calculated using the following equation k = 2.303 x slope. The fixed-rate for photodegradation reaction at the optimum condition was obtained as k = 2.68 x 10⁻⁴ for Toluidine blue and 1.92 x 10⁻⁴ for Azure-A. A typical run for Toluidine Blue was graphically represented in fig. 6 and for Azure-A in fig. 7.
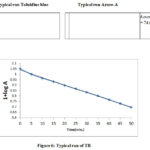 |
Figure 6: Typical run of TB |
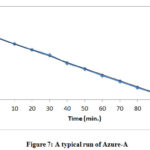 |
Figure 7: A typical run of Azure-A |
Effect of Various Parameters
Effect of initial pH
pH is the most important factor to examine because wastewater containing dyes removed at different pH. To obtained the performance of pH in the degradation process it was varied from acidic medium = 2 pH to basic medium = 10 pH. Comparative result for Toluidine blue (TB) and Azure-A (AA) dyes can be graphically represented in fig. 8. From the pH variation results, it was observed that the initial pH of the solution performs a significant role in controlling the removal of toxic dyes. The reaction mixture shows the highest degradation at 4 pH for Toluidine blue and 9 pH for Azure-A. From the experiments, it was found that dyes undergo in their protonated form at low pH. In the protonated condition dye molecules repulse from the surface of Cadmium Bismuth Iodide. Due to this at low pH value, the rate of degradation becomes slow. Once a corresponding value obtained if pH increases it will decrease the rate of the degradation process. At higher pH, due to the absorption of OH– ions on the semiconductor surface, the el– rich dye molecules will electrostatically be repelled to each other and the rate will be decreased.
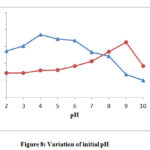 |
Figure 8: Variation of initial pH |
Variation of Azure-A and Toluidine Blue Dyes Concentration
The concentration of dyes is examined from 3.0 x 10⁻⁵ to 7.0 x 10⁻⁵ M for Toluidine blue whereas for Azure-A it has differed from 5.5 x 10⁻⁵ to 8.5 x 10⁻⁵ From the experiments, it was noticed that the degradation appeared to enhance on increasing the number of dye molecules. As the molality of TB and AA was increased there were more dye particles which were accessible for excitation and consecutive energy transference. The rate of photodecomposition appears to get down with furthermore increase in the molality of AA and TB dyes, beyond a specific concentration. Particles of TB and AA dyes now act as an internal filter itself due to this the molecules will not allow light radiation to reach the upper surface of the catalyst. Thus, the rate of degradation of AA and TB was decreasing after its optimum limits that are 5.0 x 10⁻⁵ M for TB and 7.0 x 10⁻⁵ M for AA.
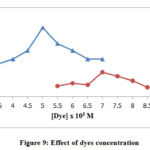 |
Figure 9: Effect of dyes concentration |
Effect of Catalyst Dose
The experiments were performed by differing amounts of Cadmium Bismuth Iodide from 0.06 to 0.24 g. Maximum degradation is observed at 0.20 g for TB and 0.18 g for AA. After this optimum amount of catalyst, the rate of degradation starts decreasing. After the corresponding limit further adding the more catalyst will not increase the degradation rate of both dyes according to fig 10. This is because of the aggregation of catalyst particles, which detract the interfacial area between the reaction solution and photocatalyst. The increase in opaqueness and light expanding by particles may be a different reason for the degradation rate.
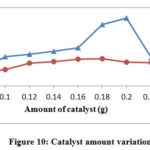 |
Figure 10: Catalyst amount variation |
Variation of Light Intensity
Various experiments for light intensity results were performed. Different conditions were obtained by changing the length between the source and reaction mixture. The results are graphically represented in Fig.11.The results indicate the photocatalytic degradation of TB and AA was enhancing with the increase in the exposure intensity. If illumination increases it provides more and more photons that will strike on the semiconductor surface. It was noticed that little change occurs in the degradation rate when the intensity of light was raise beyond its optimum value (70.0 mW cm−2).
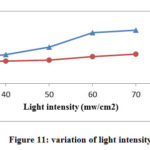 |
Figure 11: variation of light intensity |
Mechanism
Electrons of Cadmium Bismuth Iodide is excited to its conduction band from the valance band on visible light irradiation. The migration of the electron generates a positive hole (h+) in the valance band which extracts an electron from –OH to generate •OH free radical. Hydroxyl radical may act as an active oxidizing species which then oxidize the dye to its leuco form, which subsequently decompose the dye into a less toxic substance. With the help of isopropyl alcohol (hydroxyl radical scavenger) confirming the role of hydroxyl radical as an active oxidizing species. Here, a significant reduction in the rate of decomposition that is 70% was proved that the dye was degrading by the hydroxyl radical. The tentative mechanism is as follow-
(1) 1Dye0 (AA and TB) → 1Dye1 (AA and TB)
(2) 1Dye1 (AA and TB) → 3Dye1 (AA and TB)
(3) CdBiI5→ CdBiI5 [e− (CB) + h+ (VB)]
h+ + −OH → •OH
H2O + h+ → H+ + •OH
(4) Dye (AA and TB) + OH → Leuco (AA and TB)
Leuco Dye (AA and TB) → Products
Recyclization
For heterogeneous photocatalyst, recyclability is an important aspect. The simplicity of recovery and stability of photocatalyst in terms of competence over the number of cycles are always high. If the capacity of any semiconductor remains the same then it should not reduce with every set of experiment and then it could be used in multiple cycles for the degradation process. Here, Cadmium bismuth iodide could be significantly reused 3 times without lose its efficiency.
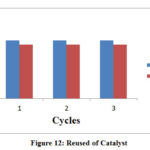 |
Figure 12: Reused of Catalyst |
Cadmium Bismuth Iodide photocatalyst has been made up of reaction of CdI2 and BiI3 in solid-state reaction. The optical property of Cadmium Bismuth Iodide was studied by Diffuse reflectance spectra and it was observed that the product can act in the visible range. It shows significance degradation for Toluidine blue as well as for Azure – A. Favorable condition for Toluidine blue were pH= 4, [TB] = 5.0 x 10⁻⁵ M, Cadmium Bismuth Iodide amount = 0.20 g, light intensity = 70mw/cm2. For Azure –A pH= 9, [AA] = 7.0 x 10⁻⁵ M, Cadmium Bismuth Iodide amount = 0.18 g, light intensity = 70mw/cm2. This photocatalyst further reused in the recycle of dye degradation without any significant loss in its activity.
Conflict of Interest
The authors declare that there are no affiliations with or involvement in any organization or entity with any financial interest or non-financial interest in the subject matter or materials discussed in this manuscript.
Acknowledgments
We are greatly thankful to the staff members of the department of chemistry, Government Meera Girls, College, Udaipur for their cooperation in research work.
References
- Lee, S.Y.; Park, S.J.; J. Ind. Eng. Chem. 2013, 19, 1761-1769.
- Wei, T.; Gao S.; Wang, Q.; Xu H.; J. Nanopart. Res.2017, 19, 1-13.
- Chakrabarti, S.; Dutta, B.K.; J. Hazard. Mater. B 2004, 112, 269-278.
- Khan, M.M.; Adil, S.F.; Al-Mayouf, A.; .J Saudi. Chem. Soc. 2015, 19, 462-464.
- Oturan, M.A.; Aron, A.A.; Crit. Rev. Env. Sci. Technol. 2014, 44, 2577-2641.
- Robertson, P.K.J.; Bahnemann D.W.; J. Hazard. Mater. 2012, 211-212, 161-171.
- Hermann, J.M.; Catal. Today 1999, 53, 115-129.
- Riaz, U.; Asharf. S. M.; Kashyap, J.; Mate.r Res. Bull. 2015, 71, 75-90.
- Lu, F.; Astruc, D.; Coord. Chem. Rev. 2018, 356, 147-164.
- 10.Raghu, M.S.; Kumar, K.Y.; Rao, S.; Aravind, T.; Sharma, S,C.; Prashant, M.K.; Phy. B: Condensed Matter 2018, 537, 336-345.
- 11.Gallon, B.J.; Kojima, R.W.; Kaner, R.B.; Diaconescu, P.L.; Angewanate chemie. 2007, 46, 7251-7254.
- Albertini, F.; Ribeiro, T.; Alvas, S.; Baleizao, C.; Farinha, J.P.S.; Mater. Des.2018, 141, 407-413.
- Ghanbari, M.; Gholamrezaei, S.; Niasari, M.S.; Abbasi, A.; J. Mate.r Sci: Mater. Electron. 2017, 28, 6272–6277.
- Yahia, I.s.; Shapaan, M.; Ismail, Y.A.M.; Aboraia, A.M.; Shaabaan, E.R.; J. Alloy.Comp. 2015, 636, 317-322.
- Kabirinia, F.; Mohammadreza, S.; Tabrizi, N.S.; Powder Technol. 2019, 346, 283-290.
Accepted on: 19-Mar-2020


![]()


