Catalytic Application of Electrochemically Prepared Nickel Oxide Nanoparticles to Synthesize 2, 5–Disubstituted-1, 3, 4–Oxadiazoles
Manisha R. Sawant1* , Suresh T. Gaikwad2,Sushama B. Dare1and Anjali S. Rajbhoj2
1Department of Chemistry, New Arts, Commerce and Science College, Ahmednagar (MS), India.
2Department of Chemistry, Babasaheb Ambedkar Marathwada University, Aurangabad (MS), India
3Faculty of Chemistry, Ho Chi Minh City University of Education, Ho Chi Minh City, Vietnam
DOI : http://dx.doi.org/10.13005/ojc/360213
Article Received on : 28 Mar 2020
Article Accepted on : 29 Mar 2020
Article Published : 20 Apr 2020
The present work aims to synthesize 2,5–disubstituted-1,3,4–oxadiazoles using electrochemically prepared nanoparticles of nickel oxide as catalyst. The nanoparticles thus prepared using electrochemical syntheses are in appreciable yield. The tetrabutyl phosphonium bromide has been used for capping followed by UV, FTIR, XRD, SEM EDS and TEM SAED studies for the characterization. The 2,5-disubstituted-1,3,4-oxadiazoles were synthesized from substituted benzoic acids and their hydrazides in microwave synthesis system using prepared nanoparticles as a catalyst.
KEYWORDS:Electrochemical Synthesis; 2, 5–Disubstituted-1, 3, 4-Oxadiazoles; Nickel Oxide Nanoparticles; Tetrabutyl Phosphonium Bromide
Download this article as:| Copy the following to cite this article: Sawant M. R, Suresh T. Gaikwad2, Sushama B. Dare1 and Rajbhoj A. S. Catalytic Application of Electrochemically Prepared Nickel Oxide Nanoparticles to Synthesize 2, 5–Disubstituted-1, 3, 4–Oxadiazoles. Orient J Chem 2020;36(2). |
| Copy the following to cite this URL: Sawant M. R, Suresh T. Gaikwad2, Sushama B. Dare1 and Rajbhoj A. S. Catalytic Application of Electrochemically Prepared Nickel Oxide Nanoparticles to Synthesize 2, 5–Disubstituted-1, 3, 4–Oxadiazoles. Orient J Chem 2020;36(2). Available from: https://bit.ly/3eAJvWD |
Introduction
The use of 1,3,4-oxadiazole and its derivatives in agrochemicals, dyes, pharmaceuticals, corrosion inhibition and photographic materials1,2 have increased attention of researchers towards itself. It shows variety of biological activities like antimicrobial3, antimalarial4, anticancer5, anticonvulsant6, antiinflammatory7, antihepatitis B8, anti-HIV-19, sedative, hypnotic10, and insecticidal11.
As per literature 1,3,4-oxadiazoles can be synthesized by various methods involving multistep reactions12-14. Generally the synthesis can be achieved by cyclization reaction of diacylhydrazides using phosphorous oxychloride, sulfuric acid or thionyl chloride and critical conditions of reaction15. The most commonly phosphorus oxychloride16, trifluoroacetic anhydride17, thionyl chloride18, polyphosphoric acid19 are used as dehydrants for the synthesis of these compounds. However, the more reaction time and low yield are the disadvantages of the conventional synthetic routs. The use of microwave irradiation in chemical reaction has been proved improvement in reaction rates and increased yields20-22.
The literature reports various methods to prepare nanoparticles of nickel oxide like ultrasonic spray pyrolysis23, liquid-control-precipitation24, electrodeposition25, chemical vapor deposition26, the sol–gel route27, reduction of metallic salts followed by oxidation of metallic species28and microemuslion29.
The material science, inorganic and organic chemistry, physics, molecular biology and medicine are the areas where use of nanoparticles is increased unexpectedly. The morphology and particle size distribution are improved in nano sized than the bulk material. The exclusive properties like surface to volume ratio, specific surface area and surface reactivity are responsible for the development of interest to use them in different fields including nutrition, medicine and energy30. The noble metal like platinum, silver and gold are being used to prepare nanoparticles due to their beneficial effects on the health. These are popularly known as metallic nanoparticles31. Recently metallic nanoparticles are receiving more focus of research community because of their use as catalyst32, in the preparation of polymer33, diagnosis of disease and treatment34, technology involved in sensors35 and optoelectronic recorded media labeling36. The metallic nanoparticles are prepared and stabilized by various chemical and physical methods that include photochemical reduction, chemical reduction and electrochemical changes. The physicochemical properties and morphology that is size and structure of the prepared nanoparticles is governed by the method selected for the preparation of it. During its synthesis various processes like adsorption of stabilizing agent, interaction kinetics of reducing agent with metal and also any technique used in experiment shows such influence on the properties of nanoparticles. The metal particles used in the preparation of many drugs, cosmetics and detergents are coming in contact with the human directly. Gold is most widely used metal in medicine for drug delivery and diagnostic purpose. Silver is also known for its inflammatory and antimicrobial property and its nanoparticles are used in biomedical applications, novel drug delivery system and separation science. These are also useful for better healing of wound, to prepare dressings for wound, coating of medical implant and various pharmaceutical dosage forms. The nanoparticles of platinum are also tested for their benefits related to health. They either in pure form or alloyed with other metal or combined with other metal nanoparticles shows beneficial effects on health. Likewise its preparation and use in medicine and allied fields is increasing continuously.
Herein, nanoparticles of nickel oxide are prepared by electrochemical reduction method and ultraviolet (UV), Fourier transform infra red (FTIR), X ray diffraction (XRD), scanning electron microscopy-energy dispersive spectroscopy (SEM-SDS) and transmission electron microscopy – selected area electron diffraction (TEM-SAED) studies are used to study their particle size and size distribution. The 2,5-disubstituted-1,3,4-oxadiazoles were synthesized from substituted benzoic acids and their hydrazides in microwave synthesis system using prepared nanoparticles as a catalyst.
Materials and Methods
Electrochemical Synthesis of Nickel Oxide Nanoparticles
The electrolysis cell with capacity of 20-50 ml, two sheets of nickel and platinum pure metal in the size of 1 x 1cm are used for the preparation of nanoparticles of nickel oxide by electrochemical reduction method. In the aqueous solution of 0.01N tetrabutyl phosphonium bromide (TBPB) both the electrodes were immersed. TBPB serves as supporting electrolyte along with stabilizing agent which prevents further growth of nanoparticles. In the process of preparation the nickel metal from the bulk gets oxidized to nickel ion that gets reduced on to inert cathode where nanoparticles of nickel are formed at the interface of electrolyte solution and the surface of cathode. The electrolysis was carried out for the period of 2 hrs with altering current density as 5, 10, 15 and 20 mA/cm2. The change in color of solution is observed to light green and whitish green precipitate was obtained. The electrolysis was continued for 2 hrs and then stopped. The resultant mixture transferred to bottle, allowed to settle solid particles, separated settled solid particle by decantation and washed with water for four times to ensure removal of unreacted TBPB .
Characterization of Nickel Oxide Nanoparticles
The characterization of nickel oxide nanoparticles was done using UV-visible spectrophotometer, FTIR, high end X-ray diffractometer, SEM-EDS and TEM-SAED techniques.
Synthesis of 2,5-Disubstituted-1,3,4-Oxadiazoles37
The substituted benzoic acid (1 mmol), hydrazides of substituted benzoic acid (1 mmol), substituted benzoic acid (1 mmol), nickel oxide nanaporticles (14 mg) and a drop of phosphorous oxychloride was irradiated with microwave radiations at 300 W using CEM discovery microwave synthesis system. The progress of reaction was monitored using thin layer chromatography (benzene ethyl acetate as mobile phase). The total period of microwave irradiation varies from reaction to reaction. Ethyl acetate was added to the reaction mixture and resultant solution was filtered to separate catalyst. The ethyl acetate layer was washed with water and dried using anhydrous sodium sulphate. The solid compound left behind after evaporation of organic solvent was crystallized from methanol to obtain title compounds in pure form with appreciable yields followed by FTIR and proton NMR analysis for confirmation of their structure.
Results and Discussion
Electrochemical Synthesis
The TBPB is used as a capping agent for the preparation of nickel oxide nanoparticles by electrochemical method with appreciable yields. The plans in the nanocrystals are selectively bound by the use of organic surface ligands called capping agents. The TBPB is a surface active agent which prevents aggregation and the flocculation of the particles. The surface active agents are involved in capping the surface of nanoparticles and in turn decide its morphology through control on the growth rate. The attachment rate of surface active agent on the nanoparticle surface along with diffusion controls the growth rate of nanoparticles. Growth of the particle size is checked by UV-visible spectral analysis after 15 min. of electrolysis.
UV-Visible Spectral Analysis
Optical properties of a solution of nanoparticles are determined by UV-visible absorbance spectroscopy. The amount of light absorbed is measured by passing the ray of light through the solution of sample. Recording of absorbance is done at different wavelengths by changing it. The particle concentration in the solution is measured from the absorbance by using Beer-Lamberts law. The medium in which nanoparticles are suspended and its size affect the surface plasmon resonance energy. If particle size is increased the red shift is observed. The decrease in intensity of transmitted light is observed due to absorption by small and scattering by large particles. Absorption maxima of suspended nanoparticles were found in the ultraviolet region by scanning the said suspension in double beam UV-visible spectrophotometer. Hence 200 to 400 nm range is selected for the scanning. The UV spectrum of nickel oxide nanoparticles capped with TBPB in water at 5mA/cm2 and 10 mA/cm2 are depicted in Fig. 1 and 2. With increase in current density while synthesizing nanoparticles of nickel oxide observes blue shift. Similarly it has been observed that at 15 min the absorbance is higher as compare to 2 hrs electrolysis which indicates that particle size is smaller at 15 min of electrolysis than that of 2 hrs.
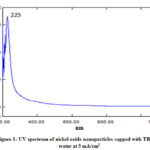 |
Figure 1: UV spectrum of nickel oxide nanoparticles |
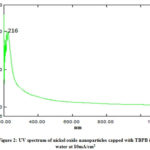 |
Figure 2: UV spectrum of nickel oxide nanoparticles |
FT-IR studies
Sometimes organic material remains bound on the surface of nanoparticles. It is needed to identify its presence in order to know the kind of processes happening on the nanoparticle surface. The typical functional groups shows absorption peak at particular wave number when exposed to IR radiation. If any infrared active moiety is present on the surface of nanoparticles FT-IR studies helps in its identification. The electrochemically prepared nickel oxide nanoparticles with the help of capping agent like tetrabutyl phosphonium bromide were analyzed for their capping efficiency of ligand by means of FTIR spectroscopy. The FTIR spectra of as prepared nickel oxide nanoparticles using tetrabutyl phosphonium bromide (Fig. 3) shows peaks at 2970, 2864, 2832, 3462 and 3111 cm-1 indicating C – H stretching vibrations, 2440, 2331cm-1 P – H stretching vibrations and 1450 – 1280 cm-1 P – C stretching and C – H bending vibrations. It reveals the presence of tetrabutyl phosphonium bromide at the surface of the said nanomaterial. The peaks observed at 3640 and 3483 cm-1 indicates presence of water due to hygroscopic nature of the ligand. After calcinations at 500°C in muffle furnace peaks corresponding to ligand are disappeared or became weak (Fig. 4) indicating removal of ligand in calcination process. The broad band at 661 cm-1 indicates presence of Ni – O bond.
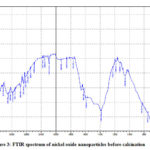 |
Figure 3: FTIR spectrum of nickel oxide nanoparticles before calcination |
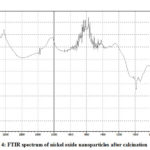 |
Figure 4: FTIR spectrum of nickel oxide nanoparticles after calcination |
XRD studies The crystallographic structure and morphology of the nanoparticles can be determined by one of the conventional techniques namely X-ray diffraction studies. The amount of component present alters the intensities. XRD analysis provides knowledge regarding shape as well as size of nonmaterial along with distribution of various sized particles in it. The XRD studies of the prepared nickel oxide nanoparticles were carried out to know the extra phases of the element and the particle size. The XRD pattern of prepared nickel oxide nanoparticles were obtained after calcination at 500oC for the period of 2 hrs (Fig. 5). The diffraction peaks observed reveals the hexagonal system of Ni2O3 nanoparticles. The four characteristic peaks having lattice parameter a = 4.61 and c = 5.61 with 2θ = 39.515, 53.049, 60.232 and 63.755 corresponding to Miller indices of (102), (112), (202), (004) were observed which exactly match with the JCPDS no 14-0481 of Ni2O3. The average particle is calculated with the help of Debye-Scherrer’s equation which states that D = kλ / βcosθ, where k indicates shape constant, λ means wavelength, θ for diffraction angle and β demonstrate full width half maxima. The above analysis reveals average particle size of 4.38 nm.
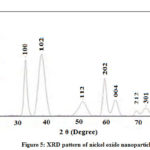 |
Figure 5: XRD pattern of nickel oxide nanoparticles |
SEM EDS studies
The SEM studies are carried out to find morphological properties of nanoparticles by directly visualizing it. This technique involves electron microscopy because of that many advantages are being offered with respect to analysis of morphology and size. It has limitation of providing little information in respect of distribution of size and average population of particles. In scanning electron microscopy solution of nanoparticles is converted into dry form to mound on sample holder and coated with conductive metal like gold. The mounded nanoparticles are subjected for scanning by a fine electron beam in SEM. The sample surface emits secondary beam of electrons which is helpful for characterization of the surface of nanoparticles. The technique provides information about the particle size that is at far with dynamic light scattering technique. The scanning electron microscopy and particle size distribution of prepared nanoparticle of nickel oxide were obtained at various resolutions. Obtained SEM image (Fig. 6) shows morphological features of nickel oxide nanoparticles. It shows the prepared nanoparticles are uniform, regular and non-spherically shaped. It also reveals that particles are aggregated and resulted into crystalline material in nano size. It is being observed that calcinations results in increased crystal particles size.
The qualitative and quantitative analysis of nanoparticles of nickel oxide is performed using EDS (Fig. 7 and 8). The EDS spectrum shows nickel and oxygen elements are present in the said nanoparticles. The composition of both elements is shown in Table – 1. The small peaks in the EDS spectrum may be attributed by surface capping agent who is not removed completely from the sample.
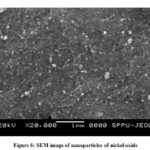 |
Figure 6: SEM image of nanoparticles of nickel oxide |
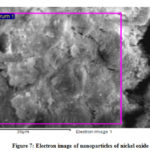 |
Figure 7: Electron image of nanoparticles of nickel oxide |
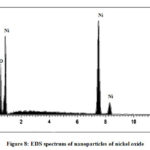 |
Figure 8: EDS spectrum of nanoparticles of nickel oxide |
Table 1: EDS data of nickel oxide nanoparticles
|
Element |
Weight percentage |
Atomic percentage |
|
O k |
50.00 |
85.53 |
|
Ni k |
31.04 |
14.47 |
|
Total |
81.04 |
|
TEM – SAED Studies
The transmission electron microscope offers similar kind of information as that of SEM but operates on differ principle. The ultra thin same is required in the TEM analysis so preparation of sample is bit hard and needs more time. The support film is used on to which nanoparticles are deposited with the help of negative staining material like uranyl acetate or derivatives of phosphotungstic acid that provides sufficient strength to tolerate vacuum of instrument. Plastic embedding is also used for sample preparation. Sometimes sample is embedded in vitreous ice and exposed to liquid nitrogen. The electron beam transmits through prepared ultra thin film of nanoparticles that offers surface properties of the material due to its interaction with material while passing through. TEM yields information about morphology, size and size distribution of nanoparticles. It is the only method in which observation and measurement of individual particle is carried out directly. The size is calculated and expressed in terms of sphere diameter having similar projected image of particle. Different shades in the Fig. 9 are the result of different densities shown by TEM images. The TEM image shows the particle size of 12.13, 13.41, 13.38, 13.41, 15.01, 16.16, 20.00 and 21.44 nm with average of 15.61 nm. Most of the particles are observed to be with size of 12-13 nm which is in well agreement with XRD analysis. The image shows random distribution of metal nano particle aggregates. The electron diffraction pattern of selected area of nano particle is being depicted in the Fig. 10 verifies crystalline nature due to absence of diffused hals normally associated with the presence of amorphous phases.
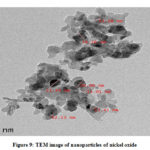 |
Figure 9: TEM image of nanoparticles of nickel oxide |
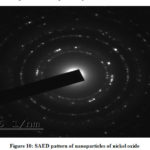 |
Figure 10: SAED pattern of nanoparticles of nickel oxide |
Synthesis of 2,5-Disubstituted-1,3,4-Oxadiazoles
The title compounds have been synthesized as per the reaction shown in Scheme 1. Thin layer chromatography is used to monitor reaction progress. The melting point of the title compounds have been recorded and compared with reported data37 as shown in Table – 2. The IR and proton NMR studies were performed to confirm structure of the compounds. The characteristic IR stretching bands are observed and shown in Table 3. The proton NMR data of representative compounds is being depicted in Table 4.
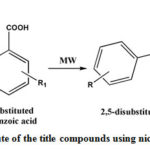 |
Scheme 1: Synthetic route of the title compounds using nickel oxide nanoparticles |
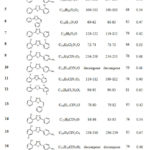 |
Table 2: Physicochemical data of the title compounds |
Table 3: Infrared spectral data of the title compounds
|
Compound |
IR Value (cm-1) |
|
1 |
2919.7 (C–H), 1688.37 (C=N), 1544.63 (C=C),1177.47 (C–O) |
|
2 |
2960.2 (C–H), 1689.34 (C=N), 1545.67 (C=C), 1263.15 (C–O), 759.81 (C-Cl) |
|
3 |
2855.1 (C–H), 1688.37 (C=N), 1582.31 (C=C), 1581 (NO2), 1108(C–O) |
|
4 |
3314.07 (N-H), 1491.67 (C=C), 1179.26 (C–O) |
|
5 |
3332.39 (C–H), 2936.09 (O-H), 1557.24 (C=C), 124O (C–O) |
|
6 |
3062.41 (C–H), 1688.37 (C=N), 1546.63 (C=C), 1220.72 (C–O) |
|
7 |
3068.19 (C–H), 1653.67 (C=N), 1551.45 (C=C), 1263.15 (C–O) |
|
8 |
3056.62 (C–H), 1689.34 (C=N), 15831592.91 (C=C), 1167.69 (C–O), 772.35 (C-Cl) |
|
9 |
3056.62 (C–H), 1695.12 (C=N), 1599.66 (C=C),1533.13 (N=O),1113.69 (C–O), 754.03 (C-Cl) |
|
10 |
3068.19 (C–H), 1653.67 (C=N), 1593.88 (C=C), 1185.04 (C–O), 741.49 (C-Cl) |
|
11 |
2975.62 (C–H), 1599.66 (C=C), 1194.69 (C–O), 765.60 (C-Cl) |
|
12 |
3091.33 (C–H), 1582.31 (C=C), 1233.25 (C–O), 765.60 (C-Cl) |
|
13 |
1694.16 (C=N), 1226.5 (C–O), 765.6 (C-Cl) |
|
14 |
3055.66 (C–H), 1688.37 (C=N), 1593.88 (C=C), 1256.4 (C–O), |
|
15 |
3103.87 (C–H), 1521.56 (C=C), 1269.9 (C–O), 754.03 (C-Cl) |
|
16 |
3392.17 (C–H), 1599.66 (C=C), 1173.47 (C–O) |
|
17 |
3073.98 (C–H), 1546.63 (C=C), 1244.83 (C–O), 747.28 (C-Cl) |
|
18 |
1682.59 (C=N),1540.85 (C=C), 1220.72 (C–O), 758.85 (C-Cl) |
|
19 |
3056.62 (C–H), 1641.13 (C=N), 1515.78 (C=C),1137.8 (C–O), 754.03 (C-Cl) |
|
20 |
1599.66 (C=C), 1286.29 (C–O), 812.84 (C-Cl) |
Table 4: NMR spectral data of representative compounds
|
Compound |
Chemical shift (δ ppm) |
|
1 |
7.453-8.226 (m, Ar-CH, 10H) |
|
8 |
7.361-7.877 (m, Ar-CH, 8H) |
|
10 |
3.915 (s, Ar-NH2, 2H); 7.34862 – 8.356 (m, Ar-CH, 8H) |
Conclusion
The tetrabutyl phosphonium bromide could be better choice as a capping agent to prepare electrochemically nanoparticles of nickel oxide in appriciable yields. As prepared nickel oxide nanoparticles heated at 500oC to remove capping agent and removal is confirmed by FTIR studies. The characterization techiques confirmed the properties of nanoparticles like shape, size and size distribution. The calcinated nickel oxide nanoparticles were used sucessfully as a catalyst to synthesize 2,5-disubstituted-1,3,4-oxadiazoles using starting material substituted benzoic acids and their hydrazides in microwave synthesis system.
Acknowledgements
Authors acknowledge the support of Department of Physics, Savitribai Phule Pune University, Pune for SEM, XRD and NMR analysis and SAIF Cochin for TEM – SAED studies.
Conflict of Interest
Nil
References
- Sun, J.; Makawana, J. A.; Zhu, H. L. Rev. Med. Chem. 2013, 13, 1725–1743.
- Khalilullah, H. J.; Ahsan, M.; Hedaitullah, M.; Khan, S.; Ahmed, B. Rev. Med. Chem. 2012, 12, 789–801.
- Sahin, G.; Palaska, E.; Ekizoglu, M.; Ozalp, M. 2002, 57, 539–542.
- Zareef, M.; Iqbal, R.; Dominguez, N. G.; Rodrigues, J.; Zaidi, J. H.; Arfan, M.; Supuran, C. T. Enzyme. Inhib. Med. Chem. 2007, 22, 301–308.
- Khalil, N. A.; Kamal, A. M.; Emam, S. H. Biol. Pharm. Bull. 2015, 38, 763–773.
- Zarghi, A.; Tabatabai, S. A.; Faizi, M.; Ahadian, A.; Navabi, P.; Zanganeh, V.; Shafiee, A. Med. Chem. Lett. 2005, 15, 1863–1865.
- Arvind, K. S.; Lohani, M.; Parthsarthya, R. J. Pharm. Res.2013, 12, 319–323
- El-Essawy, F. A.; El-Sayed, W. A.; El-Kafrawy; S. A., Morshedy, A. S.; Abdel-Rahman, A. H. Naturforsch. C. 2008, 63, 667–674.
- El-Sayed, W. A.; El-Essawy, F. A.; Ali, O. M.; Nasr, B. S.; Abdalla, M. M.; Abdel-Rahman, A. A. Naturforsch. C. 2009, 64, 773–778.
- Tabatabai, S. A.; RezaeeZ. E.; Reyhanfard, H.; Alinezhad, B.; Shafaghi, B.; Sheikhha, M.; Shafiee, A.; Faizi, M. J. Pharm. Res. 2015, 14, 51–57.
- Guo, Y.; Qu, L.; Wang, X.; Huang, M.; Jia, L.; Zhang, Y. RSC Adv. 2016, 6, 93505–93510.
- Chen, Q.; Zhu, X. L.; Jiang, L. L.;Liu, Z.-M.; Yang, G.F. J. Med. Chem. 2008, 43, 595–603.
- Amir, M.; Shikha, K. J. Med. Chem. 2004, 3, 535–545.
- Baxendale, I. R.; Ley, S. V.; Martinelli, M. Tetrahedron. 2005, 61, 5323–5349.
- Coppo, F. T., Evans, K. A., Graybill, T. L., & Burton, G. Tetrahedron Lett.2004, 45, 3257–3260.
- Vansdadia, R. N.; Roda, K. P.; Parekh, H. J. Indian Chem. Soc. 1988, 65, 809−811.
- Liras, S.; Allen, M. P.; Segelstein, B. E. Commun. 2000, 30, 437–443.
- Al-Talib, M.; Tashtoush, H.; Odeh, N. Commun. 1990, 20, 1811–1817.
- Wang, S.; Li, Z.; Hua, W. Commun. 2002, 32, 3339–3345.
- Polshettiwar, V.; Varma, R. S. Appl. Chem. 2008, 80, 777–790.
- Chauveau, E.; Marestin, C.; Schiets, F.; Mercier, R. Green Chem. 2010, 12, 1018–1022.
- Insuasty, B.; García, A.; Quiroga, J.; Abonia, R.; Nogueras, M.; Cobo. J, Eur. J. Med. Chem. 2010, 45, 2841–2846.
- Oh, S.W.; Bang, J.; Bae, Y. C.; Sun, Y. K. J. Power. Sources. 2007; 173, 502-509.
- Deng, X. Y.; Chen, Z. Lett. 2004; 58, 276-280.
- Fonseca, C. N.; Paoli, M. A.; Gorenstein, A. Mater. 1991, 3, 553-555.
- Umar, A.; Kim, B.K.; Kim, J. J.; Hahn, Y. B. Nanotechnol. 2007; 18, 175606–175612.
- Hayat, K.; Gondal, M. A.; Khaled, M. M.; Ahmed, S. Mol. Catal. A-Chem. 2011, 336, 64-71.
- Illy-Cherrey, S.; Tillement, O.; Dubois, J.M.; Massicot, F.; Fort, Y.; Ghanbaja, J.; Begin-Colin S. Sci. Eng. C. 2002; 338:70-75.
- Solanki, J. N.; Sengupta, R.; Murthy, Z.V. State. Sci. 2010, 12, 1560-1566.
- Jeevanandam, J.; Barhoum, A.; Chan, Y. S.; Dufresne,A.; Danquah, M. K. J Nanotechnol. 2018, 9, 1050-
- Khana, I.; Saeed, K.; Khan, I. J. Chem. 2019, 12, 908-931.
- Narayanan, R.; El-Sayed, M. A.Nano Letters. 2004, 4, 1343-1348.
- Moura, D.; Souza,M. T.; Liverani, L.; Rella,G.; Luz, G. M.; Mano, J. F.; Boccaccini, A. R. Sci. Eng. C. 2017, 76, 224-232.
- Lee, S. H.; Jun, B. H. J. Mol. Sci. 2019, 20, 1-23.
- Gomez-Romero, P. Mater. 2001, 13, 163-174.
- Gracias, D. 2002, 289, 1170-1172.
- Sawant, R. L.; Lanke, P. D. J. Drug. Des. Disc. 2010, 1, 336-344.

This work is licensed under a Creative Commons Attribution 4.0 International License.
![]()
A New Edition of Web of Science
Journal Impact Factor
2022: 0.5
Five Year: 0.8
Journal is Indexed in

Cabells Whitelist
![]()


