Ultrasound-Assisted Extraction of Phenolic, Flavonoid and Antioxidant Compounds from Dodonaea Viscose and Its Green Synthesis of Silver Nanoparticles by Aqueous Extract
Abdulaziz Ali Alomari
Department of Chemistry, Faculty of Science and Arts in Al-Mukhwah, Al-Baha University, Saudi Arabia.
Corresponding Author E-mail: abomaz1389@yahoo.com
DOI : http://dx.doi.org/10.13005/ojc/360124
Article Received on : 30 Jan 2020
Article Accepted on : 26 Feb 2020
Article Published : 26 Feb 2020
The Dodonaea viscose was commonly known plant in Al-mukhwah area (Al-baha city in Saudi Arabia) by exhibiting various therapeutic pharmacological properties owing to existence of divers polyphenols and flavonoids in its roots and seeds. Ultrasound-assisted extraction (UAE) was utilized to extract total phenolic and antioxidant compounds from Dodonaea viscose. The aim of this study is to inspect the solvent type effects, sonication time and dissipated power on the extraction of total phenolic compounds (TPC), total flavonoid compounds (TFC) and on the antioxidant capacity: 2,2′-azinobis-3-ethylbenzothiazoline-6 sulfonic acid (ABTS) and 2,2′-diphenyl-1-picrylhydrazyl (DPPH). The highest TPC was 176.63 mg. g-1 GAE of dry extract), whilst the total flavonoids equal 125.78 mg QE.g-1 of dry extract, the lower value IC50 of DPPH radical scavenging activity was 13.60 µg.g-1 of dry extract and under ABTS radical scavenging assay, IC50 was assessed as 3.58 µg.g-1 of dry extract. These results were observed for the sample extracted with pulsed ultrasound (40%) in Methanol at 15 min which indicated that the extracted compounds contribute to the activity of antioxidant. The natural products which are found in plants extracts, may be considered as a reducing agent as like a stabilizing agent in the formation of metal nanoparticles. Silver nanoparticles (Ag Nps) were synthesized by aqueous extract through a facile route. Characterizations of nanoparticles were evaluated by the use of UltraViolet-Visible spectroscopy (UV-Vis), Fourier Transform Infra-Red spectroscopy (FT-IR), and Transmission Electron Microscopy (TEM). Nanoparticles were found 30.20±19 (nm) by TEM analysis.
KEYWORDS:Dodonaea Viscose; Phenolic and Flavonoid Content; Antioxidant Activity; DPPH and ABTS; Ultrasound Mode, Solvent and Sonication Time Effect; Silver Nanoparticles.
Download this article as:| Copy the following to cite this article: Alomari A. A. Ultrasound-Assisted Extraction of Phenolic, Flavonoid and Antioxidant Compounds from Dodonaea Viscose and Its Green Synthesis of Silver Nanoparticles by Aqueous Extract. Orient J Chem 2020;36(1). |
| Copy the following to cite this URL: Alomari A. A. Ultrasound-Assisted Extraction of Phenolic, Flavonoid and Antioxidant Compounds from Dodonaea Viscose and Its Green Synthesis of Silver Nanoparticles by Aqueous Extract. Orient J Chem 2020;36(1). Available from: https://bit.ly/3a84YTE |
Introduction
Sonochemistry may be utilized in different food processing [1–3], conservation [4], removal of pesticides [5,6], extraction of different compounds [7], microencapsulated food [8], innovative foods [9], and preparation of ferrite nanoparticles [10]. The superior performance of ultrasound than conventional processes may be associated to the acoustic intensity. Its calculation methods are built on the heat [11–13]. The pulse period is the time during which the apparatus is on with a variable off period. A variable on time is offered by some instruments. Common pulse ratio is 1:1.
Pulsed ultrasound is preferred over continuous ultrasound in divers cases in which heat is contraindicated or in conditions where it is admit that the beneficial effects are produced by the mechanical activity of ultrasound [14-16].
Dodonaea viscose is plant pertinence to the Sapindaceae family. This family is exploited in conventional remedy for the healing of plural outside fungal infections [17]. The powder of D. viscose leavesutilized to decrease fever characteristics and advantageous for various epidermis disorder.
D. viscose is a frequent medicinal plant utilized in traditional treatment as remedy for fever and hurt in the joints. The plant extract has moderate effects versus most of themicroorganism [17].
The phenolic compounds can block the oxidation reactions by removed free radical transition states. Cell obtains advanced systems of antioxidants, nvertheless the adequate quantity of phenolic compounds or suppression of the antioxidant enzymes can conduct to oxidative compression [18].
Phenolic compounds are the essential antioxidant phytochemicals present in D. viscose [17]. Dodoneaa viscose phenolics displayed certain biological activities like antioxidant activity [19, 20], antiallergic and anti-inflammatory activities [21], antibacterial activity [22], hepatoprotective activity [23], nephroprotective activity [24] antiproliferative [25], chemopreventive and anticancer activities [26, 27].
The objective of this research was to analyze the effects of solvent type, sonication time and dissipated power on the extraction of TPC, TFC and on the Antioxidant Capacity: 2,2′-azinobis-3-ethylbenzothiazoline-6 sulfonic acid (ABTS) and 2,2′-diphenyl-1-picrylhydrazyl (DPPH).
Another vital part of this work was the green synthesis of silver nanoparticles. Flavonoids have been reported as the molecules which may contribute in biochemical pathways leading to the biosynthesis of noble metal nanoparticles [28-30]. Silver has been greatly used for its high antioxidant, antimicrobial, and catalytic properties.
This study investigates a simple and rapid route of Ag NPs preparation by aqueous extract of D. viscose.
Experimental
Plant Material
The leaves of D. viscose were gathered from the region of Al-mukhwah area in Mai 2018. Dried leaves of this plant sample were ground. In order to extract with a specific solvent (50 mL), 5g of the powder were placed in a thermostated vessel, which was stirred with a magnetic stir bar (150 rpm). Ultrasound was implemented at the top of the vessel.
Ultrasonic power level (three), evaluated in distilled water by the calorimetric method at 25 °C, were utilized corresponding to amplitude of 20, 30 and 40% [10,31] all under pulsed ultrasound (10s ON:10s OFF). After the process of sonication, the suspension gets down and cooled to room temperature and then filtered through Whatman filter paper to reject solid debris. At room temperature, the extract concentrated and dried to get the crude extracts.
The filtered extracts were utilized to determine the TPC, TFC, DPPH and ABTS radical-scavenging activity.
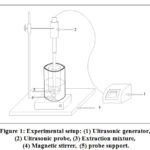 |
Figure 1: Experimental setup |
Experimental Design
In this current research paper, the objective of singular factor experiments were mainly used to find the optimum conditions for extracting antioxidant phenolic and flavonoids compounds from Dodonaea viscose. The four parameters such as extraction time (5, 10, 15min), ultrasound amplitude (20, 30 and 40%), ultrasound mode (Continuous and pulsed ultrasound) and extraction solvent (Ethyl acetate, methanol, chloroform) were explored on which one parameter was varied at a time while the other parameters were fixed.
Extraction Time
Dodonaea viscose samples were extracted using ethyl acetate and with pulsed ultrasound at amplitude of 20%. The pulse ratio was 1:1 mode with 10s On:10s Off. The time of extraction was varied from 5 to 15 min (5, 10 and 15 min).
Amplitude of Ultrasound
Using one of three solvents (Ethyl acetate) and for 15 min of extraction duration with pulsed ultrasound (10:10s) samples were extracted with different amplitudes used in this research (20, 30 and 40%).
Continuous and Pulse Ultrasound
Dodonaea viscose samples were extracted by ethyl acetate with two ultrasound modes: Continuous and pulsed (mode 1:1). The extraction time (15 min) and the ultrasound power (amplitude of 40%) were used.
Solvent Extraction
By setting the extraction time at 15 min with the ultrasound mode (pulsed ultrasound, 10:10seconds) at an amplitude of 40%, dodonaeaviscose samples were extracted by the use of a variety types of solvents: ethyl acetate, methanol and chloroform.
Total Phenolics
The TPC in D. viscose extracts was determined according to the Folin- Ciocalteu method [32]. Specimen’s solutions of the extracts in the concentration of 1 mg.mL-1 were utilized in the procedure. The reaction blend was obtained by mixing 0.5 mL of specimens solutions of extracts, 2.5 mL of 10% Folin-Ciocalteu’s reagent resolved in water and 2.5 mL 7.5% NaHCO3. Blank was simultaneously prepared, comprise 0.5 mL methanol, 2.5 mL 10% Folin-Ciocalteu’s reagent resolved in water and 2.5 mL of 7.5% of NaHCO3. The specimens were eventually brood in a thermostat at 30oC for 90 min. Spectrophotometer at λmax = 765 nm was used to measure the absorbance. Specimens were planned three times for each analysis and the average value of absorbance was acquired. The phenol concentrations in the test samples were evaluated from the calibration curve. TPC was referred to as mg Gallic Acid Equivalents. TPC was expressed as mg Gallic acid equivalents per gram sample extract.
Total Flavonoids
The total Flavonoid content was measured using aluminum chloride. Briefly, 0.5 mL aliquot of sample was blended with 1.5 mL of methanol, 0.1 mL of 1% AlCl3 and 0.1 mL of CH3COOK solution (1 M). Sample was added to 5 mL volumetric flask with distilled water (2.8 mL). The obtained solution was jolted and absorbance at 430 nm was registered after 30 minutes of incubation. A standard calibration curve was recorded at 430 nm using different concentrations of C15H10O7 (Quercetin). Total flavonoid content was calculated from the calibration curve as mg QE.g-1 of dry extract [33].
DPPH Radical Scavenging Assay
The DPPH is hydrogen atom transfer processes utilized for antioxidant screening in plant material. The free radical 1,1-diphenyl-2-picrylhydrazyl (DPPH), which have a dim magenta color, is reduced to the corresponding hydrazine (change of color pale red or yellowish red).
This method was performed occording to procedure by (Fenshyur et al., 2005) [34]. The solution was designed by resolving 1mg of the sample in 1mL of ethanol (98%). Seven solutions with 100, 50, 25, 12.5, 6.25, 3.125, 1.5625 μg /mL concentrations were reduced in ethanol. 0.9 mL Tris-HCL and 1mL of 0.1 mM DPPH in methanol solution were inserted and incubated at room temperature in the dark (60 min). The absorbance was recorded at 517 nm. The antioxidant activity was calculated using the following equation:

The “Inhibitory concentration” or IC50 value (the concentration of antioxidant that makes 50% reduction of the DPPH activity) was also used to assess the antioxidant activity of the plant extract matched to the caliber medicine. The greater the antioxidant activity, the smaller is the amount of IC50.
ABTS Radical Scavenging Assay
The antioxidant potential of D. viscose expressed as mg QE.g-1 of dry extract was estimated by the ABTS (2, 2’-azinobis-3-ethylbenzothiozoline-6-sulphonic acid) method. The solution was prepared by adding equal quantities of 7.4 mM ABTS solution and 2.6 mM K2S2O7 solution. The obtained solution allowed in the dark for 12 hours at room temperature and was diluted by blinding 1 mL ABTS solution with 60 mL methanol. The obtained absorbance was 0.8 at 734 nm using the spectrophotometer. Different concentrations of D.viscose extracts (200, 300 and 400 μg/mL) were permitted to react in a dark condition with 2.94 mL of the ABTS solution for 6 min. Scavenging ability relative to the reaction was calculated by using the equation Eq.1.
Green Synthesis of Ag NPs
A 10 g of dried leaves were powdered and soaked in deionized water (100 mL) and boiled for 15 min. A 30 mL solution of (0.01 M) AgNO3 was added to 6 mL of the aqueous extract of D. viscose leaves. Then the mixture was stirred at room temperature. The solution color passed light yellow after 20 min and gradually a dark brown color appeared which confirmed the Ag NPs formation. The NP deposits were collected after centrifuge the mixture. The de-ionized water was used to wash the Ag Nps. Lastly, synthesized silver nanoparticles were dried at room temperature (24 hours) and kept for further evaluations.
Results and Discussion
Dissipated Power
The calorimetric method is used to determine the dissipated power. In this research, a temperature probe has been used. The dissipated power, Pdiss, was estimated by using the following equation:

Where m the solution mass and CP the specific heat of water. Measurement of dissipated acoustic power in the reactor was recorded for three amplitudes 20, 30 and 40% [31]. The dissipted power Pdiss is 25.85 Watt under pulsed ultrasound (The pulse mode is 1:1 with 10/10s). The dissipated power at the same amplitude with continuous mode is 46.27 Watt.
Table 1: Results of dissipated power measurement (P-US: Pulsed ultrasound; C-US: Continuous ultrasound).
|
Amplitude |
Dissipated power: Pdiss (W) |
|
P-US-20% |
12.14 |
|
P-US-30% |
18.62 |
|
P-US-40% |
23.45 |
|
C-US-40% |
40.36 |
Extraction Time
The time of extraction is crucial in economizing energy. The extraction efficiency is immensely influenced by the interaction time between solute and solvent. In this research we used 5, 10 and 15 min as extraction time.
The variation effect of time (5 to 15 min) on the extraction of TPC, TFC and antioxidant activity of D. viscose was explored. Findings showed that TPC vary significantly. From 5 to 15 min the TPC increased to achieve 93.64 mg GAE.g-1 Extract (Figure 2).
The obtained results are in accordance with those of Mokrani et al. [35] and Falleh et al. [36], which noted that the phenolic content of compounds extracted by Ultrasound increases as a function of time.
As can be noted from figure 2, the TFC increased gradually when the extraction time increased from 5 to 15 min. This duration allowed extraction of 106.35 mg EQ.g-1 Extract. It was observed that the effect of time on TFC is similar to that on TPC.
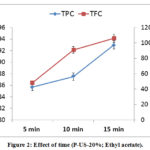 |
Figure 2: Effect of time (P-US-20%; Ethyl acetate). |
Figure 3 shows that that the yield of DPPH and ABTS decreased when the time of extraction increase. The IC50 value is the quantity of antioxidant needed to decrease the initial DPPH and ABTS concentration by 50%. The goodness of the antioxidants in the plant material was determined by these values (low values of IC50). Best results of antioxidants were revealed at 15 min as extraction time; the IC50 (DPPH) equal 19.52 µg.g-1 extract and IC50 (ABTS) equal 5.64 µg.g-1 extract.
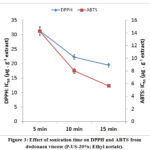 |
Figure 3: Effect of sonication time on DPPH and ABTS from dodonaea viscose (P-US-20%; Ethyl acetate). |
Amplitude of Ultrasound
Phenolic and flavonoid compounds were extracted using different ultrasound powers. The results showed that used powers were able to extract phenolics and flavonoids. The TPC was determined as 93.64, 97.07 and 106.34 mg GAE.g-1 Extract for 20, 30 and 40% as ultrasound amplitude (figure 4). Figure 4 shows that that the yield of TPC increased gradually when the ultrasound power increase. The TFC was determined as 106.35, 111.21 and 115.01 mg EQ.g-1 Extract (figure 4). These results confirmed a significant influence of ultrasound amplitude on the content of extracted phenolic and flavonoids compounds. This is consistent with previous findings from Z. Pan et al. (2012) [37].
The effect of amplitude (20 to 40%) on the DPPH and ABTS was investigated. Results showed that the extract ofD. viscose at 40% of amplitude exhibited the lowest DPPH and ABTS, as depicted by high IC50 values (figure 5).The results showed that high intensity level (high amplitude) with pulsed ultrasound significantly benefited the antioxidant.
A positive correlation between the DPPH, ABTS yields and ultrasound Amplitude was observed. This is consistent with previous findings from Helena et al. [38].
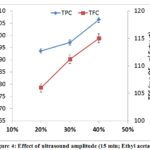 |
Figure 4: Effect of ultrasound amplitude (15 min; Ethyl acetate). |
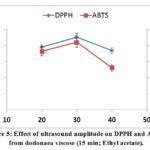 |
Figure 5: Effect of ultrasound amplitude on DPPH and ABTS from dodonaea viscose (15 min; Ethyl acetate). |
Continuous and Pulse Ultrasound
The results reveal that all ultrasound modes were able to extract phenolics and flavonoids. The highest yield of TPC and TFC was registered for pulsed ultrasound mode (106.35 mg GAE.g-1 Extract and 115.01 mg EQ.g-1 Extract), which represents the important result in this study (using pulsed ultrasound). It was observed that the effect of ultrasound mode on TPC is similar to that on TFC.
Best results of antioxidants were obtained with pulsed mode; the IC50 (DPPH) equal 18.41 µg.g-1 extract and IC50 (ABTS) equal 4.61 µg.g-1 extract. These results confirm the significance of using the pulsed ultrasound mode compared to continuous mode. A similar trend was observed in the study of DPPH and ABTS.
The use of pulsed ultrasound to obtain phenolic and flavonoids may be considered as an applicable technology in sustainable chemistry, which decreases the use of substances, solvents, and makes less the consumption of energy.
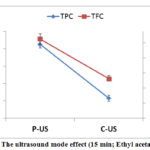 |
Figure 6: The ultrasound mode effect (15 min; Ethyl acetate; 40%). |
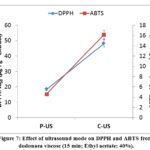 |
Figure 7: Effect of ultrasound mode on DPPH and ABTS |
Solvent Extraction
Applying the pulsed ultrasound mode at 40% as amplitude for 15 min, the adoption of different solvent extraction have affected the TPC, TFC, DPPH and the ABTS of Dodonaea viscose (figure 8).
The use of methanol was picked as the best solvent for extraction (The chloroform can be used) between the three extracting solvents (Ethyl acetate, Chloroform and Methanol). The methanol has a relative polarity 0.762 compared to 0.259 for chloroform and 0.228 for ethyl acetate. This difference in polarity may be influenced the phenolic content. A lot of researches have indicated that the solubility of phenolics in the solvent is dependent on solvent polarity [36]. Phenolic compounds are distributed in the cell according to their polarity [39]. The extraction solvent must be elected according to the solubility.
Flavonoids are “high level” antioxidants, including flavones, flavanols, isoflavonoles, anthocyanins and condensed tannins. Results of this research are also supporting the presence of flavonoids from the D.viscose plant. Figure 8 revealed that TPC and TFC amount increased with increasing the polarity of solvents.
The results of DPPH and ABTS with the variation of solvents are shown in figure 9. The best values were reached with the use of Methanol respectively (13.60 and 3.58 µg.g-1 extract). In this study, there is a correlation between total phenolic and flavonoid content and antioxidant activity. As can be noted, DPPH results were highly correlated with ABTS values in this research paper.
These results confirm that, using the best solvent (Methanol), the best extraction time (15 min), the best amplitude 40% and with the best ultrasound mode (pulsed ultrasound) have significantly affected the extraction of TPC and TFC from D. viscose. Our results of TPC and TFC are commonly greater than those reported in the literature [40,41].
Good results of DPPH and ABTS were obtained with using these parameters. These results indicated that the extraction compound take part in to antioxidative activity.
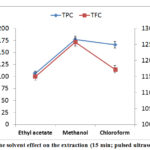 |
Figure 8: The solvent effect on the extraction (15 min; pulsed ultrasound; 40%). |
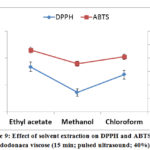 |
Figure 9: Effect of solvent extraction on DPPH and ABTS |
AgNPs Characterization
Green synthesis of AgNPs through D. viscose aqueous extract was carried out. The change of pale yellow color to dark brown color of the reaction mixture marked the synthesis of silver nanoparticles. Silver nanoparticles show a color change (pale yellow to dark brown) as a result of excitation of surface Plasmon vibrations in the particles. Characterization of synthesized nanoparticles was revealed by different methods.
A UV–vis spectrometer was utilized to mark gradual modifications in Local Surface Plasmon Resonance (LSPR) of the produced silver nanoparticles. The absorption at 431 nm indicates the presence of Ag NPs (Fig.10).
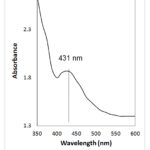 |
Figure 10: UV-vis spectrum. |
The FT-IR spectrum of D. viscose extract after synthesis of silver nanoparticles was realized to identify the water soluble organic compounds from the leaves extract which may take part in the reduction procedure of silver ions (Fig.10).
A strong peak at 3425 cm–1 indicates the presence of O-H groups in phenolic compounds, and N-H groups in proteins. The peak observed at 2970 cm–1 is due to aliphatic C-H stretching. The peaks at (1400 and 1650) cm– 1indicates C=C stretching in alkenes and aromatic compounds and also C-H bending in aliphatic compounds. The peaks at (1000-1300) cm–1 indicate C-C and C-O stretching in the compounds like alcohols and phenols. FT-IR confirmed the presence of bio-reducing organic compounds on the surface of AgNPs which are likely to be responsible for nanoparticle synthesis and stability [42].
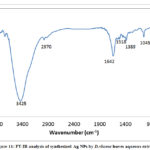 |
Figure 11: FT-IR analysis of synthesized Ag NPs by D.viscose leaves aqueous extract. |
The size, size range, and distribution of the synthesized AgNPs were studied by transmission electron microscopy (TEM; JEOL-2100 made in Japan). A typical transmission electron microscope (TEM) image of the nanoparticles and their size distribution are presented in Fig. 12. The mean diameter and standard deviation of silver nanoparticles was found 30.20±19.43 (nm).
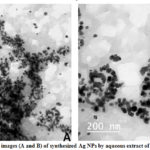 |
Figure 12: TEM images (A and B) of synthesized Ag NPs by aqueous extract of D.viscose. leaves. |
Conclusion
In the current study, ultrasound-assisted extraction (UAE) was applied to extract total phenolic and antioxidant compounds from Dodonaea viscose. As far as we know, no data was reported about the extraction effect parameters on the extraction of phenolic compounds from D. viscose by the use of ultrasound. Results showed that TPC, TFC, DPPH and ABTS were highly affected by all the studied parameters. The optimal ultrasound extraction conditions were the solvent (Methanol), the extraction time (15 min), the amplitude 40 % and with the pulsed ultrasound mode.
In this research, we report a simple aqueous method for the environmentally friendly biosynthesis of Ag NPs. The results of this synthesis are promising.
Acknowledgements
The author is thankful to University of Al-Baha for providing financial support to this project (38/1439).
Conflicts of Interest
The author declares that there are no conflicts of interest related to this article.
References
- Lakshmisha, C.N.; Ravishankar, G.; Ninan, C.O.; Mohan, T.K.; Gopal, S.; Effect of freezing time on the quality of Indian mackerel (Rastrelliger kanagurta) during frozen storage. Journal of Food Science., 2008, 73, 345–353.
CrossRef - Cameron, M.; McMaster, L.D.; Britz. T.J.; Impact of ultrasound on dairy spoilage microbes and milk components. Dairy Science and Technology., 2009, 89, 83–98.
CrossRef - Pingret, D.; Fabiano-Tixier, A.S.; Petitcolas, E.; Canselier, J.P.; Chemat, F.; First investigation on ultrasound-assisted preparation of food products: Sensory and physicochemical characteristics. Journal of Food Science., 2011, 76, 287–292.
CrossRef - Chemat, F.; Khan. M.K.; Applications of ultrasound in food technology: Processing, preservation and extraction. Ultrasonics Sonochemistry., 2011, 18, 813–835.
CrossRef - Zhang, Y.; Zhang, W.; Liao. X.; Degradation of diazinon in apple juice by ultrasonic treatment. Ultrasonics Sonochemistry., 2010, 17, 662–668.
CrossRef - Zhang, Y.; Xiao, Z.; Chen. F.; Degradation behavior and products of malathion and chlorpyrifos spiked in apple juice by ultrasonic treatment. Ultrasonics Sonochemistry., 2010, 17, 72–77.
CrossRef - Pan, Z.L.; Qu, W.J.; Ma, H.L.; Atungulu, G.G.; Mchugh. T.H.; Continuous and pulsed ultrasound-assisted extractions of antioxidants from pomegranate peel. Ultrasonics Sonochemistry., 2011, 18, 1249–1257.
CrossRef - Skirtenko, N.; Tzanov, T.; Gedanken, A.; Rahimipour. S.; One-step preparation of multifunctional chitosan microspheres by a simple sonochemical method. Chemistry A European Journal., 2010, 16, 562–567.
CrossRef - Zúñiga, R.N.; Kulozik, U.; Aguilera. J.M.; Ultrasonic generation of aerated gelatin gels stabilized by whey protein β-lactoglobulin. Food hydrocolloid., 2011, 25, 958–967.
CrossRef - Harzali, H.; Saida, F.; Marzouki, A.; Megriche, A.; Baillon, F.; Espitalier, F.; Mgaidi, A.; Structural and magnetic properties of nano-sized NiCuZn ferrites synthesized by co-precipitation method with ultrasound irradiation, Journal of Magnetism and Magnetic Materials., 2016, 419, 50-56.
CrossRef - Nomura, H.; Koda, S.; Yasuda, K.; Kojima. Y.; Quantification of ultrasonic intensity based on the decomposition reaction of porphyrin. Ultrasonics Sonochemistry., 1996, 3, 153–156.
CrossRef - Rong, L.; Kojima, Y.; Koda, S.; Nomura. H.; Simple quantication of ultrasonic intensity using aqueous solution of phenolphthalein. Ultrasonics Sonochemistry., 2001, 8, 11–15.
CrossRef - Hu, Y.; Zhang, Z.; Yang, C.; Measurement of hydroxyl radical production in ultrasonic aqueous solutions by a novel chemiluminescence method. Ultrasonics Sonochemistry., 2008, 15, 665–672.
CrossRef - Yang, M.; Rathman, J.F.; Weavers, L.K.; Degradation of Alkylbenzene Sulfonate Surfactants by Pulsed Ultrasound, Journal of Physical Chemistry B., 2005, 109, 16203-16209.
CrossRef - Ranjan, A.; Singh, S.; Malani, R.S.; Moholkar, V.S.; Ultrasound-Assisted Bioalcohol Synthesis: Review and Analysis. RSC Advances., 2016, 6, 65541-65562.
CrossRef - Peters, D.; Ultrasound in materials chemistry. Journal of Materials Chemistry., 1996, 6, 1605-1618.
CrossRef - Jain, A.; Sinha, P.; Desai, N.; International Journal of Pharmaceutical Sciences and Drug Reserch., 2014,5, 1320.
- Riaz, T.; Abbasi, A.; Aziz-Ur-Rehman, A.; Shahzadi, T.; Ajaib, M.; Khan, M.; Journal of the Serbian Chemistry Society., 2012, 77, 423.
CrossRef - Li, C.; Wang, M.H.; Antioxidant Activity of Peach Blossom Extracts. Journal of the Korean Society for Applied Biological Chemistry., 2011, 46-53.
CrossRef - Rossato, S.B.; Haas, C.; Raseira, M.d.C.B.; Moreira, J.C.F.; Zuanazzi, J.S.;Antioxidant potential of peels and fleshes of peaches from different cultivars. Journal of medicinal food., 2009, 1119- 1126.
CrossRef - Shin, T.-Y.; Park, S.-B.; Yoo, J.-S.; Kim, I.K.; Lee, H.-S.; Kwon, T.K.; Kim, M.K.; Kim, J.C.; Kim, S.-H.; Antiallergic inflammatory activity of the fruit of Prunus persica: Role of calcium and NF-κB. Food and Chemical Toxicology., 2010, 48, 2797-2802.
CrossRef - Cevallos-Casals, B.A.; Byrne, D.; Okie, W.R.; Cisneros-Zevallos, L.; Selecting new peach and plumgenotypes rich in phenolic compounds and enhanced functional properties. Food Chemistry., 2006, 273-280.
CrossRef - Lee, C.K.; Park, K.K.; Hwang, J.K.; Lee, S.K.; Chung, W.Y.; The extract of Prunus persica flesh (PPFE) attenuates chemotherapy-induced hepatotoxicity in mice. Phytotherapy Research., 2008, 22, 223-227.
CrossRef - Lee, C.K.; Park, K.K.; Hwang, J.K.; Lee, S.K.; Chung, W.Y.; Extract of Prunus persica flesh (PPFE) improves chemotherapeutic efficacy and protects against nephrotoxicity in cisplatin-treated mice, Phytotherapy Research, 2009, 23, 999-1005.
CrossRef - Geng, M.; Li, W.; Yang, R.; Cui, C.; Antioxidant and antiproliferative activity (in vitro) of polyphenols from peach blossom. Journal of Food, Agriculture and Environment., 2013, 11, 429-433.
- Noratto, G.; Porter, W.; Byrne, D.; Cisneros-Zevallos, L.; Identifying peach and plum polyphenols with chemopreventive potential against estrogen-independent breast cancer cells. Journal of Agricultural and Food Chemistry., 2009, 57, 5219-5226.
CrossRef - Noratto, G.; Porter, W.; Byrne, D.; Cisneros-Zevallos, L.; Polyphenolics from peach (Prunus persicavar. Rich Lady) inhibit tumor growth and metastasis of MDA-MB-435 breast cancer cells in vivo. Journal of Nutritional Biochemistry., 2014, 25, 796-800.
CrossRef - Shankar, S. S.; Ahmad; A.; pasricha, R.; Sastry, M.; Bioreduction of chloroaurate ions by geranium leaves and its endophytic fungusyields gold nanoparticles of different shapes. Journal of Materials Chemistry., 2003,13,1822-1826.
CrossRef - Shankar, S. S.; Ahmad; A.; pasricha, R.; Sastry, M.; Rapid synthesis of Au, Ag, and bimetallic Au Core-Ag shell nanoparticles using neem (Azadira chtaindica) leaf broth. Journal of Colloid and Interface Science., 2004, 275, 496-502.
CrossRef - Rautaray, D.; Sanyal, A.; Bharde, A.; Ahmad, A.; Sastry, M.; Biological synthesis of stable vat rite crystals by the reaction of calcium ions with germinating chickpea seeds. Crystal Growth Design., 2005, 5, 399-402.
CrossRef - Harzali, H.; Baillon, F.; louisnard, O.; Espitalier, F.; Mgaidi, A.; Chemical Engineering Journal., 2012, 195, 332.
CrossRef - Singleton, V.L.; Rossi, J.A.; Colorimetry of total phenolics with phosphomolybdic-phosphotungstic acid reagents. American journal of Enology and Viticulture., 1965,16, 144-158.
- Chang, C., Yang, M., Wen, H., Chern, J., 2002. Estimation of total flavonoid content in propolis by two complementary colorimetric methods. Journal of Food and Drug Analysis., 2002, 10, 178-182.
Fenshyur, L.; Tsung, J. H.; Chen, J.H.; Chiu, C.Y.; Pinglo, C.; International Journal of Applied Science and Engineering., 2005, 3, 195. - Mokrani, A.; Madani, K.; Effect of solvent, time and temperature on the extraction of phenolic compounds and antioxidant capacity of peach (Prunus persica L.) fruit. Separation and Purification Technology., 2016, 162, 68-76.
CrossRef - Falleh, H.; Ksouri, R.; Lucchessi, ME.; Abdelly, C.; Magne, C.; Ultrasound-Assisted Extraction: Effect of Extraction Time and Solvent Power on the Levels of Polyphenols and Antioxidant Activity of Mesembryanthemum edule L. Aizoaceae Shoots. Tropical Journal of Pharmaceutical Research., 2012, 11, 243-249.
CrossRef - Pan, Z.; Qu,W.; Ma, H.; Atungulu, G.G.; Tara, H.; Continuous and pulsed ultrasound-assisted extractions of antioxidants from pomegranate peel. Ultrasonics Sonochemistry., 2012, 19, 365-372.
CrossRef - Helena, A.; Bla, G.; Nata, P.;The Methodology Applied in DPPH, ABTS and Folin-Ciocalteau Assays Has a Large Influence on the Determined Antioxidant Potential. Acta Chimica Slovenica., 2017, 64, 491–499.
CrossRef - Galvan D’Alessandro, L.; Kriaa, K.; Nikov, I.; Dimitrov, K. Ultrasound assisted extraction of polyphenols from black chokeberry. Seperation Purification Technology., 2012, 93, 42–47.
CrossRef - Raquel, M. M. ; Cauriane, E. ; Sérgio, D. ; Melânia, P.M.; Antiinflammatory activity and concentrations of polyphenols and flavonoids in the ethanolic extract of dodonaea viscosa (Sapindaceae). Saْde (Santa Maria)., 2012, 38, 113-120.
CrossRef - Nosheen, A.; Ihsan, U.; Bushra, M.; Phytochemical analysis and comprehensive evaluation of antimicrobial and antioxidant properties of 61 medicinal plant species. Arabian Journal of Chemistry., 2015, 11, 1223-1235.
CrossRef - Abdulaziz, A. A.; Kout, E. F.; Nagy, E. M.; Green synthesis of assembled silver nanoparticles in nano capsules of Peganum harmala L leaf extract. Antibacterial activity and conjugate investigation. Cogent Chemistry., 2018, 4,1-13.
CrossRef

This work is licensed under a Creative Commons Attribution 4.0 International License.
![]()
A New Edition of Web of Science
Journal Impact Factor
2022: 0.5
Five Year: 0.8
Journal is Indexed in

Cabells Whitelist
![]()


