Theoretical Prediction of Lipophilicity for Some Drugs Compounds
1Dept. of Chemistry, College of Science, University of Mosul, Iraq
2Dept. of Chemistry, College of Science, Al-Hussein Bin Talal University, Ma'an, Jordan
3Al-Noor University College
Corresponding Author E-mail: ammar74@uomosul.edu.iq
DOI : http://dx.doi.org/10.13005/ojc/360115
Download this article as:
![]()
The theoretical calculations were evaluated for thirty four drugs compounds. Many parameters have been calculated theoretically and enter as a model to predicting the best values of practical (Log P). All these compounds were evaluated by semi- empirical (AM1) and Hartree Fock in basis set (HF/STO-3G) using Gaussian 03w. The thermodynamic descriptors like HOMO, LUMO, total energy, Gibbs Free Energy…etc were computed and played an important role for predictions the practical lipophilicity values. A linearity was shown when correlated with experimental data. Multiple linear regression analysis was performed to derive quantitative structure activity relationship models which were further evaluated for the predictions.
KEYWORDS:Drug Compounds; HOMO; Lipophilicity, LUMO
Introduction
Theoretical calculations have particularly succeeded for ionization potential(1), molecular docking approaches(2, 3)and metabolite of antipyrine(4).The lipophilicity is measured by the log P, which represents the equilibriumbetween a polar (aqueous) phase and apolar phase (often n-octanol,appropriate for the simulation of biological membranes)(5). The lipophilicity of a drug plays a significant role in numerous biological responses(6).
All the compounds studied have different lipophilicity degree which depends on the substituents involved in its structural chemistry(7).Using (Log P) parameter by (QSAR) developed for the pharmaceutical, biochemical and toxicological(8-10).
(QSAR) of a series of substituted benzo[a]phenazines, in regard to their anticancer activity, has been studied using the density functional theory (DFT) method, molecular mechanics method (MMC) and statistical method. The Lipophilicity indexes log P, the calculated log P by fragment-based methods) of the molecules were obtained(11).Electronic, stereochemical, lipophilic and topological descriptors were calculated for biological receptors called peroxisome proliferator-activated receptors (PPARs). which control the metabolism of carbohydrates and lipids(12).Dihydrofolate reductase (DHFR) inhibitors have proved to be of value asantibacterial, antimalarial, and antitumor agents. Lipophilicity of the whole molecule (log P) played an important role(13).
The smaller size of Co+2 reduces polarity andincreases the lipophilicity of the bacterial membrane, interrupting normal cellular processes and enhancing theantifungal activity of Co+2 complex(14).In vitro and in vivo evaluation indicated that the prodrugs were freely soluble, more lipophilic than parent drug(15,16). Also, the lipophilicity was determined by normal phase TLC(17), HPLC(18)and QSPR(19).
Materials and Methods
All the calculations have been performed using ChemBio Office (version 11.0.1). The (GAUSSIAN 03W) program was employed for the calculations. The correlation coefficient (R), standard error (SE) and Fisher constant (F) were employed to judge the validity of regression equation. Many sets of drugs were taken which containing (OH-) hydroxy atom on the aliphatic and aromatic compounds.
The physicochemical properties were calculated include thermodynamic parameters DG, DH, DS, steric energy, electronic descriptors [logP, mol refractivity, the highest occupied molecular orbital energy (HOMO) and lowest unoccupied molecular orbital energy (LUMO)].
MM2 method was used firstly to find the best configuration stable form. The minimization is continued until the root mean square (RMS) gradient value reaches a value smaller than 0.001 kcal/mol Angstrom. Later, (AM1and HF/STO-3G) methods were used to calculate the physical properties of the drugs compounds.
Results and Discussion
Set one (AM1)
The first set of the drugs was shown in the table (1) beside the physical parameters which were calculated theoretically using (AM1) method. The relationship between the experimental reported log P values and the computed descriptors was determined using multi-linear regression. At using the enter method in (SPSS), the equation was :
logP= 0.939 + 8.343 (Free Energy) – 0.009 (CV) – 0.006 (S) – 1.082 (HF) – 0.002 (steric) + 9.957 (HOMO) – 5.811
(LUMO) + 0.241 (Mol Ref.) + 5.597 (Part. Coeff.) —— (1)
(No. 34 , R= 0.990 , St. Error = 0.335 , F= 127.442)
While at using (stepwise) method, the equation was shown at the following:
logP= -2.695 + 0.615 (Part. Coeff.) + 8.687 (Thermal Energy) —— (2)
(No. 34 , R= 0.988 , St. Error = 0.318 , F= 632.504)
Table 1: Experimental logP and physical parameters using (AM1) method
| Drugs | Log P | Zero point Energies | Thermal Energies | Enthalpies | Free Energies | E (Thermal) | CV |
| Hartree | Hartree | Hartree | Hartree | Kcal/Mol | cal/mol-K | ||
| Abacavir | 0.72 | 0.32838 | 0.34716 | 0.34811 | 0.27737 | 217.848 | 70.565 |
| Acyclovir | -1.76 | 0.23925 | 0.25410 | 0.25504 | 0.19589 | 159.448 | 54.410 |
| Adenosine | -1.46 | 0.25538 | 0.27237 | 0.27332 | 0.20836 | 170.915 | 62.614 |
| Albuterol | 0.02 | 0.33358 | 0.35226 | 0.35320 | 0.28447 | 221.046 | 68.569 |
| Atropine | 1.53 | 0.38692 | 0.40565 | 0.40660 | 0.33719 | 254.550 | 72.015 |
| Azacitidine | -1.99 | 0.23007 | 0.24585 | 0.24679 | 0.18601 | 154.270 | 57.956 |
| Carbidopa | -0.19 | 0.24834 | 0.26441 | 0.26536 | 0.20412 | 165.920 | 59.183 |
| Cytarabine | -2.3 | 0.24291 | 0.25859 | 0.25954 | 0.19869 | 162.269 | 58.527 |
| Decitabine | -1.93 | 0.22512 | 0.23991 | 0.24086 | 0.18207 | 150.547 | 54.131 |
| Desvenlafaxine | 2.26 | 0.39517 | 0.41415 | 0.41510 | 0.34679 | 259.884 | 72.647 |
| Dobutamine | 2.49 | 0.38899 | 0.41093 | 0.41187 | 0.33115 | 257.860 | 81.035 |
| Dyphylline | -1.12 | 0.25841 | 0.27588 | 0.27683 | 0.21060 | 173.119 | 62.450 |
| Floxuridine | -1.2 | 0.21981 | 0.23464 | 0.23558 | 0.17618 | 147.238 | 55.063 |
| Ganciclovir | -2.07 | 0.24891 | 0.26584 | 0.26679 | 0.20226 | 166.818 | 61.578 |
| Homatropine | 1.57 | 0.35820 | 0.37548 | 0.37642 | 0.31073 | 235.617 | 67.254 |
| Hydroxychloroquine | 3.54 | 0.42694 | 0.45075 | 0.45169 | 0.36738 | 282.849 | 86.496 |
| Isoetharine | 1.13 | 0.33339 | 0.35212 | 0.35306 | 0.28513 | 220.957 | 68.544 |
| Isoproterenol | 0.25 | 0.27601 | 0.29223 | 0.29318 | 0.23010 | 183.379 | 58.751 |
| Isoxsuprine | 2.58 | 0.38944 | 0.41082 | 0.41177 | 0.33470 | 257.794 | 80.003 |
| Lamivudine | -1.02 | 0.20450 | 0.21852 | 0.21946 | 0.16227 | 137.123 | 51.660 |
| Levobunolol | 2.86 | 0.40632 | 0.42739 | 0.42833 | 0.35275 | 268.191 | 78.991 |
| Metipranolol | 2.67 | 0.42742 | 0.45283 | 0.45377 | 0.36751 | 284.155 | 89.840 |
| Midodrine | -0.32 | 0.30600 | 0.32443 | 0.32538 | 0.25729 | 203.585 | 67.361 |
| Pyridoxine | -1.9 | 0.18992 | 0.20219 | 0.20313 | 0.15134 | 126.875 | 43.813 |
| Risedronic acid | -2.94 | 0.20154 | 0.21959 | 0.22053 | 0.15486 | 137.794 | 65.868 |
| Ritodrin | 1.61 | 0.36055 | 0.37988 | 0.38083 | 0.30928 | 238.379 | 73.810 |
| Stavudine | -0.91 | 0.22577 | 0.24064 | 0.24159 | 0.17852 | 151.006 | 53.326 |
| Terbutaline | 0.48 | 0.30482 | 0.32204 | 0.32299 | 0.25716 | 202.085 | 63.950 |
| Trihexyphenidyl | 5.06 | 0.48781 | 0.50820 | 0.50914 | 0.43689 | 318.898 | 80.508 |
| Tropicamide | 1.16 | 0.34962 | 0.36833 | 0.36928 | 0.29971 | 231.132 | 70.344 |
| Vidarabine | -1.46 | 0.25544 | 0.27234 | 0.27328 | 0.20893 | 170.895 | 62.586 |
| Vorinostat | 0.86 | 0.33606 | 0.35572 | 0.35666 | 0.27938 | 223.216 | 69.985 |
| Zalcitabine | -1.51 | 0.23336 | 0.24698 | 0.24793 | 0.19143 | 154.985 | 50.659 |
| Zoledronic acid | -2.28 | 0.18294 | 0.20023 | 0.20117 | 0.13721 | 125.644 | 62.757 |
Table (1): Continued …
| Drugs | Log P | S | HF | Steric energy | HOMO | LUMO | Mol Ref. | Partition Coefficient |
| cal/mol-K | Hartree | (a.u.) | (a.u.) | |||||
| Abacavir | 0.72 | 148.877 | 0.15097 | 40.67 | -0.30382 | 0.00319 | 7.8973 | 0.8057 |
| Acyclovir | -1.76 | 124.491 | -0.08041 | 15.51 | -0.31690 | 0.00994 | 5.4966 | -2.1354 |
| Adenosine | -1.46 | 136.720 | -0.14181 | 38.25 | -0.32661 | -0.00929 | 6.2955 | -2.1577 |
| Albuterol | 0.02 | 144.658 | -0.22051 | -0.12 | -0.33796 | 0.00395 | 6.7632 | 0.0614 |
| Atropine | 1.53 | 146.082 | -0.17317 | 32.90 | -0.34748 | 0.00358 | 8.1462 | 1.2992 |
| Azacitidine | -1.99 | 127.931 | -0.25863 | 12.92 | -0.36931 | -0.01385 | 5.3911 | -2.1981 |
| Carbidopa | -0.19 | 128.890 | -0.22215 | -25.99 | -0.32092 | 0.01247 | 5.7762 | -0.4448 |
| Cytarabine | -2.3 | 128.064 | -0.2743 | 15.34 | -0.33873 | -0.00018 | 5.6022 | -2.1951 |
| Decitabine | -1.93 | 123.727 | -0.18278 | 20.16 | -0.36249 | -0.00838 | 5.2380 | -1.9012 |
| Desvenlafaxine | 2.26 | 143.772 | -0.14428 | 17.43 | -0.32439 | 0.01927 | 7.8241 | 2.6830 |
| Dobutamine | 2.49 | 169.890 | -0.1674 | 1.32 | -0.32084 | 0.00837 | 8.8106 | 2.4330 |
| Dyphylline | -1.12 | 139.395 | -0.15661 | 26.39 | -0.33688 | -0.02165 | 6.2242 | -1.2861 |
| Floxuridine | -1.2 | 125.014 | -0.36648 | 22.05 | -0.36340 | -0.02766 | 5.3090 | -1.4048 |
| Ganciclovir | -2.07 | 135.806 | -0.14534 | 22.87 | -0.31957 | -0.01469 | 6.0691 | -2.5448 |
| Homatropine | 1.57 | 138.272 | -0.16281 | 27.30 | -0.34750 | 0.00392 | 7.6824 | 1.4274 |
| Hydroxychloroquine | 3.54 | 177.453 | -0.02964 | 24.86 | -0.31718 | -0.01819 | 9.7216 | 4.1159 |
| Isoetharine | 1.13 | 142.972 | -0.20758 | 3.23 | -0.32652 | 0.00245 | 6.7632 | 0.9914 |
| Isoproterenol | 0.25 | 132.761 | -0.20465 | -7.38 | -0.32934 | 0.00299 | 5.8356 | 0.1534 |
| Isoxsuprine | 2.58 | 162.193 | -0.14145 | 8.84 | -0.32683 | 0.00385 | 8.8106 | 2.6150 |
| Lamivudine | -1.02 | 120.367 | -0.09953 | 9.64 | -0.32222 | -0.01616 | 5.6385 | -1.4624 |
| Levobunolol | 2.86 | 159.088 | -0.19797 | 17.93 | -0.33775 | -0.01415 | 8.3236 | 2.2623 |
| Metipranolol | 2.67 | 181.563 | -0.26987 | 19.15 | -0.33847 | -0.00504 | 8.6541 | 2.5454 |
| Midodrine | -0.32 | 143.306 | -0.2255 | -5.84 | -0.32555 | -0.00065 | 6.7038 | -0.4248 |
| Pyridoxine | -1.9 | 109.014 | -0.19064 | 4.10 | -0.34360 | -0.00701 | 4.3282 | -0.3450 |
| Risedronic acid | -2.94 | 138.228 | -0.66112 | 28.74 | -0.37478 | -0.01503 | 5.7520 | -2.6224 |
| Ritodrin | 1.61 | 150.580 | -0.15598 | -1.74 | -0.32844 | 0.01275 | 8.3468 | 1.6514 |
| Stavudine | -0.91 | 132.740 | -0.1791 | 7.40 | -0.35086 | -0.00871 | 5.5788 | -0.4875 |
| Terbutaline | 0.48 | 138.542 | -0.20335 | 0.30 | -0.33354 | 0.01039 | 6.2994 | 0.4824 |
| Trihexyphenidyl | 5.06 | 152.058 | -0.1029 | 22.65 | -0.33388 | 0.01885 | 9.3488 | 5.1510 |
| Tropicamide | 1.16 | 146.405 | -0.05002 | 4.58 | -0.35844 | 0.00185 | 8.3290 | 1.1806 |
| Vidarabine | -1.46 | 135.449 | -0.14293 | 41.99 | -0.31980 | -0.00317 | 6.2955 | -2.1577 |
| Vorinostat | 0.86 | 162.648 | -0.14613 | -8.32 | -0.32383 | 0.01037 | 7.3609 | 0.9890 |
| Zalcitabine | -1.51 | 118.919 | -0.14032 | 15.58 | -0.34090 | -0.00424 | 5.2960 | -1.2469 |
| Zoledronic acid | -2.28 | 134.613 | -0.61319 | 41.98 | -0.34492 | 0.00261 | 5.1815 | -3.0656 |
Table (2) was show the predicted of the (34) drugs using the equation (2). The correlation between the experimental and the predicted values shows an excellent predicted for the drugs (R= 0.988).
Table 2: Experimental and predicted of logP using (AM1) method
| No | Drugs | Log P (Practical) | Log P (Predicted) | Residuals | No | Drugs | Log P (Practical) | Log P (Predicted) | Residuals |
| 1 | Abacavir | 0.72 | 0.816 | 0.096 | 18 | Isoproterenol | 0.25 | -0.062 | -0.312 |
| 2 | Acyclovi | -1.76 | -1.801 | -0.041 | 19 | Isoxsuprine | 2.58 | 2.482 | -0.098 |
| 3 | Adenosine | -1.46 | -1.656 | -0.196 | 20 | Lamivudine | -1.02 | -1.696 | -0.676 |
| 4 | Albuterol | 0.02 | 0.403 | 0.383 | 21 | Levobunolol | 2.86 | 2.409 | -0.451 |
| 5 | Atropine | 1.53 | 1.628 | 0.098 | 22 | Metipranolol | 2.67 | 2.804 | 0.134 |
| 6 | Azacitidine | -1.99 | -1.911 | 0.079 | 23 | Midodrine | -0.32 | -0.138 | 0.182 |
| 7 | Carbidopa | -0.19 | -0.672 | -0.482 | 24 | Pyridoxine | -1.9 | -1.151 | 0.749 |
| 8 | Cytarabine | -2.3 | -1.799 | 0.501 | 25 | Risedronic acid | -2.94 | -2.400 | 0.540 |
| 9 | Decitabine | -1.93 | -1.780 | 0.150 | 26 | Ritodrin | 1.61 | 1.621 | 0.011 |
| 10 | Desvenlafaxine | 2.26 | 2.553 | 0.293 | 27 | Stavudine | -0.91 | -0.904 | 0.006 |
| 11 | Dobutamine | 2.49 | 2.371 | -0.119 | 28 | Terbutaline | 0.48 | 0.399 | -0.081 |
| 12 | Dyphylline | -1.12 | -1.089 | 0.031 | 29 | Trihexyphenidyl | 5.06 | 4.888 | -0.172 |
| 13 | Floxuridine | -1.2 | -1.521 | -0.321 | 30 | Tropicamide | 1.16 | 1.231 | 0.071 |
| 14 | Ganciclovir | -2.07 | -1.951 | 0.119 | 31 | Vidarabine | -1.46 | -1.656 | -0.196 |
| 15 | Homatropine | 1.57 | 1.445 | -0.125 | 32 | Vorinostat | 0.86 | 1.003 | 0.143 |
| 16 | Hydroxychloroquine | 3.54 | 3.752 | 0.212 | 33 | Zalcitabine | -1.51 | -1.316 | 0.194 |
| 17 | Isoetharine | 1.13 | 0.974 | -0.156 | 34 | Zoledronic acid | -2.28 | -2.841 | -0.561 |
In comparison between the predicted and the practical values, we noted that a linear correlation with an excellent correlation coefficient (R2= 0.976) as shown in figure (1).
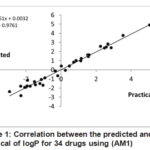 |
Figure 1: Correlation between the predicted and the practical of logP for 34 drugs |
Set two (HF/STO-3G)
The second set of the drugs was shown in the table (3) which was calculated theoretically using (HF/STO-3G) method. The relationship between the experimental reported log P values and the computed descriptors was determined using multi-linear regression.
By using the enter method in (SPSS), the equation was :
logP= -2.365 + 4.621 (Free Energy) +0.028(CV) – 0.015 (S) – 5.241×10⁻⁵(HF)-0.001(steric)+0.859(HOMO) +1.647(LUMO) + 0.178(Mol Ref.) + 0.612(Part. Coeff.) —— (3)
(No. 34 , R= 0.989 , St. Error = 0.345 , F= 119.98)
While using (stepwise) method, the equation was shown at the following:
logP= -2.328+ 0.605(Part. Coeff.) + 8.042(Free Energy) —— (4)
(No. 34 , R= 0.988, St. Error = 0.322, F= 616.499)
Table 3: Experimental logP and physical parameters using (HF/STO-3G) method
| Drugs | Log P | Zero point Energies | Thermal Energies | Enthalpies | Free Energies | E (Thermal) | CV |
| Hartree | Hartree | Hartree | Hartree | Kcal/Mol | cal/mol-K | ||
| Abacavir | 0.72 | 0.37352 | 0.39093 | 0.39187 | 0.32474 | 245.310 | 64.588 |
| Acyclovir | -1.76 | 0.27140 | 0.28555 | 0.28650 | 0.22735 | 179.186 | 50.910 |
| Adenosine | -1.46 | 0.28947 | 0.30476 | 0.30570 | 0.24538 | 191.239 | 57.578 |
| Albuterol | 0.02 | 0.38573 | 0.40321 | 0.40416 | 0.33831 | 253.020 | 63.880 |
| Atropine | 1.53 | 0.44721 | 0.46466 | 0.46561 | 0.39910 | 291.579 | 65.601 |
| Azacitidine | -1.99 | 0.26076 | 0.27533 | 0.27627 | 0.21763 | 172.772 | 53.965 |
| Carbidopa | -0.19 | 0.28136 | 0.29650 | 0.29744 | 0.23826 | 186.055 | 56.079 |
| Cytarabine | -2.3 | 0.27636 | 0.29067 | 0.29161 | 0.23330 | 182.396 | 53.560 |
| Decitabine | -1.93 | 0.25572 | 0.26946 | 0.27040 | 0.21401 | 169.088 | 50.524 |
| Desvenlafaxine | 2.26 | 0.46089 | 0.47835 | 0.47929 | 0.41456 | 300.166 | 66.313 |
| Dobutamine | 2.49 | 0.44697 | 0.46707 | 0.46802 | 0.39306 | 293.091 | 74.416 |
| Dyphylline | -1.12 | 0.29614 | 0.31262 | 0.31357 | 0.25072 | 196.172 | 58.583 |
| Floxuridine | -1.2 | 0.24764 | 0.26201 | 0.26296 | 0.20423 | 164.416 | 52.430 |
| Ganciclovir | -2.07 | 0.28219 | 0.29772 | 0.29866 | 0.23837 | 186.820 | 57.471 |
| Homatropine | 1.57 | 0.41303 | 0.42914 | 0.43009 | 0.36652 | 269.291 | 61.264 |
| Hydroxychloroquine | 3.54 | 0.49412 | 0.51629 | 0.51723 | 0.43768 | 323.974 | 80.054 |
| Isoetharine | 1.13 | 0.38678 | 0.40402 | 0.40496 | 0.34088 | 253.526 | 63.548 |
| Isoproterenol | 0.25 | 0.31845 | 0.33343 | 0.33437 | 0.27475 | 209.230 | 54.579 |
| Isoxsuprine | 2.58 | 0.44623 | 0.46602 | 0.46697 | 0.39408 | 292.434 | 73.455 |
| Lamivudine | -1.02 | 0.23432 | 0.24699 | 0.24793 | 0.19375 | 154.987 | 46.733 |
| Levobunolol | 2.86 | 0.47037 | 0.49011 | 0.49105 | 0.41912 | 307.546 | 73.209 |
| Metipranolol | 2.67 | 0.49681 | 0.52077 | 0.52171 | 0.44015 | 326.787 | 84.358 |
| Midodrine | -0.32 | 0.35155 | 0.36815 | 0.36909 | 0.30607 | 231.016 | 61.076 |
| Pyridoxine | -1.9 | 0.21706 | 0.22835 | 0.22930 | 0.17993 | 143.295 | 41.210 |
| Risedronic acid | -2.94 | 0.22605 | 0.24189 | 0.24283 | 0.18111 | 151.785 | 57.845 |
| Ritodrin | 1.61 | 0.41310 | 0.43153 | 0.43247 | 0.36262 | 270.787 | 69.127 |
| Stavudine | -0.91 | 0.25561 | 0.26980 | 0.27075 | 0.21246 | 169.302 | 50.613 |
| Terbutaline | 0.48 | 0.35190 | 0.36782 | 0.36876 | 0.30706 | 230.809 | 59.622 |
| Trihexyphenidyl | 5.06 | 0.57023 | 0.58908 | 0.59002 | 0.52086 | 369.651 | 72.354 |
| Tropicamide | 1.16 | 0.39934 | 0.41767 | 0.41862 | 0.34913 | 262.094 | 66.491 |
| Vidarabine | -1.46 | 0.28837 | 0.30410 | 0.30505 | 0.24273 | 190.828 | 58.486 |
| Vorinostat | 0.86 | 0.38499 | 0.40377 | 0.40471 | 0.33164 | 253.366 | 65.257 |
| Zalcitabine | -1.51 | 0.26585 | 0.27889 | 0.27983 | 0.22371 | 175.005 | 47.116 |
| Zoledronic acid | -2.28 | 0.20696 | 0.22332 | 0.22427 | 0.16305 | 140.138 | 59.832 |
Table 3: Continued …
| Drugs | Log P | S | HF | Steric energy | HOMO | LUMO | Mol Ref. | Partition Coefficient |
| cal/mol-K | Hartree | (a.u.) | (a.u.) | |||||
| Abacavir | 0.72 | 141.283 | -930.423 | 40.67 | -0.22696 | 0.23407 | 7.8973 | 0.8057 |
| Acyclovir | -1.76 | 124.488 | -797.035 | 15.51 | -0.24613 | 0.25526 | 5.4966 | -2.1354 |
| Adenosine | -1.46 | 126.954 | -945.719 | 38.25 | -0.26515 | 0.20221 | 6.2955 | -2.1577 |
| Albuterol | 0.02 | 138.585 | -773.769 | -0.12 | -0.24819 | 0.25947 | 6.7632 | 0.0614 |
| Atropine | 1.53 | 139.978 | -924.621 | 32.90 | -0.27591 | 0.25418 | 8.1462 | 1.2992 |
| Azacitidine | -1.99 | 123.426 | -890.403 | 12.92 | -0.28110 | 0.19989 | 5.3911 | -2.1981 |
| Carbidopa | -0.19 | 124.55 | -785.010 | -25.99 | -0.22639 | 0.27185 | 5.7762 | -0.4448 |
| Cytarabine | -2.3 | 122.733 | -874.641 | 15.34 | -0.23293 | 0.23022 | 5.6022 | -2.1951 |
| Decitabine | -1.93 | 118.694 | -816.563 | 20.16 | -0.25619 | 0.22355 | 5.2380 | -1.9012 |
| Desvenlafaxine | 2.26 | 136.238 | -814.521 | 17.43 | -0.23635 | 0.27320 | 7.8241 | 2.6830 |
| Dobutamine | 2.49 | 157.761 | -961.953 | 1.32 | -0.22866 | 0.26586 | 8.8106 | 2.4330 |
| Dyphylline | -1.12 | 132.268 | -892.562 | 26.39 | -0.24286 | 0.20830 | 6.2242 | -1.2861 |
| Floxuridine | -1.2 | 123.596 | -917.797 | 22.05 | -0.26909 | 0.21977 | 5.3090 | -1.4048 |
| Ganciclovir | -2.07 | 126.899 | -908.288 | 22.87 | -0.23465 | 0.22866 | 6.0691 | -2.5448 |
| Homatropine | 1.57 | 133.784 | -886.045 | 27.30 | -0.27023 | 0.26006 | 7.6824 | 1.4274 |
| Hydroxychloroquine | 3.54 | 167.434 | -1378.101 | 24.86 | -0.24030 | 0.19039 | 9.7216 | 4.1159 |
| Isoetharine | 1.13 | 134.875 | -773.767 | 3.23 | -0.23590 | 0.25814 | 6.7632 | 0.9914 |
| Isoproterenol | 0.25 | 125.495 | -696.621 | -7.38 | -0.23569 | 0.26197 | 5.8356 | 0.1534 |
| Isoxsuprine | 2.58 | 153.415 | -961.943 | 8.84 | -0.24279 | 0.25910 | 8.8106 | 2.6150 |
| Lamivudine | -1.02 | 114.034 | -1081.576 | 9.64 | -0.25192 | 0.21027 | 5.6385 | -1.4624 |
| Levobunolol | 2.86 | 151.39 | -925.775 | 17.93 | -0.24973 | 0.21819 | 8.3236 | 2.2623 |
| Metipranolol | 2.67 | 171.661 | -1000.770 | 19.15 | -0.24192 | 0.25486 | 8.6541 | 2.5454 |
| Midodrine | -0.32 | 132.648 | -862.173 | -5.84 | -0.25357 | 0.24625 | 6.7038 | -0.4248 |
| Pyridoxine | -1.9 | 103.915 | -580.886 | 4.10 | -0.26614 | 0.23528 | 4.3282 | -0.3450 |
| Risedronic acid | -2.94 | 129.899 | -1512.527 | 28.74 | -0.27302 | 0.23132 | 5.7520 | -2.6224 |
| Ritodrin | 1.61 | 147.012 | -923.369 | -1.74 | -0.23984 | 0.26814 | 8.3468 | 1.6514 |
| Stavudine | -0.91 | 122.678 | -783.873 | 7.40 | -0.25559 | 0.24349 | 5.5788 | -0.4875 |
| Terbutaline | 0.48 | 129.866 | -735.199 | 0.30 | -0.24374 | 0.26658 | 6.2994 | 0.4824 |
| Trihexyphenidyl | 5.06 | 145.56 | -893.856 | 22.65 | -0.26466 | 0.27298 | 9.3488 | 5.1510 |
| Tropicamide | 1.16 | 146.255 | -902.671 | 4.58 | -0.27912 | 0.24359 | 8.3290 | 1.1806 |
| Vidarabine | -1.46 | 131.163 | -945.712 | 41.99 | -0.25192 | 0.21998 | 6.2955 | -2.1577 |
| Vorinostat | 0.86 | 153.782 | -864.299 | -8.32 | -0.23188 | 0.26625 | 7.3609 | 0.9890 |
| Zalcitabine | -1.51 | 118.12 | -726.977 | 15.58 | -0.24261 | 0.22045 | 5.2960 | -1.2469 |
| Zoledronic acid | -2.28 | 128.837 | -1490.837 | 41.98 | -0.26986 | 0.28835 | 5.1815 | -3.0656 |
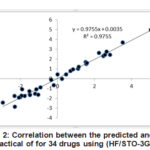 |
Figure 2: Correlation between the predicted and the practical of for 34 drugs |
Table (4) showed the predicted of the (34) drugs using the equation (4). The correlation between the experimental and the predicted values shows an excellent predicted for the drugs (R= 0.988) as shown in figure (2).
Table 4: Experimental and predicted of logP using (HF/STO-3G) method
|
No. |
Drugs |
Log P (Practical) |
Log P (Predicted) |
Residuals |
No. |
Drugs |
Log P (Practical) |
Log P (Predicted) |
Residuals |
|
1 |
Abacavir |
0.72 |
0.771 |
0.051 |
18 |
Isoproterenol |
0.25 |
-0.026 |
-0.276 |
|
2 |
Acyclovi |
-1.76 |
-1.792 |
-0.032 |
19 |
Isoxsuprine |
2.58 |
2.423 |
-0.157 |
|
3 |
Adenosine |
-1.46 |
-1.660 |
-0.200 |
20 |
Lamivudine |
-1.02 |
-1.655 |
-0.635 |
|
4 |
Albuterol |
0.02 |
0.430 |
0.410 |
21 |
Levobunolol |
2.86 |
2.411 |
-0.449 |
|
5 |
Atropine |
1.53 |
1.668 |
0.138 |
22 |
Metipranolol |
2.67 |
2.752 |
0.082 |
|
6 |
Azacitidine |
-1.99 |
-1.908 |
0.082 |
23 |
Midodrine |
-0.32 |
-0.124 |
0.196 |
|
7 |
Carbidopa |
-0.19 |
-0.681 |
-0.491 |
24 |
Pyridoxine |
-1.9 |
-1.090 |
0.810 |
|
8 |
Cytarabine |
-2.3 |
-1.780 |
0.520 |
25 |
Risedronic acid |
-2.94 |
-2.458 |
0.482 |
|
9 |
Decitabine |
-1.93 |
-1.757 |
0.173 |
26 |
Ritodrin |
1.61 |
1.587 |
-0.023 |
|
10 |
Desvenlafaxine |
2.26 |
2.629 |
0.369 |
27 |
Stavudine |
-0.91 |
-0.914 |
-0.004 |
|
11 |
Dobutamine |
2.49 |
2.305 |
-0.185 |
28 |
Terbutaline |
0.48 |
0.433 |
-0.047 |
|
12 |
Dyphylline |
-1.12 |
-1.090 |
0.030 |
29 |
Trihexyphenidyl |
5.06 |
4.977 |
-0.083 |
|
13 |
Floxuridine |
-1.2 |
-1.535 |
-0.335 |
30 |
Tropicamide |
1.16 |
1.194 |
0.034 |
|
14 |
Ganciclovir |
-2.07 |
-1.951 |
0.119 |
31 |
Vidarabine |
-1.46 |
-1.681 |
-0.221 |
|
15 |
Homatropine |
1.57 |
1.483 |
-0.087 |
32 |
Vorinostat |
0.86 |
0.937 |
0.077 |
|
16 |
Hydroxychloroquine |
3.54 |
3.682 |
0.142 |
33 |
Zalcitabine |
-1.51 |
-1.283 |
0.227 |
|
17 |
Isoetharine |
1.13 |
1.013 |
-0.117 |
34 |
Zoledronic acid |
-2.28 |
-2.871 |
-0.591 |
Conclusion
The theoretical calculations plays a significant role in the description of the practical parameters like (log P). The results of the theoretical calculated at table 4 of drugs showed a perfect exploration for descriptors. These results have been showed an excellent correlation between the practical values with predicted as shown in fig 1 and fig 2. This mean that the physicochemical parameters is very useful to give us an information about our system and sometimes help to predicted the practical values before determine them. There is no difference in correlation coefficient about (R=0.988) for the two methods (AM1) and (HF/STO-3G). Also, no large difference in the standard error about (0.318) to (0.322). But the Fisher value about (632.5) in (AM1) method at equation (2) compare to (HF/STO-3G) about (616.499) at equation (4).
Conflict of Interest
There is no conflict of interest for all authors.
References
- Ibrahim, A. A.; Abed, G. M., International Journal of Scientific & Engineering Research, January-2018, 9, Issue 1.
- Keserü, G. M.; Molnar L. J. Chem. Inf. Comput. Sci. 2001, 41, 120.
CrossRef - Dessalew, N.; Patel, D. S.; Bharatam, P. V. J. Mol. Graph. Model. 2007, 25, 885.
CrossRef - Ibrahim, A. A., Abdalrazaq, E. A., Ibrahim, M. A., Yahya, R.; Sulliman, E. A., Asian J. Chem., 2012, 24, No. 1.
- Maréchal, E.; Roy, S.; Lafanechère, L., Chemogenomics and Chemical Genetics, 2011, Springer-Verlag Berlin Heidelberg.
CrossRef - Hansch, C.; Leo, A. , The hydrophobic parameter: measurement and calculation, in: Exploring QSAR. Fundamentals and Applications in Chemistry and Biology, 1995, American Chemical Society, Washington, 97-124.
- Valverde, L. F. , Int.J. ChemTech Res., 2010 ,2(3).
- Dross K.; Mannhold R.; Rekker RF., Quant.Struct-Act. Relat ., 1992, 11,36-44.
CrossRef - KIpczyOska B.; Bojarski J.; Haber P.; Kaliszan R., 2000, Biomed Chromatogr., 14, 256-60.
CrossRef - Mannhold, R.; Dross K., Quant. Struct-Act Relat., 1996, 15, 403-9.
CrossRef - Jin-Can C., THEOCHEM, 2005, 756 167–172.
CrossRef - Vinícius, G. M.; Paula H. M.; Káthia M. H., J Mol Model, 2011, 17:2549–2558 .
CrossRef - Bikash, D.; Satya, P. V.; Biswanath, S.; Tarun, J., Internet Electronic Journal of Molecular Design 2003, 2, 128–136 .
- Kannan, S.; Syed M. A. P., International Journal of ChemTech Research, 2017,10(6): 770-783.
- Satish, K. L.; Rakesh; R. S., Anuj, G. A.; Prabhakar, Y. S., Int.J. ChemTech Res., 2010,2(2).
- Kihel, L.; Bourass, J.; Petit, J. Y.; Letourneux, Y.; Richomme, P.; Arzneimittel forschung,1996, 46 (11), 1040-1044.
- Margabandu, R.; Subramani, K., Int.J. ChemTech Res.2010,2(3).
- Esther, F.; Tibor, C., Zdenek, D.; Ivan, M., Journal of Chromatography B, 2001,753, 79–86.
- Adrian, B.; Ana C. R.; Marioara, B.; Titus, C.; Alexandru, T.; Balaban, Internet Electronic Journal of Molecular Design, 2006, 5, 237-246.
Accepted on: 19 Feb 2020


![]()


