Generation of Near-UV Absorption Band at Extremely Alkaline Ph in Colloidal Coffee
Arindam Kushagra1 and Akshaya Pandey2
1Amity Institute of Nanotechnology, Amity University, Kolkata 700135, India
2Amity Institute of Biotechnology, Amity University, Kolkata 700135, India
Corresponding Author E-mail: arindam.kushagra@gmail.com
DOI : http://dx.doi.org/10.13005/ojc/360127
Article Received on : 01-Oct-2019
Article Accepted on : 01-Jan-2020
Article Published : 14 Jan 2020
Coffee and its primary ingredient, caffeine, have been used as solar absorbers and also to increase the thermal stability and efficiency of perovskite solar cells. In this work, we have reported the generation of an optical absorption band in the near-UV region in colloidal coffee solution at extremely alkaline pH values. This generation of absorption band could be explained by the orientation of various induced dipole-dipole interactions arising from varying pH. The said generation is due to narrowing of direct as well as indirect bandgaps from 4 eV 2.8 eV & 3.4 eV2.5 eV, respectively. Additionally, we have estimated the changes in optical energy storage efficiency, inferring it to be highest for pH 11 having the highest intensity of the generated absorption band (λ_abs≈360 nm). With these observations and further deductions, the work reported in this paper would be of immense interest to the researchers working in the field of development of novel UV absorbers and also in the development of chemical pH sensors.
KEYWORDS:Chemical and Biological Sensors; Caffeine; Colloidal Coffee; Optical Absorption; pH sensor; Solute-Solvent Interactions; UV Absorber
Download this article as:| Copy the following to cite this article: Kushagra A, Pandey A. Generation of Near-UV Absorption Band at Extremely Alkaline Ph in Colloidal Coffee. Orient J Chem 2020;36(1). |
| Copy the following to cite this URL: Kushagra A, Pandey A. Generation of Near-UV Absorption Band at Extremely Alkaline Ph in Colloidal Coffee. Orient J Chem 2020;36(1). Available from: https://bit.ly/2TmGa5u |
Introduction
Coffee is one of the most consumed beverage around the world [1].Its primary constituent is caffeine, which stimulates the central nervous system [2] and is the world’s most widely consumed psychoactive substance that is legally permissible [3]. Recently, coffee and its ingredient caffeine have garnered attention of researchers working in the field of photovoltaics. Colloidal solution of coffee has been shown to be useful as a material for direct solar absorption [4] whereas caffeine has been used to improve the performance and thermal stability of perovskite solar cells [5]. Recently, an alternative way to sense extremely alkaline pH using the shape of hydrophobe-water interfaces was reported [6].
Earlier, researchers have studied the effects of pH variation on the absorption spectra of various organic compounds [7-9].In this paper, we have reported the sensing of extremely alkaline pH (11 ≤ pH ≤ 13) aided by generation of an optical absorption peak in the near-UV region when the pH of the colloidal coffee solution was within the stipulated range. However when the pH of colloidal solution was less than or equal to 10, the aforementioned absorption peak was not found. Henceforth it can be inferred that colloidal coffee has an indirect optical bandgap, which can be further modified to a lower value by the generation of a new absorption band by changing the pH of colloidal coffee. In continuation to the earlier discussion, since coffee and its ingredient caffeine have now gained attention of researchers working in the field of solar photovoltaics, this work would be of immense interest to the same group especially to those working on the bandgap engineering and further development of novel UV absorbers.
Materials and Methods
Commercially available instant coffee Nescafe Classic was used in this work. Estimated caffeine content in such products is ≈ 26 mg/g of instant coffee [10]. A stock colloidal solution of 1 mg/ml was prepared by mixing instant coffee with Milli-Q water. 0.1 ml of the colloidal coffee was taken from the prepared stock solution and mixed with 2.6 ml of Milli-Q water and 0.3 ml of aqueous solutions of varying pH (pH: 0-14) prepared by serial dilution. For the acidic phase, 35% HCl (Emplura Merck, 1.93401.0521) was taken as stock solution. Normality of the stock HCl solution was calculated to be ≈ 11.33. Since HCl is a monoprotic acid, the molarity would be same as that of normality i.e. ≈ 11.33 M. Suitable dilutions of the same were done to obtain solutions in the range of pH 0 (1 M) till pH 6 (10-6 M). Milli-Q water was taken as a neutral standard. For the alkaline phase, 1 M NaOH solution was prepared as stock using NaOH pellets (Himedia, MB095). Serial dilutions of NaOH stock were done to obtain solutions in the range pH 8 (10-6 M) till pH 13 (10-1 M). Optical absorbance and transmittance measurements were done using U-2910 Hitachi spectrophotometer.
Results and Discussion
The phenomenon of generation of optical absorption band in colloidal coffee can be depicted schematically with the aid of an E-k diagram, as shown in Fig. 1.
 |
Figure 1: E-k diagram of colloidal coffee solution showing the lowering of optical bandgap due to generation of an optical absorption peak denoted by dashed line. |
The coordinates in Fig. 1 lying on the y-axis (i.e. k=0) denote the values of direct bandgap and indirect bandgap have been shown for values k≠0 [11].Optical absorbance spectra for different pH values of colloidal coffee solution, showing the unique absorption peaks at 360 nm are evident at pH values 11-13 from the following figure, Fig. 2
 |
Figure 2: Optical absorption peaks of colloidal coffee solution at various pH values, ranging from 2-13, showing distinct peaks @ 360 nm for pH values 11-13 only. Click here to View Figure |
Absorption coefficient (a) has been calculated using the relationship
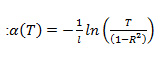
[12]. Here, l is the path length traversed by light during absorption/transmission measurements (taken to be 1 cm), T is the measured transmittance and R is reflectance. Since the measurements in this work were carried out in liquid phase, reflectance has been considered to be negligible i.e. R = 0. Direct and indirect bandgaps were calculated by Tauc plot analysis i.e. by plotting (ahn)2& (ahn)0.5 vs. hn (energy of the measured electromagnetic spectrum, in eV), respectively [13]. The calculated direct and indirect bandgaps from the Tauc plots are shown in figures 3 & 4, as follows:
 |
Figure 3: Calculation of direct bandgaps of colloidal coffee solutions at pH 10, 11, 12, 13 and at neutral pH (represented by Milli-Q water) using Tauc-plot method |
 |
Figure 4: Calculation of indirect bandgaps of colloidal coffee solutions at pH 10, 11, 12, 13 and at neutral pH (represented by Milli-Q water) using Tauc-plot method |
Generation of the said optical absorption band can be attributed to the solute-solvent interactions in colloidal coffee. These solute-solvent interactions can be described by the following analytical relationships [14], as discussed in the following equations, 1-3.
![]() (1)
(1)
where
![]()
is the change in wavenumber due to induced dipole moments accounting for solute-solvent interactions, is the wavenumber for isolated molecule in vapor phase (in this case, caffeine) & is the wavenumber of caffeine molecule in solution. & are solvent refractive index & dielectric constant, respectively. a is the molecular radius of caffeine.
![]()
are induced dipole moments in the ground & excited states and is the angle between
![]()
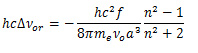
vectors. There can be different types of dipole-dipole interactions that might impact the generation of the absorption band, which can be classified into orientation interactions & dispersion force mediated interactions, respectively. As the name suggests, the orientation interactions represent the interactions of dipoles based on their orientations, as given by the relationship shown in equation 2.
 (2)
(2)
where
![]()
and me is the mass of an electron. The orientation interaction mediated wavenumber shift is affected by the increasing polarity of the solvent. The dispersion force mediated interactions happen because of the electronic structure deformations of solute and solvent leading to the generation of small temporary dipole moments. Analytically, these interactions can be represented by the relationship shown in equation 3.
![]() (3)
(3)
where
![]()
are polarizabilities of caffeine molecule in ground and excited states after interaction with the solvent medium. I&I’ represent the ionizing potentials in the ground and excited states, respectively. The dispersion force mediated interactions have a mere additive effect that is primarily impacted by the refractive index, n, of the solvent. On the basis of discussions made in context of equations 2 & 3, it can be deduced that the main reason of generation of the optical absorption band at
![]()
nm is because of the orientation interactions between caffeine and aqueous solvents at pH 11-13. Since these solvents are extremely polar in nature, the electronic structure deformation of the caffeine-base complex formed from the solute-solvent interaction would cause the temporary dipole generation, eventually leading to the generation of the said optical absorption band. We have also estimated the absorptive optical energy storage efficiency by first normalizing the transmittance values,
![]()
wavelength-dependent absorption coefficient), from 0 to 1. After normalizing, the transmittance values have been subsequently put into the following relationship that yields the energy storage efficiency [4] shown in equation 2:
![]()
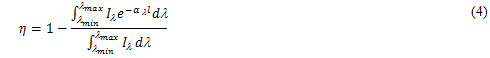
where
![]()
is the wavelength-dependent intensity of incident radiation and it has been assumed that there is no scattering of light from the colloidal sample. Since the measurements were done using a conventional spectrophotometer in laboratory settings,
![]()
can be assumed to be constant, equalling to the intensity of the lamp of spectrophotometer. The integrals given in equation 4 were solved numerically using composite trapezoidal rule [15]. The stored energy fraction, thus calculated, has been depicted in Fig. 5, with an evident increase in optical energy storage efficiency for the generated absorption band at 360 nm in the pH range 11-13.
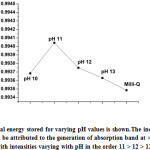 |
Figure 5: Optical energy stored for varying pH values is shown.The increase in stored energy can be attributed to the generation of absorption band |
Conclusions
In this work, we have reported the sensing of extremely alkaline pH with the aid of colloidal coffee solution and also observed the generation of an optical absorption band with an indirect bandgap of ~ 2.5 eV. As discussed earlier in the paper, coffee and its primary ingredient caffeine have found applications as solar absorbers as well as in increasing the stability & efficiency of perovskite solar cells. The results reported in this paper could be used to develop ultraviolet light absorbers with increased capacity in optically absorbed energy storage in the near-UV range of the electromagnetic spectrum, actuated by modulating pH values of the colloidal coffee solution. This work also paves way towards the development of novel chemical sensors for extreme alkaline pH based on the spectrophotometric detection.
Acknowledgment
The authors acknowledge Dr. R.R. Bhattacharjee, Head, Amity Institute of Nanotechnology, Amity University Kolkata, for fruitful discussions and insights during the course of this work.
Conflict of Interest
The authors declare no conflict of interest.
References
- Most Consumed Beverages Around the World, http://www. haleysdailyblog.com /9-most-consumed-beverages-around-the-world/, accessed on 27th December, 2019.
- Nehlig, A., Daval, J-L, G. Debry, Brain Res Rev.1992, 17, 139-170.
CrossRef - Daly, J.W., Holmen, J., Fredholm, B.B., Lakartidningen 1998,95, 5878-83.
- Alberghin, M., Morciano, M., Bergamasco, L., Fasano, M., Lavagna, L., Humbert G., Sani, E., Pavese, M., Chiavazzo, E., Asinari, P., Rep. 2019, vol. 9, Article number: 4701. doi: https://doi.org/10.1038/s41598-019-39032-5
CrossRef - Wang, R., Xue, J., Meng, L., Lee, J-W, Zhao, Z., Sun, P., Cai, L., Huang, T., Wang, Z., Wang, Z-K, Duan, Y., Yang, J.L.., Tan, S., Yuan, Y., Huang, Y., Yang, Y., Joule 2019,3, 1-14.doi:https:/ / doi.org/10.1016/ j.joule .2019 .04.005
CrossRef - Kushagra, A., Pradhan, A.K., Bazal, D., IEEE Sens. Lett. 2019,3, 4500804. doi: https://doi.org/10.1109/LSENS.2019.2921146
CrossRef - Stenstrom, W., Reinhard, M., Phys. Chem. 1925, 29, 1477-1481. doi: https://doi.org/10.1021/j150257a015
CrossRef - Robinson, E.J., Pekrul, L.F., Am. Chem. Soc. 1945, 67, 1186-1189. doi: https://doi.org/10.1021/ja01223a048
CrossRef - Zheng D, Yuan X-A, Ma H, LiX, Wang X, LiuZ, Ma J.Soc. Open Sci. 2018 5, 171928. doi: http://dx.doi.org/10.1098/rsos.171928
CrossRef - Beverages, coffee, instant, regular, prepared with water, https://fdc.nal.usda.gov/fdcapp.html#/food-details/174130/nutrients, accessed on 27th December, 2019.
- k-space diagram, https://people.eecs.ku.edu/~demarest/470/K-Space%20diagrams.pdf , accessed on 27th December, 2019.
- Benno, G., Joachim, K., Optical Properties of Thin Semiconductor Films, http://home.fnal.gov/~jkopp/tum/pdf/F/hl_spekt.pdf , 2003, accessed on 27th December, 2019.
- Suresh, D, M.S. dissertation, 2015, University of South Florida.
- Oanca, G., Nadejde, C., Creanga, D., Romanian J. Biophys.2014,24, 11-23.
- Module for The Trapezoidal Rule for Numerical Integration, http://mathfaculty.fullerton.edu/mathews/n2003/TrapezoidalRuleMod.html, accessed on 27th December, 2019.

This work is licensed under a Creative Commons Attribution 4.0 International License.
![]()
A New Edition of Web of Science
Journal Impact Factor
2022: 0.5
Five Year: 0.8
Journal is Indexed in

Cabells Whitelist
![]()


