Synergetic Performance of Graphene Oxide and Chitosan on the Removal of Direct Red 7
Department of Industrial Chemistry, School of Chemical Sciences, Alagappa University, Karaikudi - 630 003, India
Corresponding Author Email: hgprabu2010@gmail.com
DOI : http://dx.doi.org/10.13005/ojc/350623
Download this article as:
![]()
Graphene oxide/Chitosan (GOCH) composite was synthesized by hydrothermal method and structurally characterized by FT-IR, RAMAN, XRD and BET analyses which provide support for graphene oxide and chitosan incorporation. The synthesized composite was employed for the removal of direct red 7 (DR7) by batch adsorption process. Langmuir, Freundlich, Temkin, Dubinin-Radushkevic, Harkin-Jura, Scatchard plot analysis and Hasley isotherms were used to elucidate adsorption mechanism. The value of R2 revealed that isotherm was well explained by Langmuir model. The extent of monolayer adsorption capacity of GOCH was calculated as 34.2 mg/g. The pseudo first order kinetic studies were in agreement with experimental data. Thermodynamic parameters such as activation energy (Ea = 8.405 KJ/mol), enthalpy (ΔH = 89.417 KJ/mol), free energy change (ΔG) and entropy (ΔS = 0.2971 KJ/mol) were calculated. It propounded that the adsorption of DR7 on GOCH was favorable, spontaneous and an endothermic process.
KEYWORDS:Adsorption; Chitosan; Direct Red 7; Graphene Oxide
Introduction
The tremendous development of the world-wide production of industries and the discharge of their waste are considered as the two faces of a coin. Azo dyes contain one or more azo (-N=N-) and -SO3– groups. They are used as coloring agents in various industries such as paper production, textile, leather, cosmetics and food coloring. Some of the azo dyes are found to be carcinogenic and mutagenic. Release of these carcinogenic materials into the environment is a serious threat not only to aquatic eco-systems but also to human health through food chain. Hence, the treatment of wastewater before its discharge is considered as an important aspect in the view of ecology. There are three major classes of wastewater treatments available which are primary (coagulation, filtration, etc.), secondary (biological treatments) and tertiary treatments (electrochemical technique, oxidation, Ozonation, etc.). Among others, adsorption is found to be the most efficient and economical method that could be engaged for uprooting dye effluents from industries. [1–3].
Graphene oxide, the oxidation product of graphene has enormous applications in various fields like chemistry, physics, materials, energy and fuels. This two dimensional material has attractions owing to its abundant oxygen containing groups, biocompatibility, large surface area, superior mechanical strength etc. The presence of -COOH, -OH and epoxy groups are responsible of the negative charge on the surface of graphene oxide. Thus, it shows excellent performance in the adsorption of cationic dyes [4–6]. To enhance its application to adsorb anionic dyes, it is necessary to crosslink with cationic materials. Chitosan, N-deacetylated derivative of chitin, is the second abundant biopolymer which is present in the cell wall of certain fungi like mucorales strains, the exo skeleton of crustaceans, the cuticles of insects. Chitosan is recognised as an optimistic raw material for adsorption tasks owing to its characteristics like antibacterial activity, bioadhesivity, biocompatibility, biodegradability, film-forming ability, hydrophilicity and polyfunctionality. The adsorption property of chitosan is more pronounced by its cationic nature. At low pH, the amino groups get protonate which drives to adsorb an anionic species through electrostatic attraction or by means of chelation [7–11].
In this work, Chitosan/Graphene oxide composite was prepared by hydrothermal method using an autoclave. The synthesized composite was applied to adsorb Direct red 7 dye and the adsorption was studied by thermodynamic and equilibrium studies.
Materials and Methods
Direct red 7 was purchased from Sigma Aldrich and graphite powder from LOBA Chemie. All other reagents such as sodium nitrate, sulfuric acid, potassium permanganate, hydrogen peroxide and ethanol were purchased from Sisco Research Laboratory chemicals. Millipore water was used for the preparation of solutions.
Preparation of Chitosan/Graphene Oxide Composite
Modified Hummers method [12] was employed for the preparation of graphene oxide. 5 g of graphite powder was mixed well with 125 mL of concentrated sulfuric acid using magnetic stirrer. 12.5 g of sodium nitrate was added to the above mixture in an ice cold condition with continuous stirring. 40 g of Potassium permanganate was added slowly to the reaction mixture and followed by hydrogen peroxide. The above additions were carried out in an ice cold condition to avoid effervescence. The reaction mixture was under stirring for about 16 h. The yellow colored slurry obtained was centrifuged, washed numerous times with deionized water to get neutral pH. It was dried to get brown colored graphene oxide powder. The as prepared graphene oxide was added with 5 g chitosan suspended in acetic acid solution and heated continuously for 24 h at 160°C in a Teflon coated stainless steel autoclave. The mixture was neutralized with NaOH and washed with ethanol followed by distilled water and dried.
Characterization Techniques
A double beam UV-Vis spectrophotometer (UV-2401 PC, SHIMADZU) was employed for analyzing solution of direct red 7 at a wavelength of 514 nm. FT-IR spectra of the analyte were measured within the range of 4000 to 400cm-1 on FT-IR-4600 type A using KBR pellet. XRD patterns were obtained by using an X’Pert PRO analytical diffractometer using Cu Kα radiation at 298 K. Raman spectra was obtained using Micro-Laser Raman (Seiki, Japan). BET surface area was analyzed by GEMINI M 2380.
Adsorption Experiments
The stock solution of DR7 was prepared by using deionized water. The batch experiment was carried out at room temperature with constant agitation speed. The influence of criteria such as adsorbent dosage (0.01 – 0.06 g), pH (3, 5, 9, 11, 13), initial dye concentration (10 – 60 ppm), temperature (303 – 333 K), contact time (5 – 120 min) were experimented. The Erlenmeyer flasks containing GOCH and DR7 were stirred in thermostatic water bath shaker at predetermined time. After completion of each experiment, the dye and GOCH composite were separated by means of centrifugation. The optical density of the centrifugate was scrutinized by UV-Vis spectrophotometer at a wavelength of 512 nm.
The extent of adsorption of DR7 on GOCH was quantified using the equations
Where, qe – The amount of DR7 (mg/g) adsorbed at the equilibrium,
Ci – The initial concentration of DR7 before adsorption,
Ce – The equilibrium concentration of DR7 after adsorption
m – Weight of GOCH composite.
Results and Discussion
Characterization
The BET analysis results revealed that the surface area of GOCH is 31.1791 m2/g with an average pore size of 2.5476 nm and average pore volume of 0.019854cm3/g.
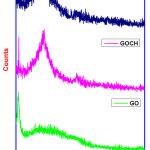 |
Figure 1: XRD pattern of GOCH composite Click here to View Figure |
The crystalline nature and interlayer spacing of GO and GOCH composite were studied by powder XRD analysis and the obtained results are shown in Figure 1. A characteristic crystalline peak at an angle (2q) of 11.34° is due to graphene oxide and an amorphous peak around 24° is corresponds to the presence of chitosan. A significant change in the XRD patterns of GOCH and GOCH-AT are noticed that encompasses the adsorption of the dye on the composite.
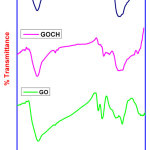 |
Figure 2: FT-IR spectra of GO, GOCH, GOCH-AT Click here to View Figure |
FT-IR spectra of GO, GOCH, GOCH-AT are shown in Figure 2. The spectrum of GO shows the peaks at 3405 and 1719 cm-1 corresponds to O-H and C=O stretching vibrations of -COOH group. The peaks at 1611, 1223 and 1047 cm-1 indicates the presence of C=C stretching of sp2 carbon skeleton, C-O-C and C-O stretching vibrations, respectively. The absence of peaks at 1611, 1223 and 1047 cm-1 and presence of new peaks at 1584 and 1118 cm-1 which are related to N-H bending of NH2 and glycopyranose ring during grafting indicates the successful incorporation of graphene oxide with chitosan [13]. The grafting might be occurred through -COOH and epoxy groups present in GO.
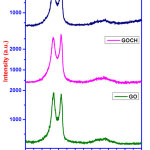 |
Figure 3: RAMAN spectra of GO, GOCH, GOCH-AT Click here to View Figure |
Raman spectroscopy is a tool to analyze the structure as well as the quality of carbon materials. The measured Raman data are shown in Figure 3. The D band which spells the extent of defects were down shifted from 1360 to 1336 cm-1 and G band correspond to E2g vibration of sp2 domain from 1575 to 1571 cm-1 reveal the strong interaction between GO and chitosan [14].
Adsorption parameter studies
Effect of initial dye concentration
When the concentration of DR7 is increased from10 to 60 ppm, the percentage of dye removal decreased as 59 to 24%, respectively. This is ascribed to unavailability of dynamic sites on the adsorbent surface due to saturation with dye molecules. But the adsorption capacity gets elevated from 11.8 to 28.8 mg/g which is pronounced by the holding capacity of adsorbent and the thrust for the mass transfer of DR7 to GOCH composite [15].
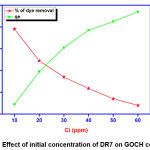 |
Figure 4: Effect of initial concentration of DR7 on GOCH composite Click here to View Figure |
Effect of adsorbent dosage
The consequences of adsorbent dosage were examined by altering adsorbent dose from 0.01 – 0.06 g of GOCH composite. The amount of adsorption as well as percentage of dye removal increases with escalating GOCH. The increase in percentage removal of DR7 (27.2 – 96%) was observed due to existence of numerous active sites on the adsorbent surface.
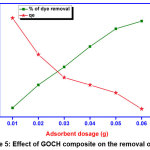 |
Figure 5: Effect of GOCH composite on the removal of DR7 Click here to View Figure |
Effect of pH
Surface charge as well as the dissociation of functional groups can be changed by altering the pH values [16]. At low pH, the amino groups in GOCH composite gets protonated, makes the adsorbent surface more positive and thus produces more adsorbing sites. Adsorption capacity value attained maximum at pH 3 and then decreased by increasing pH. This is due to decrease in the availability of protonated amino groups and the presence of more hydroxyl groups which induce the ionic repulsion between DR7 dye and adsorbent GOCH [17]. The effect of pH was displayed by plotting the pH (3, 5, 9, 11 and 13) versus their respective removal efficiency (%) and the result obtained were displayed in Figure 6.
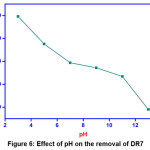 |
Figure 6: Effect of pH on the removal of DR7 Click here to View Figure |
Effect of contact time
Contact time is a key to identify dye-adsorbent relationship. It determines the magnitude of the adsorption on the effluent. The effect of contact time was investigated using 0.01g GOCH composite and 20 ml of DR7 solution at different time interval between 5-120 min. The adsorption capacity of GOCH increases rapidly within 20 min and then gradually attained equilibrium with slow rate. This is due to presence of numerous unoccupied adsorption sites on the GOCH surface at initial stage.
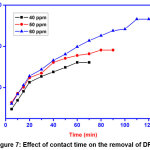 |
Figure 7: Effect of contact time on the removal of DR7 Click here to View Figure |
Adsorption isotherms
The adsorption isotherm is a graphical representation that provides the information about the adsorbate – adsorbent interaction. It is obtained from the data of initial dye concentration. In this study, Langmuir, Freundlich, Temkin, Dubinin-Radushkevic, Harkin-Jura, Scatchard-plot analysis and Hasley isotherms are employed to encounter the mechanism of adsorption between GOCH and DR7.
Langmuir adsorption isotherm
This is appropriate only for adsorption on the single surface that having fixed number of identical adsorption sites.
Where, q0 – Maximum monolayer coverage capacity (mg/g)
KL – Langmuir isotherm constant (L/mg).
The values of q0 and KL are calculated by plotting the graph between Ce/qe Vs Ce. The dimensionless separation factor, RL = 1/[1 + (1 + KLC0)] represents the nature of adsorption. If, RL = 1 linear, RL > 1 unfavorable, 0<RL<1 favorable, and RL =0 irreversible adsorption will take place.
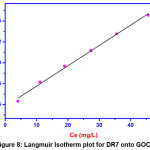 |
Figure 8: Langmuir Isotherm plot for DR7 onto GOCH Click here to View Figure |
From the figure we noticed that the value of RL is obtained as 0.252 which lies between 0 – 1, indicates that the adsorption of DR7 on GOCH is favorable. The maximum monolayer adsorption is found to be 34.20 (mg/g). The R2 value (0.998) showed that the adsorption data was fitted well with Langmuir adsorption isotherm model.
Freundlich adsorption isotherm
Freundlich adsorption model describes the heterogeneity of the adsorbent surface.

Where, Kf – Freundlich constant
n – Adsorption intensity (n = 1 – 10).
If, n= 1, the segregation between solid and liquid phases are independent of concentration
1/n <1, normal adsorption
1/n >1, cooperative adsorption
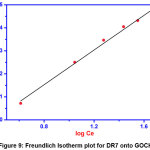 |
Figure 9: Freundlich Isotherm plot for DR7 onto GOCH Click here to View Figure |
Higher the n value represents the better in adsorption. The values of KF and n can be obtained from the slopes and intercepts of the linear plots of log qe Vs log Ce. From table 1, the value of KF is noted as 7.102. The appraisal of 1/n (0.377) falls between 0 to 1 indicating favorable conditions for physical adsorption [18].
Temkin adsorption isotherm
The Temkin isotherm depicts the relation between the adsorbent – adsorbate interactions. The impacts of these interactions are mainly due to linear decrease in heat of adsorption of layer molecules irrespective of its concentration.
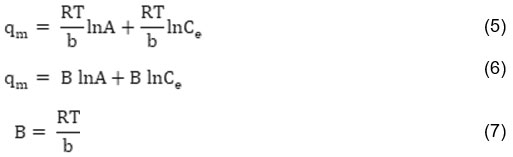
Where, A – Temkin isotherm equilibrium binding constant (L/g),
B – Constant related to heat of adsorption (J/mol),
R – Universal gas constant (8.314 J/mol/K)
T – Temperature at 303 K.
The constants A and B can be derived from the slope and intercept by plotting qe Vs lnCe.
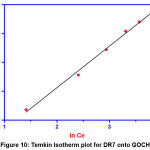 |
Figure 10: Temkin Isotherm plot for DR7 onto GOCH Click here to View Figure |
From the table 1, it is found that the temkin isotherm has binding constant 1.474 (mg/g) and the heat of adsorption 349.35 KJ/mol, indicates chemical adsorption process.
Dubinin-Radushkevic (D-R) adsorption isotherm
D-R isotherm is based on Gaussian – energy distribution which is suitable to describe the adsorption on heterogeneous surfaces. The physical or chemical nature of the adsorption process is predicted by the apparent energy calculated from this model.
![]()
Where, qs – Theoretical isotherm saturation capacity (mg/g),
Kd – Dubinin-Radushkevich isotherm constant (mol2/KJ2),
ε – Polanyi potential which can be calculated as ε = RTln (1 + 1/Ce),
The correlation between the apparent energy of adsorption and the activity coefficient (β) can be described as E = 1/(2β)1/2. The value of 2β is obtained from the slope of the plot lnqe Vs ε2. The value of E is the tool to identify the nature of adsorption process that is the E value below 8 KJ/mol represents the physical adsorption and in the range of 8 to16 KJ/mol favors the chemical ion-exchange mechanism. From the table1, value of E is observed as 4.3744 KJ/mol related to physical adsorption process of DR7 on GOCH composite.
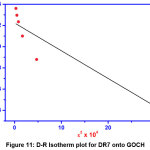 |
Figure 11: D-R Isotherm plot for DR7 onto GOCH Click here to View Figure |
Harkin-Jura isotherm
It is based on the assumption that heterogeneous pore distribution is responsible for multilayer adsorption.
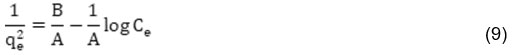
Where, A and B are isotherm constants which is obtained by plotting log 1/qe2 Vs log Ce
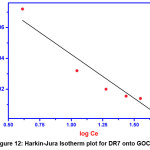 |
Figure 12: Harkin-Jura Isotherm plot for DR7 onto GOCH Click here to View Figure |
The value of R2 (0.8997) reveals that H-J isotherm is least fit to the DR7 adsorption on GOCH composite.
Halsey isotherm
The isotherm model that attests the multilayer adsorption is Halsey isotherm.
The plot between lnqe and lnCe gives a straight line with R2 value of 0.99 indicates the existence of heteroporous nature of the GOCH composite.
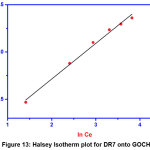 |
Figure 13: Halsey Isotherm plot for DR7 onto GOCH Click here to View Figure |
Scatchard plot (SP) analysis
It is an independent site oriented model that used to analyze the affinity between binding sites and the dye molecules. The equation that represents Scatchard plot analysis is as follows
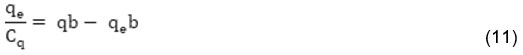
The straight line from the graph between qe/Ce Vs qe determines the nature of binding sites that is whether they are homogenous or heterogeneous. The value of correlation coefficient R2 (0.9357) shows deviation from linearity confirms the presence of heterogeneous binding sites on the surface of GOCH composite which favors the effective adsorption of dye molecules.
 |
Figure 14: Scatchard plot analysis for DR7 onto GOCH Click here to View Figure |
Table 1: Isotherm constants for the adsorption of DR7 onto GOCH
| Isotherm | Parameters | R2 |
| Langmuir | KL (L/mg) – 0.252 qm (mg/g) – 34.2 |
0.998 |
| Freundlich | KF (L/mg) – 7.102 1/n – 0.377 |
0.996 |
| Temkin | At (mg/g) – 1.47465 bt – 349.7546 B0 (L/mg) – 7.2026 |
0.9944 |
| Dubinin-Radushkevich | E (KJ/mol) – 4.3744 β – 0.02613 qD – 25.26 |
0.8094 |
| Harkin-Jura | A – 176.37 B – 1.7478 |
0.8997 |
| Hasley | n – 2.654 K – 53.27 |
0.99065 |
| Scatchard Plot | Q – 32.65 b – 0.12686 |
0.93575 |
By comparing the value of R2, the best fitted isotherm equation is ordered as: Langmuir > Freundlich > Temkin >Scatchard-Plot analysis > Halsey > Harkin-Jura > Dubinin-Radushkevich.
Kinetics Studies
The best adsorbent should have large adsorbent capacity and fast adsorption rate. The adsorption rate provides the information about the fastness of the chemical reaction and factors that affect it. To examine the adsorption kinetics of DR7 on GOCH composite, pseudo first order, pseudo second order, Elovich and Intra particle diffusion models were employed. The linear forms of the kinetic equations are listed in the table 2.
Table 2: Equations (12-15) for kinetic models
| Kinetic model | Linear equation | Plot |
| Pseudo first order | Log (qe – qt) = logqt – K1t | Log (qe – qt) Vs t |
| Pseudo second order | t/qt = (1/K2qe2) + t/qe | t/qe Vs t |
| Elovich | qe = β log (αβ) + β log t | qe Vs log t |
| Intra particle diffusion model | qe = Kid t1/2 + I | qe Vs t1/2 |
Where, K1– Pseudo first order rate constant
K2 – Pseudo second order rate constant
α – Initial adsorption rate
β – Desorption constant
Kid – Intra particle diffusion rate constant
I – Boundary layer thickness constant.
The values of various parameters calculated using the plots are shown in table 2 and their results are given in the table 3.
Table 3: Constants and correlation coefficient values of kinetic models
| Kinetic model | Parameters | 40 ppm | 50 ppm | 60 ppm |
| qe(exp) | 32.2 | 38.2 | 51.6 | |
| Pseudo first order | qe | 28.57 | 33.113 | 46.558 |
| K1 | 0.04836 | 0.0415 | 0.021 | |
| R2 | 0.991 | 0.994 | 0.991 | |
| Pseudo second order | qe | 41.66 | 45.45 | 66.66 |
| K2 | 1.32 x 10⁻³ | 1.326 x 10 -3 | 0.45 x 10 -3 | |
| R2 | 0.996 | 0.995 | 0.979 | |
| Elovich | Α | 0.0252 | 0.03 | 1.184 x 10⁻¹² |
| Β | 20.96 | 21.93 | 31.06 | |
| R2 | 0.990 | 0.987 | 0.970 | |
| Intraparticle diffusion model | Kid | 3.741 | 3.597 | 4.705 |
| I | 3.233 | 6.637 | 2.876 | |
| R2 | 0.959 | 0.963 | 0.995 |
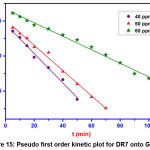 |
Figure 15: Pseudo first order kinetic plot for DR7 onto GOCH Click here to View Figure |
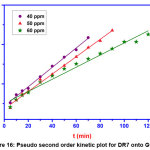 |
Figure 16: Pseudo second order kinetic plot for DR7 onto GOCH Click here to View Figure |
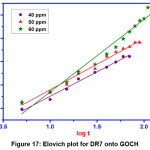 |
Figure 17: Elovich plot for DR7 onto GOCH Click here to View Figure |
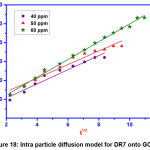 |
Figure 18: Intra particle diffusion model for DR7 onto GOCH Click here to View Figure |
Pseudo first order model is valid only for adsorption process at the initial stage. Pseudo second order kinetics assumes that rate is proportional to the available active sites. From the table 3, the results illustrate that the first order kinetics was found to be fitted well to describe the adsorption mechanism of DR7 onto GOCH, as the value of qe experimental were consistent with the qe calculated. Elovich kinetic equation describes chemical adsorption. The diffusion mechanism of adsorption process may be understood from intra particle diffusion model. The first stage was the sharper portion represents the mass transfer of dye molecules from bulk solution to the external surface of GOCH composite. The second stage was the gradual adsorption due to pore diffusion. As the plot, qe Vs t1/2 gave the value of r2 close to unity and kid was higher, indicating intra particle diffusion was a rate controlling step in the adsorption of DR7 onto GOCH at 60ppm. The boundary thickness was determined from the value, I and the larger I value indicates the greater boundary layer diffusion effect [19].
Thermodynamic parameters
Temperature is a key factor to identify whether the adsorption is an endothermic or exothermic process. Increase in adsorption tendency with the temperature is spelled by the mobility of dye molecules as well as availability of effective sites on adsorbent surfaces which caused by the swelling effect within the core of the adsorbent and leads to the endothermic process and vice versa. It is reverse in the case of exothermic process.
The parameters such as enthalpy (ΔH0), entropy (ΔS0) and free energy change (ΔG0) can be measured from the following equations
ΔG0= ΔH0 – TΔS0 (12)
ΔG0 = RT lnK0 (13)
The values of ΔH0 and ΔS0 can be obtained from the slopes and the intercepts of the plot, lnKL Vs 1/T.
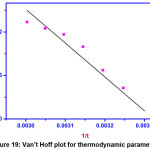 |
Figure 19: Van’t Hoff plot for thermodynamic parameters Click here to View Figure |
Table 4: Thermodynamic parameters for DR7 adsorbed by GOCH composite
| Temperature (K) | ΔG0 (KJ/mol) | ΔH0 (KJ/mol) | ΔS0 (KJ/ mol) |
| 303 | -0.6043 | 89.417 | 0.2971 |
| 308 | -2.0898 | ||
| 313 | -3.5753 | ||
| 318 | -5.0608 | ||
| 323 | -6.5463 | ||
| 328 | -8.0318 | ||
| 333 | -9.5173 |
From the table (4), it is observed that ΔG0 has negative values. This implies that the adsorption process is thermodynamically favorable and spontaneous. The values of ΔG0 within the range of 0 – 20 KJ/mol indicate that the adsorption process is physical in nature. The positive value of ΔS0 also suggests the physi-sorption and increased randomness between GOCH and DR7 interface during adsorption. ΔH0 value, 89.417 KJ/mol higher than 40 KJ/mol indicates that the adsorption process is chemical in nature. The obtained ΔH0 value stipulates an endothermic process and is responsible for the energy requires removing the hydration shell for mobility of dye molecules to reach the adsorption sites.
The activation energy, Ea can be measured using modified Arrhenius equation
Log (1–q) = log S* + Ea/RT (14)

Where, S* is the sticking probability of adsorbate on the surface of adsorbent. The plot between log (1-q) and 1/T gives the slope and intercept from which Ea and S* can be calculated. The value of Ea is obtained to be 8.405 KJ/mol and S* is to be 792.50.
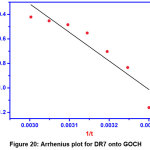 |
Figure 20: Arrhenius plot for DR7 onto GOCH Click here to View Figure |
Prediction on type of adsorption
Many researchers have an opinion that adsorption mechanism could not be predicated by the results obtained from kinetic data. It is necessary to elucidate from four parameters such as enthalpy ΔH, activation Ea, mean free energy E = 1/(2β)1/2 and the effect of temperature [20].
Table 5: Parameter values which differentiate physical and chemical adsorption
| Parameters | Physical adsorption | Chemical adsorption |
| ΔH (KJ/mol) | < 20 | > 40 |
| Ea (KJ/mol) | 5-40 | 40-800 |
| E (KJ/mol) | < 8 | 8-16 |
| Effect of temperature | Exothermic | Endothermic |
In this study, we obtained the values for ΔH = 89.417 KJ/mol, Ea = 8.405 KJ/mol, E = 4.3744 KJ/mol and the effect of temperature was endothermic. Many literatures have predicted that both physical as well as chemical adsorption may occur simultaneously on the surface of the adsorbent [21, 22]. From the above point of view and the results that derived, it was inferred that adsorption of DR7 on GOCH composite was both physical and chemical in nature.
The outcome of the investigation revealed that GOCH composite was a valid adsorbent for the elimination of DR7 from waste water. The maximum adsorption capacity of GOCH composite was 34.2 mg/g with surface area of 31.179 m2/g. Pseudo second order was identified as the best fit of kinetic data. The activation energy for adsorption of DR7 on GOCH composite was obtained as 3.209 KJ/mol.
Compliance with Ethical Standards
Conflict of Interest
The authors declare that they have no conflict of interest.
References
- Dotto, G. L.; Moura, J. M.; Cadaval, T. R. S.; Pinto, L. A. A. Chemical Engineering Journal. 2013, 214, 8-16.
- Patil, S.; Renukdas, S.; Patel, N. International Journal of Environmental Sciences. 2011, 1, 711-725.
- Vijayakumar, G.; Tamilarasan, R.; Dharmendirakumar, M. Journal of Materials and Environmental Science. 2012, 3, 157-170.
- Cheng, Z.; Liao, J.; He, B.; Zhang, F.; Zhang, F.; Huang, X.; Zhou, L. ACS Sustainable Chemistry and Engineering. 2015, 3, 1677-1685.
- Chen, Y.; Chen, L.; Bai, H.; Li, L. Journal of Materials Chemistry A. 2013, 1, 1992-2001.
- Kyzas, G. Z.; Deliyanni, E. A.; Matis, K.; Roy, S. S. RSC Adv. 2014, 4, 3823.
- Ignat, M.; Dulman, V.; Onofrei, T. Cellulose Chemistry and Technology. 2012, 46, 357-367.
- Shashikala, M.; Nagapadma, M.; Pinto, L.; Nambiar S, N. International Journal of Development Research. 2013, 3, 40-44.
- Zhao, H.; Jiao, T.; Zhang, L.; Zhou, J.; Zhang, Q.; Peng, Q.; Yan, X. Science China Materials. 2015, 58, 811-818.
- Wan Ngah, W. S.; Teong, L. C.; Hanafiah, M. A. K. M. Carbohydrate Polymers. 2011, 83, 1446-1456.
- Kahya, N.; Bener, S.; Kaygusuz, H.; Evingur, G. A.; Erim, F. B. Chemical Engineering Communications. 2018, 1, doi: 10.1080/00986445.2017.1423064.
- Lu, L.; Wang, J.; Chen, B. Environmental Pollution. 2018, 232, 505-513.
- Sabzevari, M.; Cree, D. E.; Wilson, L. D. ACS Omega. 2018, 3, 13045-13054
- Sahoo, S. K.; Hota, G. ACS Appl. Nano Mater. 2019, doi:10.1021/acsnm.8b02286
- Zhu, X.; Zhang, Z.; Yan, G. Journal of Water and Environment Technology. 2016, 14, 96-105.
- Das, T. R.; Patra, S.; Madhuri, R.; Sharma, P. K. Journal of Colloid and Interface Science. 2018, 509, 82-93.
- Zhou, Z.; Lin, S.; Yue, T.; Lee, T. C. Journal of Food Engineering. 2014, 126, 133-141.
- Nuengmatcha, P.; Mahachai, R.; Chanthai, S. Oriental Journal of Chemistry. 2016, 32, 1399-1410.
- Taqui, S. N.; Yahya, R.; Hassan, A.; Nayak, N.; Syed, A. A. International Journal of Phytoremediation. 2017, 19,
- Gupta, V. K.; Jain, R.; Shrivastava, M.; Nayak, A. Journal of Chemical and Engineering Data. 2010, 55, 5083-5090.
- Albadarin, A. B.; Solomon, S.; Daher, M. A.; Walker, G. Journal of the Taiwan Institute of Chemical Engineers. 2018, 82, 144-155.
- El-Araby, H. A.; Ibrahim, A. M. A.; Mangood, A. H.; Abdel-Rahman, A. A. H. Journal of Geoscience and Environment Protection. 2017, 5, 109-152.
Accepted on: 07-11-19


![]()


