Simultaneous Immunochromatographic Assay of Several Antibiotics: Modulation of Detection Limits and Working Ranges
Nadezhda A. Byzova , Anatoly V. Zherdev and Boris B. Dzantiev*
A.N. Bach Institute of Biochemistry, Research Center of Biotechnology of the Russian Academy of Sciences, Leninsky prospect 33, 119071 Moscow, Russia
Corresponding Author Email: dzantiev@inbi.ras.ru
DOI : http://dx.doi.org/10.13005/ojc/350603
Article Received on : 14-11-19
Article Accepted on : 13-12-19
Article Published : 28 Dec 2019
This paper considers the combination of several immunochemical interactions for multiplex immunochromatographic analysis. It was shown that varying the composition of the gold nanoparticles–antibodies conjugate, its concentration and concentration of the hapten–protein conjugate changes both the maximal binding in the test zone and the range of the determined concentrations of the target analyte. Thus, it becomes possible to compensate for differences in the interaction times for the reagents of different specificities that arise when they are combined on one test strip. These regularities were demonstrated for multiplex analysis of three antibiotics. The developed assay has limits of detection of 10, 500, and 10 ng/mL for chloramphenicol, streptomycin, and ampicillin, respectively. Its working ranges for these three analytes are 0.5–6, 16–250, and 0.4–5 ng/mL. The analysis time is 15 min; the accuracy of the photometric determination of antibiotics in the working ranges is up to 6%.
KEYWORDS:Antibiotics; Colloidal Gold; Immunoassay; Lateral Flow; Test Strip
Download this article as:| Copy the following to cite this article: Simultaneous Immunochromatographic Assay of Several Antibiotics: Modulation of Detection Limits and Working Ranges. Orient J Chem 2019; 35(6). |
| Copy the following to cite this URL: Simultaneous Immunochromatographic Assay of Several Antibiotics: Modulation of Detection Limits and Working Ranges. Orient J Chem 2019; 35(6). Available from: https://bit.ly/2MBo3V3 |
Introduction
Currently, a highly demanded analytical task is the identification and assessment of the content of antibiotics for both monitoring the effectiveness of antibiotic therapy and assessing the safety of food products of animal origin. Having knowledge about the transformation and removal of antibiotics from the human body during their therapeutic use allows for choosing an individual dosage of drugs, identifying antibiotic resistance of pathogens, and thus promptly adjusting the therapeutic measures [1]. Prevention of the consumption of foods contaminated with antibiotics (as a result of their illegal use in animal husbandry) eliminates their toxic effects as well as the selection of resistant strains [2]. This monitoring requires simple and cheap analytical tools that can be used directly at the sampling sites. To date, the most promising means of solving this problem are immunochromatographic test systems. In these systems, all the reagents required for analysis are applied to a multimembrane composite (test strip). After the contact of the test strip with the analyzed liquid sample initiates specific interactions are initiates and continued during the movement of the sample under capillary forces. contact of the test strip with the analyzed liquid sample specific The assay is finalized by the coloration of certain lines of the test strip, indicating the presence or absence of the controlled compound in the sample [3].
The implementation of this principle allows for receiving the analysis results in 10–15 min—for both qualitative (the presence or absence of staining, based on which the antibiotic content in the sample can be compared with a predetermined threshold level) and quantitative (coloration intensity, reflecting the concentration of the antibiotics).
Note that a significant variety of antibiotics necessitates their simultaneous control in the samples. This principle has been successfully implemented by multiplex immunochromatographic tests in which several binding zones with reagents of different specificity were applied along the strip [4]. However, combining reagents for analysis of several compounds on a single test strip is not an easy task, even if monoparametric analysis has been successfully implemented for them. The need to arrange the binding zones at different distances leads to changes in the modes of interaction of the reagents during immunochromatography, primarily the changed time of the reaction until the liquid reaches the binding zone.
In this article, the previously described immunochromatographic analyses for three antibiotics from different chemical classes—chloramphenicol (CAP), streptomycin (STR), and ampicillin (AMP) [5-7]—are combined into one test system (Figure 1). The possibilities of varying the conditions of reagent interactions are characterized. The changing parameters are selected to modulate both the intensity of coloration in the binding zones and the working ranges of analyte determination.
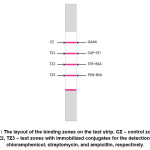 |
Figure 1: The layout of the binding zones on the test strip. CZ – control zone, TZ1, TZ2, TZ3 – test zones with immobilized conjugates for the detection of chloramphenicol, streptomycin, and ampicillin, respectively. Click here to View Figure |
Materials and Methods
Chemicals and reactants
Streptomycin was purchased from AppliChem (Darmstadt, Germany). Сhloramphenicol, chloramphenicol succinate, ampicillin, chloroauric acid, sucrose, sodium azide, sodium citrate, bovine serum albumin (BSA), Tween-20, Triton X-100 were purchased from Sigma-Aldrich (St. Louis, MO, USA). N-Hydroxysuccinimide (HS), 1-cyclohexyl-3-(2-morpholino-ethyl)carbodiimide metho-p-toluence sulphonate, trypsin inhibitor from soybean (TIS), and N,N-dimethylformamide were purchased from MP Biomedicals (Washington, DC, USA). Monoclonal antibodies against CAP (clone CAPB10) and monoclonal antibodies against STR (clone C33B4) were purchased from the All-Russian Research Centre of Molecular Diagnostics and Therapy (Moscow, Russia). Monoclonal antibodies against AMP (clone ANPH4) and penicillin-BSA (PEN–BSA) conjugate were purchased from DCN (Carlsbad, CA, USA). Goat anti-species (anti-mouse) immunoglobulins (GASI) were purchased from Arista Biologicals (Allentown, PA, USA). Analytical grade of purity was chosen for all reagents.
The chloramphenicol succinate was covalently attached to TIS using the succinimide ester method as described in [5]. Streptomycin was coupled to BSA according to [6]. The syntheses of gold nanoparticles (GNPs) and their conjugates were implemented using deionized water (18 MΩ·cm at 25 °C) that was obtained using the Millipore Simplicity system (Millipore, Bedford, MA, USA).
Four kinds of membranes, namely (i) nitrocellulose membrane CNPF (pores = 10 μm), (ii) conjugate release membrane PT-R7, (iii) separation membrane GFB-R4, and (iv) absorption membrane AP045 (Advanced Microdevices; Ambala Cantonment, India) were used for test strips manufacturing.
Syntheses of GNPs and their conjugates with antibodies
GNPs were obtained from chloroauric acid through the technique of citrate reduction described in [8]. The dimensions of the synthesized GNPs were determined using a transmission electron microscopy.
GNPs were conjugated with the antibodies against CAP (CAPB10), STR (C33B4) and AMP (AMPH4) according to earlier chosen conditions [5-7]. A GNPs solution (the optical density at 520 nm, OD520, = 1.0, pH 9.0) was added to CAPB10, C33B4, and AMPH4 antibodies at concentrations of 12, 6, and 3 μg/mL for each antibody solution. The mixtures were incubated for 30 min at room temperature under stirring. Then a BSA was added to its final concentration of 0.25%. Thje conjugates were separated by centrifugation (30 min, 10,000 g), resuspended in 0.02 M of Tris-HCl buffer, pH 7.6, with 1.0% BSA, 1% sucrose, 0.25% Tween 20, 0.1% NaN3, and stored at 4–6 °C.
Manufacturing Immunochromatographic Test Strips
The IsoFlow dispenser (Imagene Technology, Hanover, NH, USA) was used for reactants applying. GASI antibodies (0.25 mg/mL) formed a control zone (CZ). For test zones 1–3 (TZ1–TZ3), conjugates CAP–STI (0.25 mg/mL), STR–BSA (0.25 mg/mL), and PEN–BSA (0.2 mg/mL) were used. The all reactants were used in the dosage 2.0 μL per cm.
GNP conjugates were taken in OD520 = 4.0 or 5.0, mixed in equal volumes, and applied on the PT-R7 membrane (16.0 μL per cm). The next stage was drying at room temperature during one day. Then, the membranes were assembled in sheets and cut into strips 3.5 mm wide.
Immunochromatographic Analysis
Assaying and processing of the obtained images of the test strips was performed as desribed eatlier for monotests [5-7], the assay procedure indcuded sample preparation (5 min) and lateral flow stage (10 min).
Results
GNPs, which were obtained by the Frens method, were used as a label. Transmission electron microscopy showed a high uniformity in size characteristics of the nanoparticles. The average value of the maximum axis was 37 nm and of the minimum axis – 30 nm. Thus, an average diameter was equal to 34 nm, which corresponds to the recommendations of 30–40 nm lateral flow techniques [9].
To assess the antibody immobilization on the GNPs’ surface, so-called flocculation curves were obtained by mixing GNPs with different concentrations of antibodies, incubating them for 10 min, and mixing them with a 10% sodium chloride solution (v/v = 12:1). According to the existing concept of GNPs flocculation [10], the optical density at 580 nm (OD580) reflects the aggregation of nanoparticles due to their surface without stabilizing proteins (antibodies). Thus, the reaching of a minimum value of OD580 indicates the completeness of surface stabilization by a protein monolayer. A typical flocculation curve obtained in our experiments is shown in Figure 2. For all three analytical systems considered in the work, the point of a plateau reaching for OD580 corresponded to a concentration of 10 μg/mL. Based on this result and literature recommendations [10], antibody concentrations of 12 μg/mL (the point of a plateau +20% = complete saturation), 6 μg/mL (50% saturation), and 3 μg/mL (25% saturation) were used when conjugating antibodies against chloramphenicol, streptomycin, and ampicillin, respectively, with GNPs.
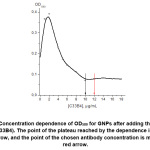 |
Figure 2: Concentration dependence of OD580 for GNPs after adding the anti-STR antibody (C33B4). The point of the plateau reached by the dependence is marked by the black arrow, and the point of the chosen antibody concentration is marked by the red arrow. Click here to View Figure |
Three parameters that reflect the composition and consumption of reagents in the manufacture of the tests were used to modulate the concentration dependences of immunochromatography, namely (i) the antibody to GNP ratio in their conjugate, (ii) the amount of GNPs–antibody conjugate used on one strip, and (iii) the amount of hapten–protein conjugate used on one strip. Earlier, for monoparametric immunochromatographic systems, the given varying tools allowed us to shift the working range of competitive immunochromatographic analyses by an order of magnitude or more [11]. In the framework of this study and using these tools, it was necessary to compensate for losses in the detection limit and working range that occurred when the localization of the binding zone of specific reagents changed, and, accordingly, the duration of the interaction of immunoreagents in a moving fluid flow changed.
The observed effects of the influence of these parameters on the course of the concentration dependences of the determination of individual compounds in a multiplex test system are presented by the examples of chloramphenicol and streptomycin. Figure 3 shows that a decrease in antibody concentrations upon conjugation with GNPs from 6 to 3 µg/mL for the CAPB10 antibody and from 12 to 6 µg/mL for the C33B4 antibody allowed the CAP and STR detection limits to be reduced to 10 and 500 ng/mL, respectively. However, the signal amplitudes also decreased by 2–2.5 times. A similar effect was achieved by decreasing the OD520 of GNPs–antibody conjugates from 5 to 4 optical units (Figure 4) and by decreasing the applied amounts of hapten–protein conjugates (Figure 5). With the simultaneous variation of three parameters, the limits of detection of САР and STR decreased 10 (from 100 to 10 ng/mL) and 8 (from 4,000 to 500 ng/mL) times, respectively. When OD520 of the GNPs–CAPB10 and GNPs–C33B4 conjugates were equal to of 5 and 4 optical units, and concentrations of CAP–STI and STR–BSA conjugates were equal to 0.25 mg/mL, the limits of CAP and STR detection reached 10 and 500 ng/mL, respectively.
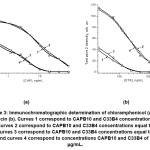 |
Figure 3: Immunochromatographic determination of chloramphenicol (a) and streptomycin (b). Curves 1 correspond to САРВ10 and С33В4 concentrations equal to 6 μg/mL, curves 2 correspond to САРВ10 and С33В4 concentrations equal to 6 and 12 μg/mL, curves 3 correspond to САРВ10 and С33В4 concentrations equal to 3 and 6 μg/mL and curves 4 correspond to concentrations CAPB10 and C33B4 of 3 and 12 µg/mL. Click here to View Figure |
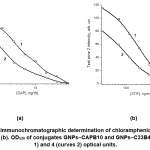 |
Figure 4: Immunochromatographic determination of chloramphenicol (a) and streptomycin (b). ОD520 of conjugates GNPs–CAPB10 and GNPs–C33B4 are 5 (curves 1) and 4 (curves 2) optical units. |
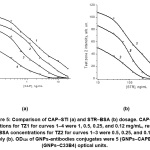 |
Figure 5: Comparison of CAP–STI (a) and STR–BSA (b) dosage. CAP–STI concentrations for TZ1 for curves 1–4 were 1, 0.5, 0.25, and 0.12 mg/mL, respectively (a). STR–BSA concentrations for TZ2 for curves 1–3 were 0.5, 0.25, and 0.12 mg/mL, respectively (b). ОD520 of GNPs-antibodies conjugates were 5 (GNPs–CAPB10) and 4 (GNPs–C33B4) optical units. Click here to View Figure |
Similarly, the parameters of ampicillin detection were selected. With a decrease in the concentration of AMPH4 antibodies upon their conjugation with GNPs from 12 to 6 μg/mL, in the OD520 of the solution of GNPs–antibody conjugate from 5 to 4 optical units, and the concentration of the PEN–BSA conjugate applied in TZ3 from 0.4 to 0.2 mg/mL, the limit of AMP detection decreased by 10 times (from 100 to 10 ng/mL).
Based on the results of choosing the conditions for individual interactions in the multiplex system, test strips were made and used to characterize samples containing from one to three target antibiotics. As can be seen in Figure 6, the proposed test system demonstrated comparable levels of label binding in all three test zones in the absence of analytes and the absence of the mutual influence of immunoreagents with different specificities.
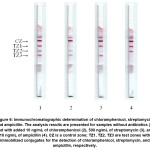 |
Figure 6: Immunochromatographic determination of chloramphenicol, streptomycin, and ampicillin. The analysis results are presented for samples without antibiotics (1) and with added 10 ng/mL of chloramphenicol (2), 500 ng/mL of streptomycin (3), and 10 ng/mL of ampicillin (4). CZ is a control zone; TZ1, TZ2, TZ3 are test zones with immobilized conjugates for the detection of chloramphenicol, streptomycin, and ampicillin, respectively. Click here to View Figure |
The presence of one of the antibiotics in the sample is manifested as inhibition of binding in only one specific test zone. At the same time, the concentrations leading to the complete disappearance of staining did not change compared with monoparametric tests.
When the assay results are recorded visuallyand intreprepted as the absence or presence of coloration in the test zone, the detection limits are 10 ng/mL for chloramphenicol and ampicillin and 500 ng/mL for streptomycin. Photometric registration provides detection of lower concentrations of antibiotics; the working ranges of quantitative analyses are 0.5–6 ng/mL for chloramphenicol, 0.4–5 ng/mL for ampicillin, and 16–250 ng/mL for streptomycin. For the developed test system, antibiotics of other chemical classes did not demonstrated cross-reactions in concentrations up to 10 μg/mL. Test system is characterized by strong reproducibility; the values of the relative standard deviation did not exceed 6%.
Discussion
Based on the data obtained for tests for individual antibiotics, a test system was proposed for the simultaneous determination of chloramphenicol, streptomycin, and ampicillin. It has been shown that, as a result of changes in the composition of immunoreagents and their concentrations, the threshold for distinguishing negative and positive results can be shifted, thereby adapting test systems to changing conditions for the interaction of immunoreagents in multiplex analysis. The varied parameters were the composition of the GNPs–antibody conjugates and the amount of the applied GNPs–antibody and hapten–protein conjugates. As a result of the use of these tools, the working ranges and threshold levels for determining antibiotics for the multiplex test system are the same as for monotests. At the same time, the multiplex format provides increased productivity and reduced analysis costs.
The use of the proposed immunochromatographic test systems for monitoring the content of antibiotics will provide the possibility of making operational decisions in medical diagnostics and control of consumer products and, thus, prevent health risks.
Acknowledgements
This research was financially supported by the Russian Ministry of Science and Higher Education (agreement 14.613.21.0061 from July 17, 2017; identification number RFMEFI61317X0061).
Conflicts of Interest
The authors declare that they have no conflicts of interest.
References
- Jin, J. F.; Zhu, L. L.; Chen, M.; Xu, H. M.; Wang, H. F.; Feng, X. Q.; Zhu, X. P.; Zhou, Q. Patient Preference & Adherence, 2015. 9: 923-942.
- Yilmaz, C.; Ozcengiz, G. Pharmacol., 2017. 133: 43-62.
- Bishop, J. D.; Hsieh, H. V.; Gasperino, D. J.; Weigl, B. H. Lab on Chip. 2019. 19(15): 2486-2499.
- Li, J.; Macdonald, J. Bioelectron. 2016. 83: 177-192.
- Byzova, N. A.; Zvereva, E. A.; Zherdev, A. V.; Eremin, S. A.; Dzantiev, B. B. Talanta. 2010, 81, 838-
- Byzova, N. A.; Zvereva, E. A.; Zherdev, A. V.; Eremin, S. A.; Sveshnikov, P. G.; Dzantiev, B. B. Chim. Acta. 2011, 701, 209-217.
- Byzova, N. A.; Zvereva, E. A.; Zherdev, A. V.; Dzantiev, B. B. Biochem. Microbiol. 2011, 47, 627-634.
- Frens, G. Phys. Sci. 1973, 241, 20-22.
- Chandler, J.; Gurmin, T.; Robinson, N. IVD Technology. 2000, 6, 37-49.
- Hermanson, G. T. Bioconjugate Techniques, 3rd edn. Acad. Press, Elsevier, Amsterdam, 2013. 1200 p.
- Zvereva, E. A.; Byzova, N. A.; Sveshnikov, P. G.; Zherdev, A. V.; Dzantiev, B. B. Methods. 2015, 7, 6378-6384.

This work is licensed under a Creative Commons Attribution 4.0 International License.
![]()
A New Edition of Web of Science
Journal Impact Factor
2022: 0.5
Five Year: 0.8
Journal is Indexed in

Cabells Whitelist
![]()


