Mixed Ligand Complexes of Copper(II) and Cobalt(II) with Hydrazones Derivatives and ortho-Vanillin: Syntheses, Characterizations and Antimicrobial Activity
Israa A. Alghamdi1*, Mohamed Abdelbaset1, 2 and Ines El Mannoubi1
1Chemistry Department, Faculty of Science, AlBaha University, Al-Baha, KSA.
2Chemistry Department, Faculty of Science, Al Azhar University, Assiut Branch, Assiut, Egypt
Corresponding Author Email: Osoo_1413@hotmail.com
DOI : http://dx.doi.org/10.13005/ojc/350614
Article Received on : 12-11-19
Article Accepted on : 08-12-2019
Article Published : 30 Dec 2019
The purpose of this paper was to synthesis new mixed-ligand Cu(II) and Co(II) metal complexes utilizing bidentate and tridentate donor hydrazones derivatives as primary ligands and o-vanillin as co-ligand. The obtained compounds were characterized by elemental analysis, Infrared, UV-Vis., 1H-NMR, Mass spectra, molar conductance, thermal analysis and atomic absorption spectroscopy (ASS). Spectroscopic analysis results indicated that the hydrazone ligand (L1) behave as tridentate (ONO) and forms metal complexes having distorted square planar geometry. While the ligands (L2, L3 AND L4) behave as bidentate (NO) and forms metal complexes having octahedral geometry around the central metal atoms. The antimicrobial potentials were assessed for the ligand (L2) and its metal complexes only and were screened against six types of bacterial strains and one fungal strain. The antimicrobial activities results of the tested compounds showed enhanced activity of the complexes over their parent ligands.
KEYWORDS:Hydrazones; o-Vanillin ; Mixed Ligand Complexes; Antimicrobial Activity
Download this article as:| Copy the following to cite this article: Alghamdi I. A, Abdelbaset M, El Mannoubi I. Mixed Ligand Complexes of Copper(II) and Cobalt(II) with Hydrazones Derivatives and ortho-Vanillin: Syntheses, Characterizations and Antimicrobial Activity. Orient J Chem 2019; 35(6). |
| Copy the following to cite this URL: Alghamdi I. A, Abdelbaset M, El Mannoubi I. Mixed Ligand Complexes of Copper(II) and Cobalt(II) with Hydrazones Derivatives and ortho-Vanillin: Syntheses, Characterizations and Antimicrobial Activity. Orient J Chem 2019; 35(6). Available from: https://bit.ly/2sxX5H1 |
Introduction
Transition coordination compounds containing hydrazones as ligands is still important field of investigation because of its interesting structural features and their biological significance1,2. Hydrazones are important ligands, which played a significant role in the progress of Inorganic chemistry of the metal complexes. These ligands easily form stable coordination compounds with metal ions 3. Hydrazones can also coordinate with several transition metal cations, like copper(II), iron(III),vanadium and zinc(II)4-7. Hydrazones and their complexes are having great medicinal applications like anti-fungal, anti-inflammatory, anti-bacterial, anti-tuberculostatic, antimicrobial and anti-cancer agents8-11. Due to the importance of such ligands, many studies found that mixed ligand complexes are different from traditional complexes in the point they have at least two different ligands linked with central metal ion in the complex. Synthesis and characterization of new mixed ligand is increasing day by day and researchers are involved in this field 12-15.
From the importance mentioned above we are encouraged to prepare new copper and cobalt complexes using hydrazone derivatives and o-vanillin as mixed ligands.
Materials and Methods
Chemicals
All chemicals used in this work: Copper(II)chloride (CuCl2), Cobalt(II)chloride (CoCl2), methyl benzoate, hydrazine hydrate, benzaldehyde, salicylaldehyde, anisaldehyde, vanillin, o-vanillin (L6) were obtained from local market and used in experimentation without purification. The benzoic acid hydrazide and hydrazone derivatives (L1–L4) were prepared in the laboratory following the published methods in literature.16
Instruments
Melting points of the synthesized ligands and complexes were measured using Electrothermal melting point apparatus (Cat NO. TA9100). Elemental analysis were recorded on a Leco VTF‐900 CHN‐S‐O 932 version 1.3x instrument (Thermo Fisher Scientific‐USA). Infrared spectroscopy was recorded on Nicolet IS50 FT‐IR spectrophotometer in the spectra range of 4000 ‐ 400 cm‐1. UV-visible absorption analysis was performed utilizing UV-visible double beam spectrophotometer of Thermo Scientific Evolution-300 model and using DMF as solvent. The Thermo Scientific Exactive Triversa Nanomate mass spectrometer instrument was used to measure mass spectra of the obtained compounds. Molar conductivities of metal complexes in DMF solutions at a concentration of 0.001M were measured using Hanna instrument HI8633 N Multi-range conductivity meter. Thermogravimetric analysis (TGA) were performed on Shimadzu analyzer 50 in nitrogen atmosphere (100 ml/min) at a heating rate 10°C/min. The 1HNMR spectra were performed by using Varian Mercury-400 BB (400 MHz) spectrometer using TMS (1H) as standard. Atomic absorption spectroscopic studies of the formed GPZ-metal complexes were carried out using MODEL 210 VCP atomic absorption spectrophotometer (Buck Scientific, USA), detection limit 0.1 ppm and integration time 3 s. The flame used was acetylene-air mixture. A Shimadzu atomic absorption flame spectrophotometer model AA.640- 13, slit width 0.2 nm, relative noise 1.0, detection limit 0.6 ppm and integration time 3 s. The flame used was an acetylene-air mixture.
Synthesis of Hydrazone derivative ligands (L1 – L4)
The Hydrazone derivatives (L1 – L4) (Scheme 1) were prepared by condensation of Benzoic acid hydrazide (1.36 g ,10 mmol) in 50 mL of ethanol with an aldehyde compound (benzaldehyde, salicylaldehyde, vaniline, anisaldehyde) (10 mmol) in absolute ethanol (l0 mL). add few drops of glacial acetic acid to the reaction mixture. The mixture was heated under reflux for 4 hours and then allowed to cool at room temperature. The precipitate was filtered and washed with ethanol. The obtained product was recrystallized using ethanol to get pure solid.16
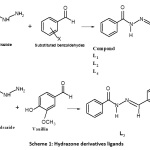 |
Scheme 1: Hydrazone derivatives ligands Click here to View Scheme |
Synthesis of Mixed Ligand Cu(II) and Co(II) Complexes
An ethanolic solution of hydrazone derivatives (L1 – L4) as a primary ligand (1mmol) and ethanolic solution of o-vanillin (L6) as a co-ligand (1mmol), were added slowly into warm aqueous solution of Copper(II) chloride (CuCl2) or Cobalt(II) chloride (CoCl2) (1 mmol). The mixture was refluxed for five hours with stirring. The obtained precipitates were filtered, washed many times with cold ethanol and finally dried under desiccator.
Antimicrobial Activity
The antibacterial potency for both free ligands and their Co(II) and Cu(II) complexes were tested using three Gram-positive bacterial strains namely Staphylococcus aureus, Enterococcus faecalis, and Group B streptococcus (GBS) and three Gram-negative bacterial strains namely Proteus Mirabilis, Escherichia coli, Klebsiella pneumoniae. The antifungal potency was tested against the yeast Candida albicans only.
Results and Disscussion
The complexes of copper and cobalt were synthesized by the reaction of Cu2+ and Co2+ metal salts with hydrazone derivatives (L1 –L4) as primary ligands and o-vanillin (L6) as secondary ligand. All the prepared complexes were colored and stable in open air. The obtained metal complexes were soluble in DMF and DMSO. The ligands and their Cu2+ and Co2+complexes were characterized using physico-chemical techniques. The physical properties data of the hydrazone derivatives ligands (L1-L4) and their Cu2+ and Co2+complexes are presented in Table 1.
Elemental analysis and values of molecular conductance for the synthesized complexes are listed in Table 2. The elemental analysis of the Co(II) and Cu(II) complexes are in agreement with the proposed chemical formula. It confirmed the presence of water molecules in the complexes by thermal analysis.
The values of molar conductance for prepared complexes (1-7) were measured in 1×10⁻³ M DMSO solutions are listed in Table 2. The values are within the range 13.9-20.8 Ohm-1 cm2 mol-1 for the complexes (2-7) suggest a non-electrolyte character of the tested compounds. While, the measured values (91.2-93.7 Ohm-1 cm2 mol-1) of molar conductance for the complexes (1 and 2) indicating 1:1 electrolytic nature of these complexes 17. Molar conductivity measurements are agreed with the formula of the metal complexes.
Table 1: The physical properties data for ligands (L1-L4) and their Cu2+ and Co2+complexes
|
Compound |
Molecular Formula | Yield % | Color | MP (ºC) | Mol. Wt. |
| L1 | C14H12N2O2 | 82% | Pale yellow | 179 |
240.25 |
|
L2 |
C14H12N2O | 60% | Brownish yellow | 195 | 224.25 |
| L3 | C15H14N2O3 | 72% | Brownish yellow | 124 |
270.28 |
|
L4 |
C15H14N2O2 | 92% | White | 157 | 254.28 |
| [Cu (L1) L6] Cl2. 4H2O (1) | C22H26Cl2CuN2O9 | 65% | Brown | ˃300 |
596.9 |
| [Co (L1) L6] Cl2. 4.5H2O (2) | C22H27Cl2CoN2O9.5 | 85% | Dark green | ˃300 | 601.29 |
| [Cu (L2) L6 Cl2].5.5 H2O (3) | C22H30Cl2CuN2O9.5 | 66% | Brown | ˃300 | 608.93 |
|
[Co (L2) L6 Cl2]2H2O (4) |
C22H23Cl2CoN2O6 | 76% | Dark green | ˃300 | 541.26 |
| [Cu (L3) L6 Cl2] H2O (5) | C23H23Cl2CuN2O7 | 74% | Brown | ˃300 |
573.89 |
|
[Co (L3) L6 Cl2] H2O (6) |
C23H23Cl2CoN2O7 | 65% | Dark green | ˃300 | 569.27 |
| [Cu(L4) L6 Cl2] H2O (7) | C23H23Cl2CuN2O6 | 80% | Brown | ˃300 |
557.89 |
Table 2: Elemental analysis and molar conductance values for the complexes.
| Compound | Cald. (Found)% | Molar conductivityohm-1cm2mol-1 | |||||
| C | H | N | O | Cu | Co | ||
| [Cu (L1) L6] Cl2. 4H2O (1) | 43.26(44.46) | 4.39(4.62) | 4.69(4.28) | 24.12(24.25) | 10.64(10.48) | – | 93.7 |
| [Co (L1) L6] Cl2. 4.5H2O (2) | 43.94(43.73) | 4.52(4.32) | 4.20(4.42) | 25.26(25.52) | – | 9.80(9.58) | 91.2 |
| [Cu (L2) L6 Cl2] 5.5 H2O (3) | 43.40(43.82) | 4.96(4.72) | 4.60(4.95) | 24.94(24.76) | 10.43(10.84) | – | 15.7 |
| [Co (L2) L6 Cl2]2H2O (4) | 48.81(48.55) | 4.28(4.13) | 5.17(5.52) | 17.73(17.98) | – | 10.88(10.96) | 13.9 |
| [Cu (L3) L6 Cl2] H2O (5) | 48.13(47.86) | 4.04(4.35) | 4.88(4.64) | 19.51(19.21) | 11.07(11.32) | – | 14.3 |
| [Co (L3) L6 Cl2] H2O (6) | 48.52(48.72) | 4.07(4.23) | 4.92(5.25) | 19.67(20.12) | – | 10.35(10.67) | 18.5 |
| [Cu(L4) L6 Cl2] H2O (7) | 49.51(49.85) | 4.154.34) | 5.02(5.39) | 17.2017.52) | 11.3911.69) | – | 20.8 |
Infrared Spectra
A significant absorption bands for the free organic ligands (L1– L4) were observed in the ranges3010–3050 cm-1, 1600–1640 cm-1, 1630 – 1690 cm-1and 3210 -3260 cm-1. These bands are assigned to N-H, -CH=N, C=O and OH stretching respectively. Important observed IR absorption bands for ligands and their Cu2+ and Co2+ complexes are recorded in table 3. IR spectrum of [Co (L2) L6 Cl2]2H2O (4) complex is shown in Figs. 1.
On comparing the observed IR spectra of the ligands with that observed for the corresponding metal complexes it is noted that the bands due to the (OH) group for the ligand (L1) were disappeared in the spectra of the complexes (1 and 2). This observation indicate deprotonation of the OH group and binding to the metal ions through the oxygen atom 18. In the IR spectrum of the complexes (5 and 6) it was observed that the bands due to OH group present in the L3 ligand in the range (3170 – 3200cm-1) slightly shifted to lower frequency. The characteristic band of the carbonyl group υ(C=O) that observed at 1630 – 1690 cm-1 in the spectrum of the free ligands (L1– L4), shifted to lower frequency (by 10-20 cm-1) in the spectrum of the complexes indicating complexation with metal ions 18- 21. The formation of azomethine group (υ(C=N))was confirmed by the appearance of bands in the range 1600-1640 cm-1 in the infrared spectra of the free ligands (L1– L4).These bands were shifted to lower frequency and appeared at the range of (1540 – 1595 cm-1)) in the infrared spectra of the metal complexes (1-7). This blue shift in the IR wavelength of the metal complexes indicating the coordination of the N atom of the -CH=N- group to the metal ions 3, 22.
In the infrared spectra of the copper(II) and cobalt (II) complexes (1-7) a new broad bands were observed in the range 3380-3450 cm-1 can be assigned to the υ(OH) vibrations indicating the presence of water molecules 23, 24. These bands were not observed in the spectra of the free ligands (L1– L4). This was supported by TGA analysis. The observed bands in the region 520 – 550 and 450-490 cm-1assigned to υ(M-O) and υ(M-N) respectively 25. This indicates that the ligands (L2-L4 and L6) are bidentate and bind to metal ions through N atom of the -CH=N- and O atom of the >C=O group. While, the ligand(L1) behaves as tridentate ligand and bind to the metal ions through the N atom of the -CH=N-, O atom of the >C=O and the O atom of -OH group.
Table 3: IR Spectroscopic data (cm-1) of the ligands (L1-L4) and their copper(II) and cobalt (II) complexes.
| Compound | H2O | OH | NH | C=N | C=O | M-N | M-O |
| L1 | – | 3260 | 3050 | 1600 | 1680 | – | – |
| [Cu (L1) L6] Cl2. 4H2O (1) | 3400 | – | 3070 | 1550 | 1600 | 451 | 530 |
| [Co (L1) L6] Cl2. 4.5H2O (2) | 3390 | – | 3070 | 1555 | 1610 | 450 | 550 |
| L2 | – | – | 3050 | 16001640 | 1690 | – | – |
| [Cu(L2) L6 Cl2] 5.5H2O (3) | – | – | 3060 | 1550 | 1605 | 480 | 525 |
| [Co (L2) L6 Cl2] 2H2O (4) | 3400 | – | 3070 | 1545 | 1605 | 460 | 540 |
| L3 | 3210 | 3030 | 1600 | 1640 | – | – | |
| [Cu (L3) L6 Cl2] H2O (5) | 3450 | 3170 | – | 1595 | 1680 | 470 | 530 |
| [Co (L3) L6 Cl2] H2O (6) | 3380 | 3200 | 3070 | 1580 | 1650 | 490 | 520 |
| L4 | – | 3010 | 1600 | 1630 | – | – | |
| [Cu(L4) L6 Cl2] H2O (7) | 3390 | – | 3070 | 1540 | 1610 | 480 | 540 |
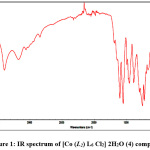 |
Figure 1: IR spectrum of [Co (L2) L6 Cl2] 2H2O (4) complex. Click here to View Figure |
UV-Visible absorption Spectrum.
The electronic absorption spectra of copper and cobalt complexes (1–7) were recorded in 10-3 mol. L-1 in DMSO solution, displayed many bands in the range of 200 to 600 nm (figs. 2 and 3). In case of complexes (1, 3,4, 5 and 6), the absorption bands around 320–360 nm were assigned to the intra-ligand charge transfer transitions of the π → π* and n → π* charge transfer transitions.26, 27 The complexes (1-7) also showed peaks at 490-409 nm which can be assigned to a metal-to-ligand charge transfer (MLCT) transition 28, 25. The lower energy bands at 600-670 nm can be assigned to a d-d transition in complexes (1 and 4) and are ascribed to the d-d transition and are characteristic for the 6-coordinated metal complexes (octahedral).29, 30
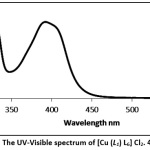 |
Figure 2: The UV-Visible spectrum of [Cu (L1) L6] Cl2. 4H2O (1). Click here to View Figure |
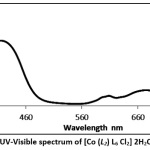 |
Figure 3: The UV-Visible spectrum of [Co (L2) L6 Cl2] 2H2O (4) complex. Click here to View Figure |
1H NMR Spectra.
The 1HNMR spectra of the prepared ligands and their complexes were recorded in DMSO-d6 and the internal standard used was tetra methyl silane (TMS). The 1H NMR spectral data for [Cu (L1) L6] Cl2. 4H2O (1) and [Co (L2) L6 Cl2] 2H2O (4) complexes are shown in figurs 4 and 5. The1H NMR spectra of the ligands (L1 and L2) showed signal at δ 8.65 ppm which is caused by the NH group. This signal was shifted to higher field in the spectra of metal complexes (1 and 4). The signal which assigned to the OH proton in the primary hydrazine ligand (L1) and that in the co-ligand (L6) was absent in the spectra of the metal complexes (1 and 4) supporting the deprotonation of the hydroxyl group in both ligands and coordination through the oxygen atom with the central metal ion 31. The signal corresponding to the azomethine proton appeared at 7.87 and 7.88 ppm in the spectra of ligands, this signal is shifted to higher field in the spectra of metal complexes (1 and 4) due to the coordination of azomethine nitrogen with metal ion and observed at 7.82 and 7.57 ppm.32
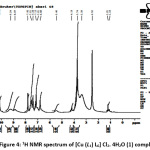 |
Figure 4: 1H NMR spectrum of [Cu (L1) L6] Cl2. 4H2O (1) complex. Click here to View Figure |
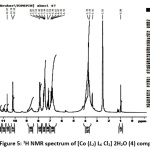 |
Figure 5: 1H NMR spectrum of [Co (L2) L6 Cl2] 2H2O (4) complex. Click here to View Figure |
Thermogravimetric Analysis.
Thermogravimetric curve of [Co (L2) L6 Cl2] 2H2O (4) complex represents three decomposition steps (Figure 6). The first step ended at nearly 250 °C indicating the loss of two molecules of hydrated H2O molecules and one molecule of HCl gas (obs. 21 %; calcd. 20.41 %) 33. The next two steps started from 250 °C and ended at 600 °C, correspond to decomposition of the ligands leading to the final residue at 600 °C as metal oxide (CoO), the remaining weight loss (obs./cal. 49.85/44.5) corresponds to the mixture of metal oxide and some ashes as a final pyrolysis product 34.
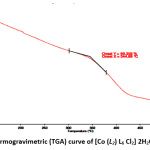 |
Figure 6: Thermogravimetric (TGA) curve of [Co (L2) L6 Cl2] 2H2O (4) complex Click here to View Figure |
Mass Spectra
The mass spectra were recorded in order to confirm the theoretically calculated molecular weight according to the proposed structure. The molecular ion [M+1]+ of the [Cu (L1) L6] Cl2. 4H2O (1) complex appears at m/z = 598.25, which is matches the theoretically calculated molecular weight of (596.9 m/z), and this proves and supports the proposed structures. The molecular ion peak for the complex [Co (L1) L6] Cl2. 4.5H2O (2) was observed at 602.17 m/z, which is in accordance with the formula weight for this complex (calculated 601.29 m/z).Also, the mass spectrum for the complex [Cu (L2) L6 Cl2].5.5 H2O (3) showed a peak at 608.08 m/z, which is in accordance with its calculated formula weight (608.93 m/z). This confirms the formula proposed for these complexes. The mass spectra of some synthesized complexes are shown in Figures 7-9.
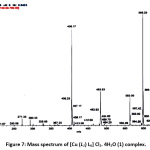 |
Figure 7: Mass spectrum of [Cu (L1) L6] Cl2. 4H2O (1) complex. Click here to View Figure |
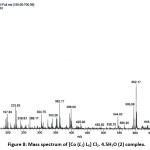 |
Figure 8: Mass spectrum of [Co (L1) L6] Cl2. 4.5H2O (2) complex. Click here to View Figure |
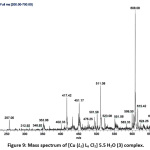 |
Figure 9: Mass spectrum of [Cu (L2) L6 Cl2] 5.5 H2O (3) complex. Click here to View Figure |
From above results, we concluded that the hydrazone derivatives ligands (L2 –L4) act as a bidentate ligand coordinate at the metallic ions through the oxygen atom of the free C=O and N atom of the azomethane group forming stable five membered ring. While ligand L1 acts as tridentate forming stable five and six membered rings. Moreover, the co-ligand (o-vanillin) acts as bidentate and coordinates to metal ions through oxygen atom of the hydroxyl and aldehydic groups forming six membered rings.
On the basis of the previous observations, it is suggested that the metal complexes (3-7) with bidentate ligands (L2-L4) showed an octahedral geometries while the proposed structure of the metal complexes (1 and 2) with the tridentate ligand L1 are of distorted square-pyramidal geometries.
The the proposed structure of the complexes 1-7 are shown below (scheme 2).
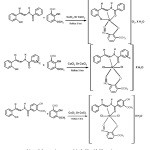 |
Scheme 2: Suggested structures of the Cu (II) and Co(II) complexes. Click here to View Scheme |
Antimicrobial activity
The ligand (L2) and its prepared corresponding metal complexes (3 and 4) were assessed for microbial susceptibility against three Gram-positive and three Gram-negative bacteria strains. In addition, the antifungal assay was done against one kind of pathogenic fungus Candida albicans. The screening of the tested compounds was carried out at fixed concentration of 10-3 g/mL in DMSO solvent. The zones of complete inhibition (in mm) were measured in order to track the microbial susceptibility. The observations are recorded in Table 4. The results indicated that organic ligand (L2) did not give activity against nearly all types of bacteria (Gram-positive bacteria and Gram-negative bacteria) except the Enterococcus Faecalis (inhibition zone of 16 mm). The tested metal complexes (3 and 4) showed antifungal activity against the pathogenic fungus C. Albicans with highest sensitivity with an inhibition zone equal to 26 and 21 mm respectively. The increased antifungal activity of the prepared metal complexes may be returned to chelation that increases the permeability of the chemicals and may be returned to metal ion (Cu2+ and Co2+).
The results indicated that the examined Cu2+ and Co2+complexes (3 and 4) have highest antibacterial activity against Gram-positive bacteria and Gram-negative bacteria compared to the free ligand (inhibition zones of 7-27 and 8-24 mm respectively).
Table 4: Antimicrobial activity of the ligand L2 and its metal Complexes
| Antibacterial Activity 200 (100) μg/disc | Antifungal Activity | ||||||
| Comp. No. | Gram Positive Bacteria | Gram Negative Bacteria | Yeast | ||||
| S.e | S. a | E. f | E. a | P. m | P.a | a | |
| L2 | 0 | 0 | 16 | 0 | 0 | 0 | 0 |
| [Cu (L2) L6 Cl2].5.5 H2O (3) | 27 | 27 | 25 | 7 | 7 | 7 | 26 |
| [Co (L2) L6 Cl2]2H2O (4) | 24 | 14 | 16 | 8 | 20 | 14 | 21 |
S. e: Staphylococcus Epidermidis (ATCC 12228); S. a: Staphylococcus aureus (ATCC 25923); E. f: EnterococcusFaecalis (ATCC 29212); E. c: Escherichia Coli (ATCC25922); P. m: Proteus Merabilis(ATCC 13376); P. a: Pseudomonas Aerugenosa (ATCC 27853); C. a: Candia albican(ATCC10231).
Conclusion
New series of copper (II) and cobalt (II)) complexes incorporating with some mixed ligands containing hydrazone moiety as primary ligands and o-vanillin as co-ligand have been synthesized. The ligands (L1-L4) and their Cu2+ and Co2+ complexes were characterized by elemental analysis, Infrared, UV-Visible, 1H-NMR, Mass spectra, molar conductance, thermal analysis and atomic absorption spectroscopy (ASS). The observed data indicated that the ligands (L2-L4 and L6) behave as bidentate ligands while the ligand (L1) behaves as tridentate ligand. The analyses data for Cu(II) and Co(II) complexes suggested that the complexes (3-7) with bidentate ligands (L2-L4 and L6) showed an octahedral geometries. While, the structure of the Cu(II) and Co(II) complexes (1 and 2) with tridentate ligand (L1) suggested distorted square-pyramidal geometries. The o-vanillin ligand coordinates to metal ion through oxygen atoms of the hydroxyl and aldehydic groups forming six membered ring.
The antibacterial results show that the ligand L2 and its copper and cobalt complexes (3 and 4) have highest antibacterial activity against Gram-positive bacteria and Gram-negative bacteria compared to the free ligands. On the other hand, the antifungal activity of the metal complexes (3 and 4) showed highest antifungal activity against the pathogenic fungus C. Albicans compared to the free ligands.
Acknowledgements
The authors are thankful to King Abdulaziz City for Science and Technology (KACST), Riyadh, Saudi Arabia for providing the financial support to this project (Grant No. 117-01-013-0004).
References
- Hassan, I. A. J. Chem. Sci.2013,3 (12), 50-53.
- Nawar, N.; Hosny, N. M. Pharm. Bull.1999, 47(7), 944 – 949.
- Abdelkarim, A. T. International Journal of Pharma Sciences. 2015, 5(1), 839- 851.
- Samanta, B.; Chakraborty, J.; Choudhury, C. R.; Dey, S. K.; Dey, D. K.; Batten, S. R.; Jensen, P.; Yap, G. P. A.; Mitra, S. Struct Chem. 2007, 18, 33–41.
- Abu El-Reash, G. M.; El-Gammal, O. A.; Radwan, A. H. Acta A Mol. Biomol. Spectrosc. 2014, 121, 259-267.
- Al-Shaalan, N. H. Molecules .2011,16, 8629-8645.
- Alghamdi, I. A.; abdelbaset, M.; el mannoubi, I. IJBPAS. 2019, 8(5), 939-959.
- Kachare, A. A.; Kumbalpuri, S. A.; Shankarwar, S. G.; Chondhekar, T. K. Der Chemica Sinica.2015, 6 (7) 87-92.
- Chaston, T. B.; Watts, R. N.; Yuan, J.; Richardson, D. R. Canc. Res.2004, 10, 7365-7374.
- Bao, X.; Xue, Y.; Xia, C.; Lu, Y.; Yang, N.; Zhao, Y. Drug Des. Discov.2018, 15, 31-36.
- Hruskov, K.; Potuckov, E.; Hergeselov, T.; Liptakov, L.; Haskov, P.; Mingas ,P.; Kovaríkov, P.; Simunek, T.; Vavrov, K. J. Med. Chem. 2016,120, 97-110.
- Anjaneyulu, Y.; Swamy, R. Y.; Rao, R. P. Proc. Indian Acad. Sci. Chem. Sci.1984, 93(2) 131-138.
- Ali, M. A.; Kabi, M. H.; Uddin, M. N.; Majumder, S. M. M.; Tarafder, M. T. H.; Khair, M. A. Indian J. Chem.1988, 27A,1064.
- Reddy, K. H.; Reddy, P. S.; Babu, P. R. Transition. Chem.2000, 25(5) 505-510.
- Sanap, S. V.; Patil, R. M. J. Pharma. Sci.2013, 2(1), 1-10.
- Mrinalini, L.; Manihar Singh, A. K. Res. J. Chem. Sci.2012, 2 (1) , 45. Ndosiri, N. B.; Agwara, M. O; Paboudam, A. G.; Ndifon, P. T; Yufanyi, D. M.; Amah, C. J. Pharma., Bio. Chem. Sci. 2013, 4 (1), 386.
- Fayad, N. K.; Al-Noor, T. H.; Ghanim, F. H. and Mat. Res.2012, 2(5),18-29.
- Jubie, S.; Ashish, W.; Sabaritha, K.; Nishanthini, P.; Thomas, A.; Antony, J. Pharm. Sci. & Res.2016, 8(7) 582-585.
- Yaul, A.; Pethe, G.; Deshmukh, R.; Aswar, A. Therm Anal Calorim. 2013 ,113, 745–752.
- Mahal, A.; Abu-El-Halawa, R.; Zabin, S. A.; Ibrahim, M.; Al-Refai, M.; Kaimari, T. World Journal of Organic Chemistry. 2015, 3(1),1-8.
- Sahoo, S. K.; Baral, M.; Kanungo, B. K. Polyhedron.2006, 25 (3), 722-736.
- Monfareda, H. H.; Lalami, N. A.; Pazio, A.; Wozniak, K.; Janiakc, C. Chim. Acta.2013, 406, 241-250.
- Armstrong, C. M; Bernhardt, P. V; Chin, P.; Richardson, D. R.. J. Inorg. Chem.2003,1145-1156.
- Hosseini-Monfared, H.; Bikas, R.; Mayer P. Chim. Acta.2010, 363, 2574-2583.
- Sarkar, A.; Pal, S.; Polyhedron.2007, 26, 1205.
- Shakir, M.; Parveen, S.; Begum, N.; Azim, Y. Polyhedron.2003, 22(24), 3181.
- Shakir, M.; Parveen, S.; Begum, N.; Chingsubam, P., Transition Metal Chemistry. 2004, 29 (2), 196.
- Alzahrani, A. A.; Zabin, S. A.; Jammali, M. Journal of Organic & Inorganic Chemistry. 2018, 4 ,1-16.
- Zhao, X.; Chen, X.; Li, J.; Chen, J.; Sheng, G.; Niu, F.; Qu, D.; Huo, Y.; Zhu, H.; You, Z. Polyhedron.2015, 97, 268–272.
- Salehi, M.; Rahimifar, F.; Kubicki, M.; Asadi, A. InorganicaChimica Acta.2016 ,443, 28-35.
- Hathaway, B. J.; Wilkinson, G. (Ed.), Comprehensive Coordination Chemistry, Pergamon Press. Oxford.1987, 5.
- Bulut, I. Chem. 2009, 33, 507 – 520.
- Zabin, S. A.; Abdelbaset, M. European Journal of Chemistry .2016, 7 (3), 322‐328.
- Krishnamoorthy, P.; Sathyadevi, P.; Butorac, R. R.; Cowley, A. H.; Bhuvanesh, N. S. P.; Dharmaraj, N. Dalton Trans.2012,41, 4423–4436.
- Abdelbaset, M.; Zabin, S. A.; Alorabi, A. Q. IJBPAS, 2019, 8(3) 627-644.

This work is licensed under a Creative Commons Attribution 4.0 International License.
![]()
A New Edition of Web of Science
Journal Impact Factor
2022: 0.5
Five Year: 0.8
Journal is Indexed in

Cabells Whitelist
![]()


