Estimation of Mercury in Soil, Water and Plants Spectrophotometrically
Shawnam Omar Abdullah1* And Qasim Yahya Mohammed2
1Koya University – School of medicine- Kurdistan region – Iraq
2Erbil polytechnic University – Koya technical institute – petroleum technology department-Kurdistan region - Iraq
Corresponding Author Email: qasm.mohmmed@epu.edu.iq
DOI : http://dx.doi.org/10.13005/ojc/350613
Article Received on : 03-08-2019
Article Accepted on : 04-12-2019
Article Published : 18 Dec 2019
Trace levels of mercury in soil, environmental water (portable and polluted) and plant specimens (cucumber and pepper) at Koya area – Kurdistan region – Iraq was described by simple procedure, where, no further solvent purification or pre-concentration required steps. The method based on soxhelt extraction with oxalic acid and stannous chloride in acidic media for about 2.5 h, followed by spectrophotometric measurement at λmax of 300 nm.
The results show different mercury levels, water samples show (3-215) ppm, while soil samples (5 -150) ppm. Also, some agricultural products show (23 -80) ppm mercury level.
Soxhlet; Mercury; Spectrophotometer
Download this article as:| Copy the following to cite this article: Abdullah S. O, Mohammed Q. Y. Estimation of Mercury in Soil, Water and Plants Spectrophotometrically. Orient J Chem 2019; 35(6). |
| Copy the following to cite this URL: Abdullah S. O, Mohammed Q. Y. Estimation of Mercury in Soil, Water and Plants Spectrophotometrically. Orient J Chem 2019; 35(6). Available from: https://bit.ly/2Euo3C4 |
Introduction
Mercury is one of the most toxic elements and is associated with many health problems, include, instantaneous neurological damages particularly irritability, paralysis, insanity, blindness, chromosome damage and birth defects [1].
It is found in different forms, as elemental mercury vapor in atmosphere, although, as organic and inorganic form. The main natural sources of mercury are volcanoes, forest fires and the weathering of mercury-bearing rocks [2]. Anyhow, industry produce huge amounts of mercury [3].
The most important common sources of mercury in this field are, paper, cellulose and plastic industries, paint, pharmaceutical industries and pesticides. [4, 5].
Also, mercury assumes to be the most dangerous of all contaminants which may be consumed in our daily foods like fish, cereals and other food stuffs have resulted in numerous poisoning [6].
The most common methods for measuring total mercury include absorption spectrometry, neutron activation analysis, and cold vapor atomic absorption spectrometry [7, 8] and colorimetric solvent extractive method [9].
The goal of this study was to evaluate the mercury content in soil, water and plant samples at Koya area – Kurdistan region – Iraq, by simple soxhelt extraction, and then, spectrophotometric measurement.
Experimental
Apparatus
A CECIL (CE7200) double beam UV-visible spectrophotometer were used for measurements of absorbance
Reagents and Solutions
- A series of standard solutions (1, 5, 20, 25,100,180, and 200) ppm of Mercury (II) chloride (Romil, 99%) prepared to construct standard graph.
- 1 M HCl (Scharlau, 37%) solution.
- Oxalic acid (Fluka, 99.8%) 4% solution.
- Stannous chloride (Fluka, 95%) 2% solution.
λmax was determined using stock solution and the results show a maximum absorbance at 300 nm.
Procedure
2 gm of tested sample weighed to the soxhlet extraction apparatus, 50 ml of oxalic acid solution, 50 ml stannous chloride solution and 10 ml of HCl solution added. The mixture refluxed for about 2.5h (filter if need), after that the contents diluted to 250 ml distilled water. From the final solution, 5 ml diluted to 25 ml with distilled water.
Absorbance measured at 300 nm against a corresponding reagent blank and mercury content of unknown samples was determined using a concurrently prepared calibration graph.
Discussion and results
Mercury content in soil, agricultural products and water sample is convenient to geologist exploring and metals accumulation inspection [10].
The optimize operation conditions to get an effective extraction and obtain maximum absorbance have been investigated.
Sample digestion
The pretreatment step in quantitative determination of total mercury is an exceptive step, because of some mercury specifications .The accuracy of results depends on the efficiency of extraction and digestion processes [11, 12]. Where, the incomplete of ineffective extraction, loss of mercury vapor and faulty mercury oxidation – reduction reaction may influence in descend the accuracy of process. The optimum period for soxhlet extraction was 2.5h, as shown in figure 1.
Absorption spectra
For absorption measurements, a set of mercury standard solutions prepared,
absorbance was measured at λmax of 300 nm. And then, calibration graph with absorbance versus concentration plotted [13]. The concentration of unknown samples was directly obtained from this graph, as shown in figures 1 and 2.
Effect of acidity
Using of hydrochloric acid for digestion of samples was found to be the most suitable acidic media for determining of mercury in all samples under study.
The optimum acidity range for all consecutive measurements 10 ml of 0.1M HCl was used, as in figure 4.
Effect of extraction environment
The oxidizing environment bring into existence by addition of oxalic acid at the time of extraction. Mercury exists as Hg (II) in the acid digestion solution was reduced to its elemental form with SnCl2. Hence, SnCl2 is a convenient mercury reductant [14], according to the results, as in figure 5.
The optimized analytical parameters of all experiments are summarized in table 1.
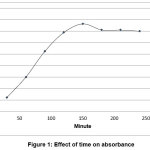 |
Figure 1: Effect of time on absorbance Click here to View Figure |
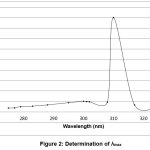 |
Figure 2: Determination of λmax Click here to View Figure |
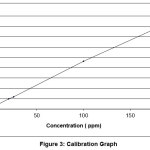 |
Figure 3: Calibration graph Click here to View Figure |
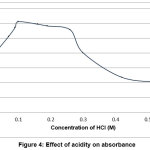 |
Figure 4: Effect of acidity on absorbance Click here to View Figure |
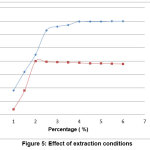 |
Figure 5: Effect of extraction conditions Click here to View Figure |
Table 1: Optimized analytical parameters
|
Parameter |
Studied range | Selected range |
|
λmax (nm) |
200 – 600 | 300 |
| Acidity /HCl (M) | 0.01 – 0.6 |
0.1 |
|
Time of extraction ( min.) |
30 – 240 | 150 |
| Temperature (ºC) | 80 |
80 |
|
Oxalic acid ( %) |
1 – 6 |
4 |
| Stannous Chloride (%) | 1 – 6 |
2 |
Table 2: Mercury content in some soil samples
|
No. |
Soil Samples | Hg (ppm) |
| 1 | Direct waste |
150 |
|
2 |
Direct surface (0 m distance) | 147 |
| 3 | Surface Fossa Soil (1-2 m distance) |
143 |
|
4 |
South west (1Km distance) | 124 |
| 5 | Ground {Kelaspi} (3Km distance) |
78 |
|
6 |
Auto industry | 78 |
| 7 | West (1Km distance) |
68 |
|
8 |
East (1Km distance) | 28 |
| 9 | South (1Km distance) |
25 |
|
10 |
North (1Km distance) | 24 |
| 11 | Well Soil (3Km distance) |
20 |
|
12 |
Farming place at Tobzawa | 5 |
| 13 | Oxidizer |
53 |
Table 3: Mercury content in some water samples
|
NO |
Water Samples | Hg (ppm) |
| 1 | Fossa`s water |
215 |
|
2 |
Lake (1Km distance) | 200 |
| 3 | Tobzawa |
25 |
|
4 |
Chicken poultry (2Km East distance) | 21 |
| 5 | Chicken poultry (2Km South distance) |
19 |
|
6 |
Kelaspy Well (3Km distance) |
3 |
Table 4: Mercury content of some agricultural products
|
NO |
Plant Sample | Hg (ppm) |
|
1 |
Cucumber |
80 |
| 2 | Pepper |
23 |
Acknowledgements
Insincerely thanks for the Erbil polytechnic university – Koya technical institute, Oil technology department, for providing the necessary infrastructural facilities during my research.
References
- Fergusson, J.E. The Heavy Elements: Chemistry, Environmental Impact and Health Effects, Pergamon Press, Oxford, 1990, 85–547.
- Logar, M.; Horvat, M.; Akagi, H.; Ando, T.; Tomiyasu, T.; Fajon, V. Determination of total mercury and monomethyl mercury compounds in water samples from Minamata Bay, Japan: An inter laboratory comparative study of different analytical techniques, Applied Organometallic Chemistry, 2001, 15, 515-526.
- Ikingura, J.R.; Akagi, H.; Lichens as a good bio indicator of air pollution by mercury in small-scale gold mining areas, Tanzania, Bulletin of Environmental Contamination and Toxicology, 2002, 68, 699-704.
- Mallik C.C.; A Short Text Book of Medical Jurisprudence, Wiley Eastern Limited, Calcutta, 1978, 588–615.
- Kudesia, V.P.; Toxicity of metals, in: Air Pollution, Pragall Prakashan, Meerut, 1988, 178–199.
- Garty, J.; Biomonitoring atmospheric heavy metals with Lichens: Theory and application, Critical Reviews in Plant Sciences, 2001, 20(4), 309-371.
- Jones, J.B.; Developments in the measurement of trace metal constituents in food, in: Analysis of Food Contaminants,J. Gilbert, ed., Elsevier, Oxford, 1984, 157–205.
- Qasim Y. Mohammed, Sardasht R. Taher, Determination of Vanadium in Crude Oil and Some Petroleum Products Spectrophotometrically, Journal of Chemical and Pharmaceutical Sciences, 2018, Volume 11 Issue 1,.
- Irving, H.M.N.H. ; The Analytical Application of Dithizone, CRC, 1980.
- Grigal D. F.; Environ Rev., 2002, 5, 1.
- Ahmed, M.J. ; Alam, M.S. A rapid spectrophotometric method for the determination of mercury in environmental, biological, soil and plant samples using diphenyl thiocarbazone, spectroscopy, 2003, 17, 45 – 52.
- Hamzaa, A.S. Bashammakhb, A.A. Al Sibaaia, H.M. Al-Saidi, M.S. El-Shahawi, Spectrophotometric determination of trace mercury (II) in dental-unit wastewater and fertilizer samples using the novel reagent 6hydroxy-3- (2-oxoindolin-3-ylideneamino)-2thioxo-2H-1, 3-thiazin-4(3H)-one and the dual-wavelength β-correction spectrophotometry J.J Haz. Mat., 2010, 178 , 287–292.
- Qasim Y. Mohammed, Determination of salt content in crude oil, turbine oil and some refinery products volumetrically, Journal of Chemical and Pharmaceutical Sciences, 2017,Volume 10 Issue 1.
- Berman, Toxic Metals and Their Analysis, Heyden, 1980.

This work is licensed under a Creative Commons Attribution 4.0 International License.
![]()
A New Edition of Web of Science
Journal Impact Factor
2022: 0.5
Five Year: 0.8
Journal is Indexed in

Cabells Whitelist
![]()


