Development of Stability Indicating, Validated Liquid Chromatographic Method for Estimation of Sarecycline in its Formulations
Azmath Unissa1, Anupama Koneru2, M. Mushraff Ali Khan3, Murali Balaram Varanasi1, Imam Pasha Syed1*
1Department of Pharmaceutical Quality Assurance, Sultan-ul-Uloom College of Pharmacy, Mount Pleasant, #8-2-249, Road No.3,Banjara hills, Hyderabad-500034, Telangana, India.
2Department of Pharmacology, Sultan-ul-Uloom College of Pharmacy, Mount Pleasant, #8-2-249, Road No.3, Banjara hills, Hyderabad-500034, Telangana, India.
3Department of Pharmaceutics, Sultan-ul-Uloom College of Pharmacy, Mount Pleasant, #8-2-249, Road No.3, Banjara hills, Hyderabad-500034, Telangana, India.
Corresponding Author Email: impazam@gmail.com
DOI : http://dx.doi.org/10.13005/ojc/350625
Article Received on : 28-11-19
Article Accepted on : 28-12-19
Article Published : 30 Dec 2019
A stability indicating HPLC method was developed and for the estimation of Sarecycline Hydrochloride in tablet dosage form using C18 column with a mobile phase composition of 0.1M Na2PO4 and Acetonitrile in the ratio of 50:50 v/v . The detection wave maxima and retention time were found to 242nm and 3.876min respectively. The method validation was carried out according to International Council for Harmonization of Technical Requirements for Pharmaceuticals for Human Use (ICH) guidelines and the parameters namely; precision, accuracy, specificity, stability, robustness, linearity, limit of quantitation (LOQ) and limit of detection (LOD) are evaluated. The present developed RP-HPLC method shows the purity angle of peaks is less than their threshold angle, signifying that it to be suitable for stability studies. Hence, the developed method can be used for the successful estimation of Sarecycline in the pharmaceutical dosage formulations.
KEYWORDS:Sarecycline Hydrochloride; RP-HPLC; Formulation; Validation
Download this article as:| Copy the following to cite this article: Unissa A, Koneru A, Khan M. M. A, Varanasi M. B, Syed I. P. Development of Stability Indicating, Validated Liquid Chromatographic Method for Estimation of Sarecycline in its Formulations. Orient J Chem 2019; 35(6). |
| Copy the following to cite this URL: Unissa A, Koneru A, Khan M. M. A, Varanasi M. B, Syed I. P. Development of Stability Indicating, Validated Liquid Chromatographic Method for Estimation of Sarecycline in its Formulations. Orient J Chem 2019; 35(6). Available from: https://bit.ly/2SyG0HP |
Introduction
The drug used in the present study is Sarecycline Hydrochloride,
Chemically (4S,4aS,5aR,12aR)-4-(Dimethylamino)-1,10,11,12a-tetrahydroxy-7-[[methoxy(methyl)amino]methyl]-3,12-dioxo-4a,5,5a,6-tetrahydro-4H-tetracene-2-carboxamide and the structure was shown in Fig.1. It inhibits protein synthesis and other biosynthetic activities and shows anti-inflammatory action [1].
Sarecycline is a semi-synthetic derivative of tetracycline that was initially discovered by Paratek Pharmaceuticals from Boston, MA but then licensed to Warner Chilcott of Rockaway, NJ . After completing various phase-II and phase-III trials demonstrating its effectiveness in treating moderate to severe facial acne vulgaris the US Food and Drug Administration approved Barcelona based Almirall, S.A.’s Seysara (sarecylcine) as a new first in class narrow spectrum tetracycline derived oral antibiotic for the treatment of inflammatory lesions of non-nodular moderate to severe acne vulgaris in patients nine years of age and older . Seysara (sarecycline) was originally part of Allergan’s US Medical Dermatology portfolio, before Almirall acquired the portfolio in the second half of 2018 as a means of consolidating and reinforcing the dermatology-focused pharmaceutical company’s presence in the United States” [2].
There are only limited reports regarding determination of Sarecycline in pharmaceutical dosage forms and biological fluids. Sarecycline is not official in any pharmacopoeia and there is no monograph containing methods to characterize or quantify Sarecycline. Such methods could offer official parameters to guarantee the validity of the assay. For the estimation of Sarecycline in its tablet dosage forms, reliable HPLC method is required to maintain the quality, potency and strength of the dosage forms to maintain safety, efficacy and bio-availability. There was no method found in the literature for the estimation of Sarecycline in tablets by HPLC, therefore Sarecycline requires effective and reliable method for quantitative estimation in tablet dosage form [3].
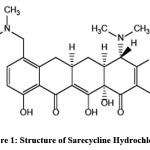 |
Figure 1: Structure of Sarecycline Hydrochloride Click here to View Figure |
Materials and Methods
Equipment and Chemical reagents
WATERS Alliance High-performance liquid chromatography system (2695 model) with EMPOWER-2 software, equipped with Photodiode Array (PDA) detector was used throughout the analysis. All the chemicals and reagents used in this experiment were of analytical grade. High purified Millipore water from Milli Q water system was used. Acetonitrile used was obtained from Sd fine-Chem Limited, India. Disodium hydrogen phosphate, HCl, NaOH, H2O2 , H3PO4 were purchased from Merck, India. Pharmaceutical grade API, Sarecycline was gifted by Ven Life Sciences Pvt, Ltd. Tablet formulation SEYSARA (Sarecycline) tablets, 100 mg are capsule-shaped, yellow, film-coated tablets debossed with “S100” on one side purchased from local market of Hyderabad, Telangana State, India.
Chromatographic Settings
The mobile phase used for the development of method was Na2HPO4: ACN (50:50 v/v) with pH adjusted to pH 4.8 and the mobile phase was filtered through membrane filter and flow rate was maintained at 1mL/min. The effluents were detected at 242 nm with PDA detector by injecting 10 μL of solution through chromatographic column.
Method development
Preparation of mobile phase
Mobile phase composition of disodium hydrogen phosphate and acetonitrile in the ratios of 50:50 (v/v) used.
Standard stock preparation
100mg of the Sarecycline reference standard in 100ml volumetric flask dissolve and make up the volume to 100ml using mobile phase as diluent. From the above solution, 1 ml is taken to make up the volume 10ml to get stock concentration of 100µg/ml.
Calibration plot
Calibration Curve was plotted by taking concentration on X-Axis and the area of peak on Y-Axis. Linearity was established in between 50-150µg/ml by recording the chromatograms on HPLC using chromatographic conditions mentioned in the Table 1.
Working Sarecycline solutions for validation process:
1ml of stock Sarecycline solution is diluted to 10ml with mobile phase, to obtain the working Sarecycline concentration of 100µg/ml.
Estimation of drug in tablet formulation:
Weigh and powder 20 Seysara tablets (Strength – 100 mg per tablet). Take weight equivalent to 100mg Sarecycline in a 100 ml volumetric flask, dissolve and make up the volume to 100 ml to obtain 1000 µg/ml. Suitable aliquots were diluted to get the sample concentration in the linearity range that is 100 µg/ml and was analyzed using chromatographic conditions given in Table 1.
Validation
System Suitability
It is an integral part of various analytical procedures [4-6]. Standard solutions of Sarecycline 1000µg/ml has been prepared and injected 5 replicates [7, 8]. Suitability of system was proved from the properties of Sarecycline peak:
- Peak area (permitted value: RSD – ≤ 2%)
- Plate count (permitted value: ˃ 2000)
- Tailing factor (permitted value: ≤ 2%)
The values revealed that the system is best suited for evaluation of Sarecycline.
Linearity
Calibration solutions with concentrations of 50, 75, 100, 125 and 150μg/ml were prepared and injected into HPLC system.
Accuracy
Recovery study is used to determine the accuracy of the sample. 50%, 100%, 150% concentration of Sarecycline was added to tablet solution that is pre-analyzed. Accuracy is assessed by using 9 determinations of minimum 3 concentrations [9, 10].
Method Precision
It was obtained from the peak area obtained by the actual measurement of 6 replicates of fixed concentration [11, 12]. Relative standard deviation was found to be less than 2%.
Robustness
Robustness for the drug is carried out bringing changes in the parameters like acetonitrile ratio in mobile phase (±5%) ,buffer pH(±0.1 units), flow rate (±0.1/min) and temperature (±2⁰c) and the peak properties of Sarecycline like tailing factor , plate count and peak area was examined[13-15]
Selectivity
Selectivity assessment was carried out injecting 10µl of standard Sarecycline solution (100µg/ml) , Sarecycline tablet solution (100µg/ml), blank (diluent without drug ) and placebo solution into system separately and chromatograms were recorded and checked for the presence of any other peaks arising from placebo or blank .
LOD and LOQ
Signal to noise ratio values for LOD and LOQ were found to be 3.08, 10.5 respectively. LOD, LOQ concentrations for Sarecycline were found to be 0.157 μg/ml, 0.523 μg/ml respectively.
Range
The range of analytical method is the interval between the upper and lower limits of the analyte determined by precision, accuracy and linearity [16, 17].Linearity was established from 50 to 150 μg/ml concentration by taking suitable aliquots from standard stock.
Specificity
It is the ability to identify the analyte in the presence degraded products [18].
Stability testing of Sarecycline
Stability testing is carried using tablet sample solution (1000µg/ml) as per ICH criteria [19, 20]
Acid degradation
The drug is being subjected to acidic condition using hydrochloric acid with a theoretical concentration of 100µg/ml and the degraded solution was analyzed by placing into the vials and injecting into the system and the degradation percent was obtained from the peak area values.
Alkali degradation studies
To initiate this, drug is treated with sodium hydroxide by using the concentration as 0.1mg/ml, and have used for alkali stress testing.
Oxidative degradation
There are three major pathways for oxidative degradation to take place. In this stability indicating studies, peroxide solution has used.
Photolytic degradation
The drug in petri plate is subjected to sunlight & subjected to analysis.
Thermal degradation
Thermal degradation studies are carried out at elevated temperature in solid state by using hot air oven at elevated temperatures.
Results & Discussion
Method development
Optimization of chromatographic conditions
Several mobile phase compositions and different stationary phases were investigated in the preliminary studies to get the best resolution. The analyte has the different retention behaviors and hence it is a challenging development, without interfering excipients. Based on the Design of Experiments (DOE), the final chromatographic conditions were optimized which gives a powerful suite for a statistical methodology and the obtained results were presented in Table 1 and Fig 2.
Table 1: Chromatographic conditions
| Parameters | Conditions |
| Column | C18(250mm×4.6mm×5µm) |
| Mobile Phase | Na2HPO4:ACN (50:50v/v ) with pH adjusted to 4.8 |
| Flow rate (ml/min) | 1 |
| Run time | 6 |
| Injection volume(µl) | 10 |
| Detection wavelength (nm) | 242 |
| Rt (min) | 3.876 min |
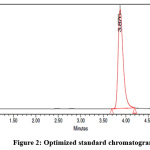 |
Figure 2: Optimized standard chromatogram Click here to View Figure |
Assay of marketed formulation:
Standard and sample solutions are injected into HPLC separately to obtain chromatograms are recorded and the percentage of drug is calculated and the results were mentioned in the Table 2.
Table 2: Assay of formulation
| S.No | Assay Percentage |
| 1 | 99.25 |
| 2 | 99.43 |
| 3 | 99.26 |
| 4 | 99.38 |
| 5 | 99.30 |
| 6 | 99.29 |
| Standard deviation | 0.068 |
| % RSD | 0.07 % |
Method validation
Linearity
Different concentrations of calibration solutions were produced to study linearity [21, 22]. R2 for the Sarecycline Hydrochloride was 0.9998. The method found linear from 50 to 150 µg/ml Sarecycline. The data obtained for linearity study of Sarecycline is given in Table 3 and linearity plot was drawn as shown in the Figure 3.
Table 3: Sarecycline linearity
| Calibration solution | Sarecycline(µg/ml) | Sarecycline peak area | Retention time |
| 1 | 50 | 2066023 | 3.867 |
| 2 | 75 | 3096395 | 3.864 |
| 3 | 100 | 4123873 | 3.868 |
| 4 | 125 | 5150306 | 3.867 |
| 5 | 150 | 6186308 | 3.744 |
| Equation | Peak area = 41217 x + 2424 | ||
| Regression coefficient | 0.9998 | ||
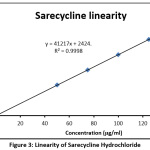 |
Figure 3: Linearity of Sarecycline Hydrochloride Click here to View Figure |
Accuracy
Recovery study was performed to determine the method accuracy at 49.5, 99.0 and 148.5 µg/ml (50, 100 and 150% levels) concentration of Sarecycline RS was added to tablet solution that is pre analyzed. For each concentration level, the percent recovery of Sarecycline added was determined .The values revealed that the method is accurate for evaluation of Sarecycline. Interference from tablet excipients was not found during evaluation of Sarecycline. Accuracy data and chromatograms were shown in the Table 4 and Fig 4 respectively.
Table 4: Accuracy of Sarecycline Hydrochloride:
| Spiked level | SarecyclineArea | Sarecycline added(µg/ml) | Sarecycline found(µg/ml) | Sarecycline Recovered% | % Mean recovery |
| 50% Level | 2062429 | 49.500 | 49.66 | 100.31 | 100.27 |
| 2060230 | 49.500 | 49.60 | 100.21 | ||
| 2061770 | 49.500 | 49.64 | 100.28 | ||
| 100% Level | 4126786 | 99.000 | 99.36 | 100.36 | 100.36 |
| 4124933 | 99.000 | 99.31 | 100.32 | ||
| 4128309 | 99.000 | 99.39 | 100.40 | ||
| 150% Level | 6188322 | 148.500 | 148.99 | 100.33 | 100.30 |
| 6183530 | 148.500 | 148.88 | 100.25 | ||
| 6187337 | 148.500 | 148.97 | 100.31 |
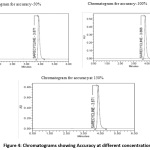 |
Figure 4: Chromatograms showing Accuracy at different concentration Click here to View Figure |
Precision
The precision data was determined using six replicates peak area of Sarecycline standard solution (100 mg/ml). Relative standard deviation of Sarecycline peak area is calculated and was less than 2%. The values revealed that the method is precise for evaluation of Sarecycline. The precision data is given in Table 5 and the chromatograms for precision is given in Fig.5
Table 5: Precision data for Sarecycline
| Sarecycline -100µg/ml | |
| Injection. | Sarecycline peak area |
| 1 | 4122502 |
| 2 | 4129745 |
| 3 | 4123040 |
| 4 | 4127866 |
| 5 | 4127814 |
| 6 | 4124015 |
| Mean | 4125830 |
| Std deviation | 3018.6979 |
| % RSD | 0.0732 |
| Figure 5: Chromatograms for Precision Click here to View Figure |
Robustness
Robustness was established by doing deliberate changes in flow rate and different pH values and the study data was given in the Table 6.
Table 6: Robustness data
| Alternation in condition | Tailing of peak | Area response | Plate count |
| Flow rate in column: 0.9 (ml/min) | 1.32 | 3311701 | 4539 |
| Flow rate in column:1.1 (ml/min) | 1.33 | 5870815 | 5566 |
| pH: 4.7 units | 1.48 | 4536786 | 5973 |
| pH: 4.9 units | 1.31 | 4224933 | 5982 |
| Acetonitrile portion in mobile phase: 45 (%) | 1.41 | 4077561 | 6010 |
| Acetonitrile portion in mobile phase: 55 (%) | 1.34 | 3607336 | 5954 |
| Temperature of column: 23 (˚C) | 1.30 | 3308037 | 4458 |
| Temperature of column: 27 (˚C) | 1.34 | 5901970 | 5173 |
LOD and LOQ
LOD & LOQ were found to be 0.157, 0.523 μg/ml respectively & were found within limits and the study data and chromatograms were given in the Table 7 and Fig 6.
Table 7: LOD and LOQ for Sarecycline hydrochloride
|
Sr. No |
Parameter | Retention time | Area | S/N |
| 1 | LOD | 3.870 | 5320 | 3.08 |
| 2 | LOQ | 3.810 | 27961 | 10.35 |
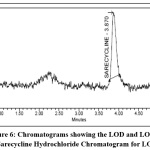 |
Figure 6: Chromatograms showing the LOD and LOQ for Sarecycline Hydrochloride Chromatogram for LOD Click here to View Figure |
Chromatogram for LOQ
Forced Degradation studies
Degradation by acid condition
10 ml of Sarecycline 1000 µg/ml tablet stock solution is taken in100ml vol. flask and add 10 ml of 0.1N HCl , sonicate for 30min at ambient temperature, neutralize with 0.1 NaOH and make up the volume to 100ml volume with mobile phase[22]. This degraded sample solution was analyzed placed in vial and injected into system to obtain chromatogram. The degradation percent of Sarecycline was estimated from peak area values acquired has been added adequately and the chromatogram of acid degradation sample was shown in the Fig 7.
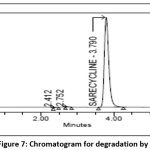 |
Figure 7: Chromatogram for degradation by acid Click here to View Figure |
Degradation by alkaline condition
10 ml of 1000 µg/ml Sarecycline tablet stock solution is taken in vol. flask (100ml) and add 10 ml of 0.1 N NaOH and sonicated for 30 min .Neutralize with 0.1N HCl and make up the volume with diluent and record chromatogram[23] and the chromatogram of alkaline degradation sample was shown in the Fig 8.
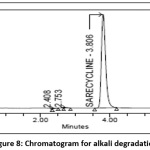 |
Figure 8: Chromatogram for alkali degradation Click here to View Figure |
Degradation by peroxide
10ml of stock solution is mixed with 10ml of 30% hydrogen peroxide (H2O2) and shaken continuously using sonicator for 30 min at ambient temperature and volume was made to 100ml with 0.01mg/ml as the theoretical concentration and was analyzed using given optimized chromatographic conditions and the degradant percent is acquired from peak area values and the chromatogram of peroxide degradation sample was shown in the Fig 9.
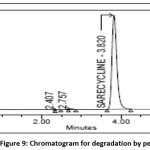 |
Figure 9: Chromatogram for degradation by peroxide Click here to View Figure |
Degradation by Heat
Powder form of tablet weighing 100mg of Sarecycline API was taken into petri dish and positioned for 6hrs in hot air oven at 105ᵒC and sample was cooled down to bring down the temperature and transferred into standard flask (100ml), dissolve & make up the volume to 100 ml. Similarly prepare 100µg/ml and analysis was carried and degradant percent is calculated from peak area and the chromatogram of thermal degradation sample was shown in the Fig 10.
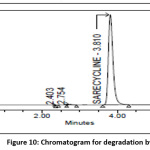 |
Figure 10: Chromatogram for degradation by heat Click here to View Figure |
Degradation by sunlight (Photolytic degradation)
Powder form of tablet weighing 100mg is taken into petri plate placed for 6 hr in sunlight the sample was brought to normal temperature and transferred into standard volumetric flask (100ml).After suitable dilution to get100µg/ml, the degradant percent is estimated and the chromatogram of photolytic degradation sample was shown in the Fig 11.
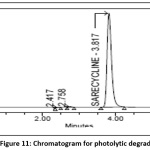 |
Figure 11: Chromatogram for photolytic degradation Click here to View Figure |
Degradation study of Sarecycline
The order of stability of Sarecycline is
Peroxide ˃ Sunlight ˃ NaOH ˃ HCl ˃ Dry heat
Two degradants were observed and these degradant peaks were resolved good from the Sarecycline peak. These results indicated that the method is specific and stability indicating for evaluation of Sarecycline in vicinity of degradants. The forced degradation data was shown in the Tables 8, 9.
Table 8: Sarecycline stability data.
| Condition | Area | Sarecycline assay% | Sarecycline degraded% | Rt of degradation products |
| Sample without degradation | 4120250 | – | – | – |
| Alkali | 3764973 | 90.65 | 9.35 | 2.408 min, 2.753 min |
| Acid | 3697561 | 89.02 | 10.98 | 2.412 min, 2.751 min |
| Photo | 3794840 | 91.37 | 8.63 | 2.417 min, 2.758 min |
| Dry heat | 3664638 | 88.23 | 11.77 | 2.403 min, 2.754 min |
| Peroxide | 3892725 | 93.72 | 6.28 | 2.407 min, 2.757 min |
Table 9: Complete degradation data
| S.No | Type of stress | Assay% | %Degradant | Rt | Purity angle | Purity threshold | Peak purity (pass/fail) |
| 1 | Acid | 89.02 | 10.98 | 4.038 | 0.347 | 0.972 | Pass |
| 2 | Base | 90.65 | 9.35 | 4.006 | 0.455 | 0.775 | Pass |
| 3 | Peroxide | 93.72 | 6.28 | 4.015 | 0.331 | 0.871 | Pass |
| 4 | Dry heat | 88.23 | 11.77 | 4.020 | 0.346 | 0.872 | Pass |
| 5 | Sunlight | 91.7 | 8.63 | 4.028 | 0.234 | 0.971 | Pass |
A degradation data result shows that peak threshold is greater than peak angle indicating the method is sensitive and reliable.
Conclusion
An easy and speedy liquid chromatographic method to estimate the Sarecycline in tablets has been developed and validated for parameters such as sensitivity, precision, accuracy, robustness, specificity and linearity. The method was proven to be specific under stress conditions such as basic, acidic, oxidative, photo and thermal and do not have interference of excipients. The proposed method could be useful for routine analysis in quality control labs.
Acknowledgment
Authors are thankful to Management & Principal of Sultan-ul-Uloom College of pharmacy, for providing research facilities for this work.
Conflicts of Interests
The authors declare that they have no conflict of interest
References
- George, Z.; Ian, C.; Lynn, Y .L.; Nancy, A.,Chemother, 2019 , 63(1), 264-271.
- Leyden, J.J.; Sniukiene,V.; Berk, D.R.; Kaoukhov,A., J. Drugs Dermatology, 2018, 17 (3), 333-338.
- A.; Swati, R.G.A., Int.Res. J. Pharm. Biosci., 2017, 4, 41-50.
- S.; Swapnil,G.; Kalindi,C.A.; Int. J. Appli. Pharma., 2018,10(6),128-135
- Riddhiben,M.P.; Piyushbhai,M.P.; Natubhai,M.P., Res. J. Pharm.,2011,2(5), 79-87
- Kanthale, S.B.; Thonte, S.S.; Supekar, B.B., J. Pharm. Sci & Res, 2019, 10(4), 1625-31.
- Charde,M.S.; Kumar,J.; Welankiwar,A.S.; Chakole,R.D., Int. J. of Advances in Pharmaceutics, 2013; 2(3),34-39.
- Rawat, T.;Pandey, I.P., J. Pharm. Sci. and Research, 2015; 7(5),12-38.
- Shinde, N.G.; Bangar, B.N.; Deshmukh,S.M.; Sulake,S.P.; Sherekar, D.P., J.Res. Pharm. Sci., 2013; 3(4), 178-188.
- Saimala,K. D.; Kumar,V.R.; Reddy, T.R.; Ajitha,A.; Rao, V.U., J. Pharm. Research & Review, 2014; 3(10): 46-57.
- Prathap,B, Rao, G..H.; Devdass, G.; Dey, A.; Harikrishnan,N., J. Innovative Pharm. Research, 2012, 3(3), 229-237.
- Carr,G.P.; Wahlich,J.C., Pharm. Biomed. Anal., 1990,86,613- 18.
- Lavanya, G.; Sunil, M.; Eswarudu,M.M.; Eswaraiah., J. Pharm. Sci. Res., 2013;4,1280-89
- Ravichandran,V.; Shalini,S.; Sundram,K.M.; Harish, R., J.Pharm Pharm.Sci., 2010;2,18-27.
- Srivastava, R.K.; Kumar, S.S., J. Phar. Med Res., 2017,4,774-84
- Uttam, P.P.; Sunil, K. R.A., J.Chem., 2015, 31(3), 1489-1507
- Nayudu, S.T.; Suresh, P.V.; J. Pharm Chem. Res., 2017,3,283-93
- Pushpa,L.E.; Sailaja, B., Med. Pharm. Innov.,2014;21,1-9.
- Geetha, G.; Raju, K.N.; Kumar, B.V.; Raja, M.G., J. Pharm Bio. Sci., 2012; 11, 64-71.
- Devi, T.P.; Setti,A.; Srikanth, S.; Nallapeta,S.; Pawar, S.C.; Rao, J.V., Med Allied Sci.,2013,3(8),145-56.
- Annapurna,M.M.;Chitaranjan,M.;Narendra,A., Pharm. Analysis., 2012,2(4), 298-305
- Vibha, G.; Ajay, D.K.; Gill,N.S.; Kapil,G., Int. Research J. Pharma.& Appli. Sci., 2012, 2(4), 17-25.
- Lakshmana, R.A.; Srilakshmi,P., Orient. J. Chem., 2008, 24(3), 1143-44

This work is licensed under a Creative Commons Attribution 4.0 International License.
![]()
A New Edition of Web of Science
Journal Impact Factor
2022: 0.5
Five Year: 0.8
Journal is Indexed in

Cabells Whitelist
![]()


