The Use of Salacca Zalacca Extract as Reducing Agent to Synthesize Silver Nanoparticles (Agnps) and the Antibacterial Activities
Lis Permana Sari , Zuhdi Saputro*, Maximus Pranjoto Utomo and Anti Kolonial Prodjosantoso
Department of Chemistry, Yogyakarta State University, Yogyakarta, 55281, Indonesia.
Corresponding Author E-mail: lis_permana@uny.ac.id
DOI : http://dx.doi.org/10.13005/ojc/350513
Article Received on : 15-08-2019
Article Accepted on : 25-09-2019
Article Published : 09 Oct 2019
In general, leaf, flower, and fruit of plants contain organic compounds which may reduce metal salts to nanosize metals, or nanoparticles (NPs). The extract of snake fruit (Salacca zallaca) has been used to synthesize silver nanoparticles (AgNPs) using green-one pot method. Some reaction variables ie. incubation time, Salacca zallacca extract concentration, and pH of the mixture of AgNO3 and the extract have been set-up and controlled.
The AgNPs were characterized using UV-Vis, FTIR, XRD, and TEM methods. Testing the antibacterial activity of AgNPs was undertaken using the disk diffusion method by measuring the inhibition zones of Staphylococcus aureus and Salmonella typhi bacteria.The AgNPs can be prepared by reducing Ag+ using Salacca zalacca extract as reducing agent. The formation of AgNPs are affected by the incubation time, extract concentration, and pH of the solution. The AgNPs indicate SPR peak absorption at 400-530 nm, and centered cubic (fcc) structures with a particle size of 10 nm. The AgNPs show antibacterial activity against Staphylococcus aureus and Salmonella typhi bacteria.
Agnps; Antibacterials; Salacca Zalacca; Staphylococcus Aureus; Salmonella Typhi
Download this article as:| Copy the following to cite this article: Sari P. L, Saputro Z, Utomo M. P, Prodjosantoso A. K. The Use of Salacca Zalacca Extract as Reducing Agent to Synthesize Silver Nanoparticles (Agnps) and the Antibacterial Activities. Orient J Chem 2019;35(5). |
| Copy the following to cite this URL: Sari P. L, Saputro Z, Utomo M. P, Prodjosantoso A. K. The Use of Salacca Zalacca Extract as Reducing Agent to Synthesize Silver Nanoparticles (Agnps) and the Antibacterial Activities. Orient J Chem 2019;35(5). Available from: https://bit.ly/335bZBW |
Introduction
Nanotechnology developes verry fast mainly in the field of biotechnology in the last few decades.1 The research on nanoparticle brings important aspects due to of its countless applications. The applications of nanoparticle in the fields of biomedicine, sensors, antimicrobials, catalysts, electronics, fiber optics, agriculture, and biolabels have experienced significant achievements.2 Nanoparticles having size less than 100 nm often show unique properties compared to macro scale, because its have a high surface ratio.3 The nanoparticles of silica-germanium, silver, gold, platinum, and zinc have been studied intesively and applied.4
Since the research of AgNPs, the antibacterial effect of these materials has attracted many researchers. Silver is a non-toxic metal and is capable of killing around 650 types of diseases caused by microorganisms. At the same weight, the antibacterial activity of silver in nano size (AgNPs) is superior to micro size.5
Several methods have been developed to prepare of AgNPs. The most commonly used methods of preparation of AgNPs are physical and chemical methods. However, the use of these methods have many disadvantages due to the application in the health sector may become dangerous. For this reason, new methods have been developed in the preparation of AgNPs involving biosynthesize methods.6 Methodology has opened the way for greener preparations in the manufacture of AgNPs. Preparation of AgNPs with this method has several advantages, one of which is the use of environmentally friendly materials.7 Some biological materials are used in the preparation of AgNPs such as plant extracts,8 bacteria,9 fungi,10 and enzymes.11 Among the sources of these natural materials, plant extracts are the most widely available and simpler source of use.12 Extracts from plants can act as reducing agents and stabilizing of AgNPs.13 The extracts are believed containing secondary metabolites such as alkaloids, tannins, flavonoids, steroids, and phenols.14 The parts of the plant known to be used for the preparation of AgNPs are fruit,15 leaves, and seeds. Since fruit contains high secondary metabolites, fruit is widely used in the preparation of AgNPs. Fruit is potential to be used as a reduction and stabilizer agent of metal ions.16
Salacca zalacca plant grows very well in humid and tropical climates. This fruit is abundant in Yogyakarta, Indonesia. The chemistry of Salacca zalacca fruit has not well defined yet, but a reprot confirms that Salacca zalacca contains phytochemical compounds such as tannins, flavonoids, alkaloids.17 The compounds have high potential as reducing agent and stabilizer in the preparation of AgNPs.
Several factors influence the formation of AgNPs. These factors include incubation time, reducing agent concentration, and pH of the reducing agent solution.8 The as prepared AgNPs can be characterized by using a series method. The methods include Ultraviolet-Visible (UV-Vis) Spectrophotometry, Fourrier-Transform Infrared (FTIR) Spectrophotometry, X-Ray Diffraction (XRD), and Transmission Electron Microscopy (TEM).18
In nanoparticle preparation from the perspective of green chemistry, three main steps must be considered, namely the selection of solvents used for preparation, reducing agents which are environmentally friendly, and non-toxic materials for nanoparticle stabilization.19 In this study, the AgNPs were prepared by using aquadest as a solvent and Salacca zalacca extract as reducing agents, which are considered safe, environmentally friendly and non-toxic.
Research Methods
Salacca zalacca were collected from a local market in Yogyakarta, Indonesia. Silver nitrate (AgNO3, Merck, 99.5%), pH 3 acetate buffer, pH 6 phosphate buffer, Gram-positive bacteria (Staphylococcus aureus), Gram-negative bacteria (Salmonella typhi), are used without any pretreatments. Bacterial culture was cultivated on Mueller Hinton Agar (Oxoid) media.
The UV-Vis spectrum of AgNPs was recorded as a wavelength function using Japan’s Shimadzu UV-2400 PC Series UV-Vis Spectrophotometer. A number of samples of AgNPs colloids were inserted into cuvettes and measured using a UV-Vis spectrophotometer in a wavelength range of 300 nm-700 nm. The XRD diffractograms of AgNPs were collected by using Rigaku Miniflex 600 Benchtop X-Ray Diffraction (XRD) which was operated at 40 kV and 15 mA, Cu-Kα radiation with λ = 1.54 Å in the 2θ range of 5-90°. The shape and size of AgNPs were observed using JEOL JEM-1400 Transmission Electron Microscopy (TEM). One drop of colloidal AgNPs was placed on a TEM grid made of carbon-coated copper and air-dried. The TEM was operated at 80 kV. Functional groups in Salacca zalacca extract which serves as bioreductor were observed using Fourier Transform Infrared (FTIR) Thermo Nicolet Avatar 360 operated in the wavenumber range of 400-4000 cm-1.
Salacca zallaca extract is prepared by blending 100 grams of clean Salacca zallaca fruit with 100 ml aquadest (1 to 1 proportion). The blended Salacca zallaca fruit was filterred off using filter paper, and the filtrate is isolated. The fresh Salacca zallaca extract can be temporarily stored for further testing or used directly as reducing agents and stabilizers.
The AgNPs were prepared by mixing 4 mL of Salacca zallaca extract with 200 mL of 1.25 mM AgNO3 solution. The mixture is stirred with magnetic stirrer for 5 minutes, and incubated in a dark room. A 3.5 mL mixture was taken for measurement by using UV-Vis spectrophotometer at 5 minutes, 15 minutes, 30 minutes, 60 minutes, 24 hours, 48 hours, and 72 hours of incubations. The measurement was also undertaken using Salacca zallaca extract with the ratio 1:2, 1:1, and 2:1, to study the effect on the prepared AgNPs at the optimized incubation time.
The effect of pH of the mixture to the prepared AgNPs was studied by adding acetate and phosphate buffer solution for pH 3 and 6, respectively. The pH of as prepared mixture is 4. The optimized Salacca zallaca extract concentration and incubation time were applied in this experiment.
The antibacterial activity of AgNPs were studied using the diffusion disk method (Kirby and Bauer test) by measuring the inhibition zones of the growth of Staphylococcus aureus and Salmonella typhi bacteria. Some antibacterial samples such as AgNPs, silver nitrate (AgNO3), salacca extract, and chloramphenicol were determined. In each sample, blank disk is diped and soaked for 20 minutes. Each blank disc is then drained and placed on Mueller Hinton Agar (MHA) media for the testing phase. Antibacterial activity test was carried out with three repetitions (triplo). The inhibition zone (clear area) is measured at every 3 hours for 72 hours using the calipers.
Results and Discussion
Silver nanoparticles were prepared by reducing AgNO3 using Salacca zallaca extract. The reduction of silver ions (Ag+) into AgNPs (Ago) can be recognized with the existence of the color change. A few hours after being incubated in a dark room, the color of the AgNPs solution was gradually changed from yellow to reddish brown in the longer incubation time. Four series of discoloration that occurs are yellow as delta (δ), light brown as gamma (γ), bright reddish brown as beta (β), and in reddish brown as alpha (α) (Figure 1). Alpha consists of maximum nanoparticle concentration of AgNPs, while beta consists of fewer nanoparticles than alpha. Gamma consists of concentrations of nanoparticles less than beta, and delta consists of the fewest nanoparticles.20
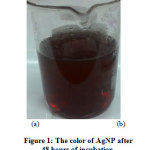 |
Figure 1: The color of Agnp after 48 hours of incubation. Click here to view figure |
During the incubation in the dark room, silver ions undergo a reduction reaction for a certain period of time producing AgNPs. The color change of the AgNP solution is depending on the incubation time. The absorbances of the AgNPs solutions incubated for 5 minutes, 15 minutes, 30 minutes, 60 minutes, 24 hours, 48 hours, and 72 hours were observed by using the UV-Vis spectrophotometry method.
The increase and decrease of absorbance peaks are observed of the AgNPs solutions incubated for 5 minutes, 15 minutes, 30 minutes, 60 minutes, 24 hours, 48 hours, and 72 hours (Figure 2.). A peak increases when the reaction lasts up to 48 hours and decreases after 72 hours. The highest peak, which is the optimum SPR phenomenon, is observed at the incubation time of 48 hours at a maximum wavelength of 437 nm,21 and absorbance of 0.815.
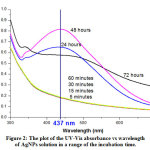 |
Figure 2: The plot of the UV-Vis absorbance vs wavelength of AgNPs solution in a range of the incubation time. Click here to view figure |
The concentration of extract is one of the factors influencing the formation of AgNPs. Some variations in extract to water volume of 1:2, 1:1, to 2:1 ratios were prepared to test the effect on the AgNPs. Each extract with certain concentration produces a solution color change, which is possible to be measured using a UV-Vis spectrophotometer.
The exixtences of absorbance peak were observed from the extract to water ratio of 1:2, 1:1, to 2:1 (Figure 3). Three peaks appear at wavelengths of 345 nm, 421.50 nm and 428.50 nm with the absorbance of 0.843; 0.853; and 0.854, respectively, from the mixture of extract to water ratio of 2:1. This was confirmed that spherical-shaped AgNPs only indicates one SPR absorption peak, if more than the other form of AgNPs such as nanorod or triangular nanodisc exists.22
 |
Figure 3: The plot of the UV-Vis absorbance vs wavelength of AgNPs solution synthesized using a range of the extract contration. Click here to view figure |
Single peak (Figure 3.) exists from the extract to water ratio of 1:1, a maximum wavelength of 444.50 nm, and absorbance of 0.515. This was confirmed by Gomathi, et al.23 stated that the formation of AgNPs determined from the appearance of SPR peaks around 444 nm having the particle size about 15-20 nm and the fcc structure. Base on the measurements the extract to water ratio of 1:1 is the optimum concentration of extract.
The pH of the solution may influence to the formation of AgNPs. The pH buffer solution was added to adjust the pH of the AgNPs solution. Different colors were experienced by the pH 3, pH 4, and pH 6 solutions.
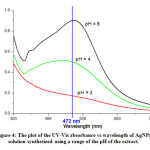 |
Figure 4: The plot of the UV-Vis absorbance vs wavelength of AgNPs solution synthesized using a range of the pH of the extract. Click here to view figure |
The AgNP solutions of different pH show absorbance peaks, except for solutions of pH = 3 (Figure 4). The high pH solution indicates the strong absorbance peak, because of more phenolic functional groups available to facilitate binding with more Ag+ ions and forming smaller diameter AgNPs. The solution with pH = 6 indicates absorbance peak of 0.903 measured at a maximum wavelength of 472.50 nm. This peak corresponds to the surface Plasmon’s resonance (SPR) peak characteristics of AgNPs. A study suggests that AgNPs with SPR peak around 472 nm have a spherical shape particle and size of 17 nm.24 Based on this reason, the pH = 6 is the optimum pH for the preparation of AgNPs.
The functional groups in AgNPs solution were studied by using FTIR spectroscopy method. The functional groups in the AgNPs solution are possible derived from organic material or Salacca zalacca extract as reductor. Identification of functional groups can be undertaken by observing the peak existed. Here are several peaks in FTIR spectrum of AgNP solution (Figure 5. and Table 1.).
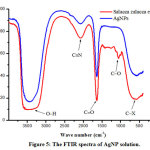 |
Figure 5: The FTIR spectra of AgNP solution. Click here to view figure |
Table 1: Assignment of AgNPs and the Salacca zalacca extract.
|
No |
Salacca zalacca extractwavenumber (cm-1) | AgNPs wavenumber(cm-1) | Assignments |
| 1.2.3.4.5. | 3478206916331055582 | 343920771633-584 |
O H stretching C N stretching C O stretching C O stretching C X stretching |
Based on Table 1, the functional groups participating in the formation of AgNPs are identified. Some functional groups involved in the process of preparing AgNPs are carboxyl, hydroxyl and amide groups.8
A peak identified as carbonyl group C = O (amide), a character of protein, is observed at a wavenumber of 1633 cm-1. The protein having carbonyl groups is believed to be part of Salacca zalacca extract,25 which could act as reducing and stabilizer agents for AgNPs.26 The carbonyl groups of amino acid have the ability to bind metals strongly.
X-ray Diffraction (XRD) testing is used to study the structure and size of the AgNPs crystals. The XRD difractogram of the sample indicates the presence of AgNPs and unknown species (Figure 6.). There are three main diffraction peaks at 2q = 38.25o, 44.45o and 77.60o which are in accordance with the standard data of the Joint Committee on Powder Diffraction Standards (JCPDS file No. 04-0783). The peaks can be indexed into the reflection field (hkl) of (111), (200) and (311). Therefore, AgNPs have a face centered cubic (fcc) structure. The AgNPs show the favored growth orientation in the direction (111).13
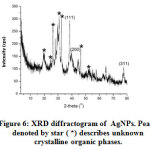 |
Figure 6: XRD diffractogram of AgNPs. Peaks denoted by star ( *) describes unknown crystalline organic phases. Click here to view figure |
The crystallite size of AgNPs was calculated using the Debye Sherrer equation (Equation 1), with the β is the Full Width at Half Maximum (FWHM), the K is 0.9 and the λ is the wavelength of X-rays (1.54059 Å). The Debye Scherrer equation shows that the value of the crystallite size will be inversely proportional to the value of FWHM. The calculated ln 1/cos θ and ln β are listed in Table 2. The relationship between ln 1/cos θ (the y-axis) and ln β (the x-axis) generates the intercept valued of ln Kλ/D (Figure 7). Thus, the particle size D can be expressed as

where the intercept is – 4.29579. The particle size D is determined as 10.176 nm.
![]()
Table 2: Calculation of (ln 1/cos θ) and (ln β).
|
2ϴ |
1/cos ϴ | FWHM (β) rad | ln (1/cos ϴ) | ln β |
| 38.25 | 1.0584 | 0.0147 | 0.0568 |
-4.2231 |
|
44.45 |
1.0803 | 0.0150 | 0.0772 | -4.1996 |
| 77.60 | 1.2831 | 0.0187 | 0.2493 |
-3.9811 |
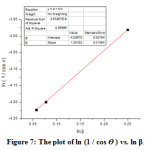 |
Figure 7: The plot of ln (1 / cos ϴ ) vs. ln β. Click here to view figure |
TEM is used to obtain information about amorphology and size of AgNPs. A selected TEM micrograph of AgNPs can be seen in Figure 8. The AgNPs have sperical shape with diameter range between 6.28 to 23.87 nm. The AgNPs have an average size distribution of 10.7 nm with a standard deviation of 2.975 (Figure 9.). The shape and size of the as prepared AgNPs indicate that the particles are stabilized.27
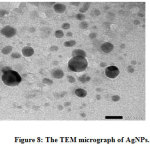 |
Figure 8: The TEM micrograph of AgNPs. Click here to view figure |
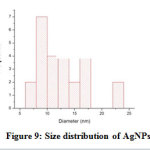 |
Figure 9: Size distribution of AgNPs. Click here to view figure |
Antibacterial activity test aims to study the bacterial growth responses to antibacterial agents. Diffusion disk method is used in the antibacterial activity testing. The bacteria inoculated in agar media were Staphylococcus aureus (Gram-positive bacteria) and Salmonella typhi (Gram-negative bacteria). The test samples used to inhibit bacterial growth were AgNPs, silver nitrate (AgNO3), Salacca zalacca extract, and chloramphenicol. The samples are inserted into the media using blank discs. After a few hours, the media is blurred meaning that the bacteria have grown. The selected images of testing antibacterial activity using Agar media after 24 hours are presented in Figure 10. The clear area in the image indicates that bacterial growth has been inhibited. As the incubation period passes, the clear areas of the media appear to be clearer and the average diameter is getting longer. Measuring the diameter of the clear area is undertaken to determine the inhibition zone of bacteria. The wider of the inhibition zone is meant the higher of the antibacterial activity. Observations and measurements of bacterial inhibition zones were carried out within 3 hours during the incubation process (48 hours). The inhibitory zone of each sample in the Staphylococcus aureus and Salmonella typhi bacteria are diagrammed in Figure 11.
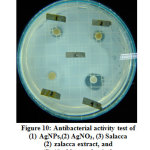 |
Figure 10: Antibacterial activity test of (1) AgNPs, (2) AgNO3, (3) Salacca zalacca extract, and (4) chloramphenicol. Click here to view figure |
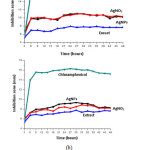 |
Figure 11: The plot of bacterial inhibition zones of (a) Staphylococcus aureus and (b) Salmonella typhi Click here to view figure |
The different inhibition zones in each sample over the incubation time are described (Figure 11). Every test sample indicates characteristics antibacterial ability. A statistical analysis of the inhibitory zone with the One Way ANOVA Test method is undertaken to describe the characteristics antibacterial ability. The results of the one-way ANOVA Test using the SPSS 16.0 program are tabulated in Table 3.
Table 3: The one way ANOVA test results
|
Samples |
Staphylococcus aureus | Salmonella typhi | ||
| Mean ± SD | Sig. (p) | Mean ± SD |
Sig. (p) |
|
|
AgNPs |
10.0694±1.16874 | 0.000 |
8.4167±1.27717 |
0.000 |
|
AgNO3 |
10.0743±1.30272 |
8.0042±1.29569 |
||
|
Salacca zallacca extract |
7.3104±0.82026 |
7.1708±0.86483 |
||
|
chloramphenicol |
17.7222±3.44086 |
15.0403±2.64254 |
||
The One Way ANOVA test indicates a confidence level of 95% and a significance value of 0% (p = 0,000) obtained. This p-value is smaller than 0.05 (p <0.05), meaning the difference between significant variables is existed so that Ho is rejected. There is an influence between each test sample on the zone of bacterial growth inhibition based on incubation time. This shows that all test samples have antibacterial activity to Gram-positive and Gram-negative bacteria.
The AgNPs show antibacterial activity by giving an inhibition zone average of the growth of Staphylococcus aureus and Salmonella typhi by 10.0694 ± 1.16874 mm and 8.4167 ± 1.27717 mm, respectively. The silver content in AgNPs is the cause of its antibacterial activity. Silver is an antimicrobial agent that can kill more than 650 microorganisms like Gram-positive and Gram-negative bacteria, fungi, and viruses. According to Abalaka, et al.,28 the AgNPs can inhibit the growth of several pathogenic bacteria, including Escherichia coli, Salmonella typhi, Pseudomonas aerugenusa, and Staphylococcus aureus. The antibacterial effect of AgNPs can be explained by the interaction between the nanoparticles and the cell membrane. Penetrating nanoparticles into bacteria may change the structure of cell membranes such as increasing membrane permeability, disrupting osmosis potential, and finally disturbing cells.29 Another review also explains that AgNPs have excessive affinity to interact with phosphorus and sulfur content in extracellular biomolecules (membranes, proteins) and intracellular (DNA bases, proteins). These biomolecules affect cell division, respiration, and cell survival.30
Silver nitrate indicates antibacterial activity by giving an inhibition zone average of the growth of Staphylococcus aureus and Salmonella typhi and Salmonella typhi by 10.0743 ± 1.30272 mm and 8.0042 ± 1.29569 mm, respectively. The antibacterial activity of silver nitrate (AgNO3) is caused by the interaction of free silver ions (Ag+) with bacteria. The Ag+ ions penetrate and enter the bacterial cell wall. The Ag+ ions denaturate DNA causing DNA becomes thick and loses the ability to replicate. In addition, these ions can also interact with thiol groups in proteins, causing bacterial proteins to be inactive. The Staphylococcus aureus and Escherichia coli bacteria exposed to Ag+ silver ions will be destroyed or die.31
Salacca zalacca extract indicates antibacterial activity by showing an inhibition zone average of the growth of Staphylococcus aureus and Salmonella typhi of 7.3104 ± 0.82026 mm and 7.1708 ± 0.86483 mm, respectively. According to the study, the ethanol extract of Salacca zalacca contains active compounds such as tannins, flavonoids and alkaloids, which can inhibit the growth of bacteria.17 Some phytochemicals can inhibit bacterial growth, disrupt cell membranes and microbial metabolic processes, and modulate transduction signals or genetic pathways.32
Chloramphenicol indicates antibacterial activity by giving an inhibition zone average of the growth of Staphylococcus aureus and Salmonella typhi of 17.7222 ± 3.44086 mm and 15.0403 ± 2.64254 mm, respectively, which is the biggest among the other test samples. According to Donkor et al.,33 chloramphenicol is one of the drugs with a high level of resistance to Staphylococcus aureus (80%) and Salmonella typhi (83%). Chloramphenicol is a broad-spectrum antibiotic, which can inhibit the growth of Gram-positive and Gram-negative bacteria. In working mode, chloramphenicol shows bacteriotatic activity, which specifically inhibits protein synthesis in bacteria. Moreover, chloramphenicol also shows bactericidal activity against three of the most common causes of meningitis such as Haemophilus influenzae, Streeptococcus pneumoniae, and Neisseria meningitides.34 (Dinos, et al., 2016).
In summary, all four test samples indicate to have antibacterial activity. Chloramphenicol indicates the largest inhibition zone in both the Staphylococcus aureus and Salmonella typhi bacteria. The Salacca zalacca extract shows the smallest inhibition zone. Meanwhile, AgNPs and AgNO3 have almost the same inhibition zones.
Acknowledgements
This research was supported and fully funded by the Yogyakarta State University of Indonesia.
Conflict of Interest
The authors declare that there is no conflict of interests regarding the publication of this article.
Refrences
- Natarajan, K.; Selvaraj, S.; Murty, V.R., Dig. J. Nanomater. Bios., 2010, 5, 135-140.
- Kavitha, K.S..; Baker, S.; Rakshith, D.; Kavitha, H.U.; Rao, H.C.Y.; Harini, B.P.; Satish, S., Int. Res. J. Biological Sci., 2013, 2, 66-76.
- El-Nour, K.M.M.A.; Eftaiha, A.; Al-Warthan, A., Arab. J. Chem., 2010, 3, 135–140.
- Salam, H.A.; Rajiv, P.; Kamaraj, M., I. Res. J. Biological Sci.,2012, 1, 85-90.
- Jeong, S.H.; Yeo, S.Y.; Yi, S.C., J. Mater. Sc., 2005, 40, 5407-5411.
- Jain, N.; Bhargava, A.; Majumdar, S., Nanoscale, 2011, 3, 635-641.
- Singh, A.; Jain, D.; Upadhyay, M.K.; Khandelwal, N., Dig. J. Nanomater. Bios., 2010, 5, 483-489.
- Ibrahim, H.M.M., J. Rad. Res. App. Sc., 2015, 8, 265-275.
- Saravanan, C.; Rajesh, R.; Kaviarasan, T., Biotechnology Reports, 2017, 15, 33–40.
- Muthamil, S.; Devi, V.A.; Balasubramaniam, B., J. Basic Microbiol., 2018, -, 1–15.
- Mishra, A.; Sardar, M., Sci. Adv. Mater., 2012, 4, 143-146
- Brahmachari, G.; Sarkar, S.; Ghosh, R., Org. Med. Chem. Let., 2014,4, 1-10.
- Sur, U.K.; Ankamwar, B.; Karmakar, S., Mater. Today: Proceedings, 2018, 5, 2321–2329.
- Kaushik, U.; Joshi S.C., Asian J. Pharm. Clin. Res., 2015, 8, 179-184.
- Jain, D.; Daima, H. K.; Kachhwaha, S.; Kothari, S. L., Dig. J. Nanomater. Bios., 2009, 4, 557-563.
- Shankar, T.; Karthiga, P.; Swarnalatha, K., Resour. Eff. Tech., 2017, 3, 303–308.
- Nurina, C.I.E.; Samingan; Iswadi, Jurnal Biologi Edukasi 2014, 12, 19-23.
- Yildiztekin, M.; Nadeem, S.; Yildiztekin, F., Indian J Pharm Sci, 2017, 79, 536-543.
- Raveendran, P.; Fu, J.; Wallen, S.L., J. Am. Chem. Soc., 2003, 125, 13940-13941.
- Kulkarni, N.; Muddapur, U., J. Nanotech, 2014, 2014, 1-8.
- Vijayaraj, R.; Kumaran, N.S., Int. J. Pharm. Sci. Res., 2017, 8, 5241-5246.
- Jiang, Z.; Wen, G.; Luo, Y., Scientific Reports, 2014, 4, 1-7.
- Gomathi, M.; Rajkumar, P.V.; Prakasam, A.; Ravichandran, K., Resource-Efficient Technologies. 2017, 3, 280-284.
- Hernández-Gómora A.E.; Larra-Carrillo, E.; Robles-Navarro, J.B., Molecules, 2017, 22, 1407.
- Suica-Bunghez, I.R; Teodorescu, S.; Dulama, I.D., IOP Conf. Series: Materials Science and Engineering, 2016, 133, 012051.
- Awwad, A.M.; Salem, N.M.; Abdeen, A.O., Int. J. Indus. Chem., 2013, 4, 1-6.
- Handoko, C.T.; Huda, A.; Bustan, M.D., Rasayan J. Chem., 2017, 10, 1137-1144.
- Abalaka, M.E.; Akpor, O.B.; Osemwegie, O.O., Adv. Life Sci., 2017, 4, 60-65.
- Kumar, M.; Bansal, K.; Gondil, V.S., J. Molec. Liq., 2018, 249, 1145–1150.
- Patil, M.P.; Kim, G.D., Appl. Microbiol. Biotechnol., 2017, 101, 79-92.
- Feng, Q.L.; Wu, J.; Chen, G.C., J. Biomed. Mater. Res., 2000, 52, 662–668.
- Omojate G.C.; Enwa F.O.; Jewo A.O.; Eze C.O., J. Pharm. Chem. Biol. Sci., 2014, 2, 77-85.
- Donkor, E.; Nortey, T.; Opitan, J., The Internet Journal of Microbiology, 2007, 4, 1-5.
- Dinos, G.P.; Athanassopoulos, C.M.; Missiri, D.A., Antibiotics, 2016, 5, 1-5.

This work is licensed under a Creative Commons Attribution 4.0 International License.
![]()
A New Edition of Web of Science
Journal Impact Factor
2022: 0.5
Five Year: 0.8
Journal is Indexed in

Cabells Whitelist
![]()


