Rapid Identification of Anthocyanin in Ficus Aurata Fruits by Liquid Chromatography-Mass Spectrometry Approach
Daimon Syukri , Ismed, Vioni Derosya, Ririn Fatma Nanda and Dosmawarni Indah Gultom
Faculty of Agricultural Technology, Andalas University, Limau Manis, Padang, West Sumatera, 25163, Indonesia
Corresponding Author E-mail: dsyukri@ae.unand.ac.id
DOI : http://dx.doi.org/10.13005/ojc/350516
Article Received on : 03-09-2019
Article Accepted on : 01-10-2019
Article Published : 15 Oct 2019
The aim of this study was to identify the chemical structure of anthocyanins in the fruits of Ficus Aurata. The anthocyanin was detected and characterized using the liquid chromatography system with UV-VIS detection tandem triple quadrupole mass spectrometer. After UV-VIS detection, the characterization of anthocyanin was subjected to a triple quadrupole system of mass spectrometer. The precursor ions of anthocyanidins (cyanidin, delphinidin, malvidin, pelargonidin, petunidin, and peonidin) were scanned to identify the distinctive particular anthocyanin. Then, the detected anthocyanins was further confirmed and their isomers such as glycosides and galactosides forms were distinguished by the fragmentation pattern on product-ion analysis scan after comparison with mass spectroscopy online databases. For the first time, it had characterized that in the fruits of Ficus Aurata contains at least seven kinds of anthocyanins with all possible combinations of three anthocyanidins.
KEYWORDS:Ficus Aurata; Mass Spectrometry; Structure Conformation; Triple Quadrupole.
Download this article as:| Copy the following to cite this article: Syukri D, Ismed I, Derosya V, Nanda R. F, Gultom D. I. Rapid Identification of Anthocyanin in Ficus Aurata Fruits by Liquid Chromatography-Mass Spectrometry Approach. Orient J Chem 2019;35(5). |
| Copy the following to cite this URL: Syukri D, Ismed I, Derosya I. V, Nanda R. F, Gultom D. I. Rapid Identification of Anthocyanin in Ficus Aurata Fruits by Liquid Chromatography-Mass Spectrometry Approach. Orient J Chem 2019;35(5). Available from: https://bit.ly/2JBv4nw |
Introduction
Anthocyanin is a class of phenolic compounds that cause certain colors (blue, purple and red) in natural products1,2. Since the few last decades, there have been an increasing attention in anthocyanins research due to its benefits on potential health effect on human being other than attractive food colorant. There are many reports indicated the health beneficial effects of anthocyanins such as antioxidative3,4,5, anti-inflammatory and anti-obesity6, DNA cleavage7 and cardiovascular protective properties8.
Many plants are being discovered as the natural source of anthocyanin where each of them is showing the attractive color from their peel such as grape, strawberry, apple, berries and etc9. Meanwhile, there is a fruit which has no specific attractive color, namely Ficus Aurata, yet might has a potential as an anthocyanin source since its seed has a strong specific anthocyanin’s color. Ficus Aurata is a variety of ficus or fig species that is very commonly seen along the roadside in the Andalas University, Indonesia, in which it gives great contribution to the forest ecosystem. When it is ripe, Ficus Aurata can acquire coloring seed hues to dark-violet that might due to the presence of high amount of anthocyanin (Fig.1). We suggest, due to the lack of striking color form the peel of Ficus Aurata, make this fruit has not recognized as a potential source of anthocyanin.
 |
Figure 1: The fruits of Ficus Aurata Click here to view figure |
The objective of this study was to identify the anthocyanin in the fruits of the Ficus Aurata because there is no information available for this till date. Many analytical techniques are applicable for anthocyanins characterization in natural products. However, the most popular techniques is liquid chromatography with multiple UV-VIS detection using photodiode-array detector (LC UV-VIS) combined with mass spectrometry (MS) detection10. Although the utilization of LC UV-VIS especially in the range of wavelength from 500 to 550 nm has already known as general condition for identification of anthocyanin in natural product mixtures, however this kind of method cannot produce very accurate results. This detection only indicate the presence of the red-violet colors as representative of normal anthocyanin without any consideration of various forms of anthocyanins11.
Moreover, since the anthocyanins derivatives have classified as class-targeted metabolite, the use of MS detection with triple quadrupole system permits an ideal platform to produce more accurate analyses of anthocyanin down to low-level and establishment any kind of anthocyanin derivatives structure up to oxidation nor various forms that exhibit no absorbance in the range from 500 to 550 nm through determination of specific molecular mass and subsequent its ion fragmentations12,13..
Experimental Section
Materials
Plant material
The Ficus Aurata was identified at herbarium identification laboratory of Andalas University (Identification Number: 101/K-ID/ANDA/III/2019). The fruits of Ficus Aurata were sampled at the botanical garden of Andalas Univesiry and immediately transported to laboratory for analysis.
Chemicals
Methanol, acetonitrile and water (LC MS grade) were purchased from J.T. Baker (Baker Mallinckrodt, Phillipsburg, NJ, USA). Methanol, acetonitrile, formic acid (LC grade) were purchased from Smart Lab (SMART-LAB, Tangerang, Indonesia). Pro analysis grade hidrochloric acid was also purchased form Smart Lab (SMART-LAB, Tangerang, Indonesia).
The extraction process of anthocyanins
A 100 g of fruits has cut into small pieces and put into 1000 mL erlenmeyer flask then acidified methanol (pH 1.5) was added to the flask. The extraction of anthocyanins were done by maceration technique at room temperature for 12 h in a absence of light. This step was conducted three times. Furthermore, the extract was concentrated using a rotary evaporator. About 5 mL of concentrated extract was then filtered passed through a 0.2 μm millipore filter for subsequent analysis.
HPLC UV-VIS and LC MS/MS analysis
The anthocyanins in the fruits of Ficus Aurata was separated in reverse phase liquid chromatography and subsequent identified and characterized using an photodiode array detector and a MS/MS detector as describes on Syukri et al, 201414 and Syukri et al, 201815 with some modifications, respectively. The utilization of simultaneous detection modes in triple quadrupole ion trap mass spectrometer such as precursor ion scan, multiple and product ion scan were considered and proposed to get a rapid, sensitive and accurate data of anthocyanin qualitatively in this study.
A high performance liguid chromatography (HPLC) series system (Prominence HPLC 20 series Shimadzu, Kyoto, Japan), and a reverse-phase chromatographic column (a Zorbax SB-C18, 150mm×3.0mm i.d., 5 μm in particle size, agilent, Canada, USA) coupled to a DAD detector (Prominence SPD-M20A) were used for HPLC UV-VIS analysis. The mobile phases were (A) 1% of formic acid in water and (B) 50 % of acetonitrile in water containing 1% formic acid. The separation of anthocyanin in the sample was eluted based on the step gradient polarity separation as described in table 1. The detection wavelengths on UV-VIS were in the range of 500 to 550 nm. The extract samples were injected as 5 μL.
Table 1: The step gradient polarity program for HPLC-anthocyanin identification
|
No |
Time (min) | %B | Flow (mL/min) |
|
1 |
0 | 6 | 1.2 |
| 2 | 4 | 10 |
1.2 |
| 3 | 12 | 25 |
1.2 |
|
4 |
13 | 25 | 1.2 |
|
5 |
20 | 40 | 1.2 |
| 6 | 35 | 60 |
1.2 |
| 7 | 40 | 100 |
1.2 |
|
8 |
45 | 6 |
1.2 |
Moreover, for LC MS/MS, the anthocyanins were identified and characterization using a prominence HPLC 20A Shimadzu, Kyoto, Japan that equiped with a reverse-phase chromatographic column (Unison UK-C8, 150mm ×2.0mm i.d., 3 μm in particle size, Imtakt, Kyoto, Japan). The LC was coupled to a triple-quadrupole mass spectrometer (Q-TRAP 4500 AB-Sciex, Framingham, MA, USA). The mobile phases were 0.1% formic acid in water (solvent A) and 0.1% formic acid in acetonitrile (solvent B). The mobile phases were set on anthocyanin separation similar as the LC UV-VIS detection at flow rate as 0.2 mL/min. Anthocyanins were ionized using a Turbo-V™ ion source in positive mode. Precursor ion scan functions in AB-Sciex, QTRAP®, namely, PSI scan followed by enhanced product ion (EPI) scans, were used to study the fragmentation pattern of anthocyanins in the Ficus Aurata extraction solvent that was separated in retention on a chromatographic column. For mass spectroscopy scanning, the MS was operated in positive polarity at a scan rate of 1000 Da/s within the mass range of 200–800 amu. The MS parameters were set as follows: Collision Energy Spread (CES) = 15, Declostiring Potential (DP) = 45, Entrance Potential (EP) = 10, Curtain gas (CUR) = 10 and Temperature (TEM) = 600. The Analyst software version 1.5 was used to integrate and analyze all detection component in this study.
Result and Discussion
Figure 2 shows the UV-VIS chromatogram of the predicted anthocyanin in the methanol extract from the fruits of Ficus Aurata (λ = 500, 520 and 550 nm, respectively). There were two peaks observed at those wavelengths. The highest peak intensity of the peak was observed at a wavelength of 520 nm. Primary anthocyanin was detected at RT 11.8 min while the second ones was detected at RT 10.8 min. Such detection can be used to confirm anthocyanins in plant material samples16.. However, referring to previous studies, most plant material samples should contain more than two anthocyanins 16,17,18,19. Therefore, another analysis such as mass spectrometry needs to be further carried out to obtain more comprehensive data on anthocyanins in the fruits of Ficus Aurata.
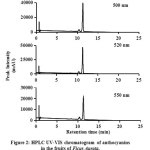 |
Figure 2: HPLC UV-VIS chromatogram of anthocyanins in the fruits of Ficus Aurata. Click here to view figure |
Figure 3 indicates the precursor-ion scan (PIS) chromatogram of anthocyanin in the fruit of Ficus Aurata. The PIS analysis was conducted simultaneously for all precursors of six anthocyanidins (aglycone) i.e. 287 for cyanidin, 303 for delphinidin, 331 for malvidin, 301 for peonidin, 271 for pelargonidin, and 317 for petunidin. It has detected three precursor of anthocyanidins such as cyanidin (287), pelargonidin (271) and delphinidin (303) that formed in seven anthocyanins derivatives. The major and the smallest were identified as a cyanidin anthocyanin while pelargonidin and delphinidin anthocyanin were found in the moderate level. This data can strengthen the previous UV-VIS observation that indicate the presence of two kinds of anthocyanin in the fruits of Ficus Aurata.
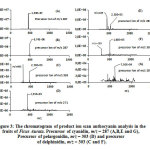 |
Figure 3: The chromatogram of product ion scan anthocyanin analysis in the fruits of Ficus Aurata. Precursor of cyanidin, m/z = 287 (A,B,E and G), Precursor of pelargonidin, m/z = 303 (D) and precursor of delphinidin, m/z = 303 (C and F). Click here to view figure |
Furthermore, the structural confirmation of detected anthocyanin was conducted by the enhanced product ion (EPI) analysis. Figure 4 indicates the EPI chromatogram of each detected anthocyanin in the fruits of Ficus Aurata. Each fragmentation was compared to the mass fragmentation of common anthocyanins from online databases such as METLIN metabolomics databases and LIPIDMAPS. As the results, it can be proposed that the fruits of Ficus Aurata contain cyanidin 3-glycoside and cyanidin 3-(6”-acetylglycoside) as the major anthocyanin. Moreover, delphinidin 3-O-(6”-acetylglycoside), pelargonidin 3-glycoside, delphinidin 3-O-galactoside, cyanidin 3-O-(6-O-malonyl-β-D-glycoside), cyanidin 3-O-sophoroside were identified as minor anthocyanins.
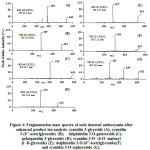 |
Figure 4: Fragmentation mass spectra of each detected anthocyanin after enhanced product ion analysis. Click here to view figure |
Conclusion
The data described here demonstrating the combination of UV-VIS detection, precursor-ion analysis and product-ion analysis tandem mass spectrometer on liquid chromatography instrument for viable technique on the screening of anthocyanins in complex biological matrices rapidly. By employing these techniques, the anthocyanins in the fruits of Ficus Aurata could be identified and confirmed only by an injection into the LC-MS/MS system and without any standard needed. Thus, the efficiency of time analysis in the identification of anthocyanin was the main consideration in this study.
In addition, till date, there is no report indicated the anthocyanin conformation in the fruits of Ficus Aurata, therefore, we describe the anthocyanins in the fruits of Ficus Aurata for the first time. In the fruits of Ficus Aurata, at least, there are seven anthocyanins in all possible combination of three anthocyanidins were identified. This approach allows mass spectrometry to be a rapid identification method with high selectivity and accurate characterization of anthocyanins whereas it could be possibly used as a general screening tool for identifying anthocyanins in plants for practical use.
Acknowledgement
This work was financed by a grant from the Faculty of Agricultural Technology of Andalas University, Indonesia (01K/PL/DF-DIPA/FATETA-2019).
Conflict of Interests
The authors declare that there is no conflict of interests.
References
- Brouillard, R; Anthocyanins as Food Colors Ed Markakis, P.Academic Press, New York, 1982, p.1.
- Anggraini, T; Wilma, S; Syukri, D; Azima, F; International Journal of Food Science.,2019,1-7.
- Yenrina, R; Sayuti, K; Nakano, K; Thammawong, M; Anggraini, T; Fahmy, K; Syukri, D; J. Nutr., 2017, 16 (11), 850-856.
- Yan; X. Zheng; Journal of Functional Foods.,2017, 30, 270–281.
- Andre, C.M; Oufir, M; Guignard, C; Hoffmann, L; Hausman, J.F; Evers D; Larondelle Y; Journal of Agricultural and Food Chemistry., 2007, 55,10839–10849.
- Lee, Y; Yoon, Y; Yoon, H; Park, H; Song, S; Kyung-Jin, Yeum.; Nutrients.,2017, (10): 1089.
- Acquaviva, R;Russo, A; Galvano, F; Galvano, G; Barcellona, M.L; Li Volti ,G; Vanella, A; Cell Biol Toxicol.,2003, 19(4), 243-252.
- Kimble, R;Keane, K.M; Lodge, J.K; Howatson, G;Crit Rev Food Sci Nutr., 2018, 2,1-12.
- Kayesh, E; Shangguan, L; Korir, N.K; Sun, X; Bilkish, N; Zhang, Y; Han, J.,Song, C; Cheng, Z; Fang, J; Acta Physiol Plant.,2013, 35:2879–2890.
- Tian, Q; Giusti, M.M; Stoner, G. D; Schwartz, S.J; Journal of Chromatography A.,2005, 1091, 72–82.
- Strack, D; Wray, V; Methods in Plant Biochemistry, Plant Phenolics, vol. 1 Harborne, J.B, Academic Press, San Diego,1989, p. 327.
- Montoro, P; Tuberoso, C.I.G; Perrone, A; Piacente, P; Cabras, P; Pizza, C; Journal of Chromatography A.,2006, 1112, 232–240.
- Yan,Z; Lin, Ge; Ye, Y; Wang, Ye;Yan, R; J Am Soc Mass Spectrom., 2014, 25(6),955-965.
- Syukri, D; Darwis, D; Santoni, S; J. Chem.,2014, 14 (3), 297-303.
- Syukri, D; Thammawong, M; Naznin, H. A; Kuroki, S; Tsuta, M; Yoshida, M; Nakano, K; Food Chem, 2018, 269, 588-594.
- Solomon, A; Golubowicz, S; Yablowicz, Z; Grossman, S; Bergman, M; Gottlieb, H. E; Altman, A; Kerem, Z; Falishman, M; Agric. Food Chem. 2006, 54, 7717-7723
- Bochi, V. C; Godoy, H. T; Giust, M. M; Food Chem, 2015, 176, 234–243.
- Sun, H; Zhang, P; Zhu, Y; Lou, Q; He, S; Sci Rep,2018, 8, 5018.
- Vagula, J. M; Sinosaki, N. M; Ribeiro, M. A. S; Magon, T; Bertozzi, J; Meurer, E. C; Juniora, O. O. S; Visentainer, J. V; Braz. Chem. Soc., 2018. 29, (1), 38-44.

This work is licensed under a Creative Commons Attribution 4.0 International License.
![]()
A New Edition of Web of Science
Journal Impact Factor
2022: 0.5
Five Year: 0.8
Journal is Indexed in

Cabells Whitelist
![]()


