Quantitative Conductometric Determination of Sitagliptin, Linagliptin, Vildagliptin and Alogliptin by Applying the Concept of Drug-Metal Ion Interaction
Mohammed Al-Bratty1 , Hatim Murayzin1, Adel Almanaa1, Mohammed Qasem Tawhari1,Zia Ur Rehman1,Hassan A. Alhazmi1,2,Sadique Akhtar Javed1 and Md Shamsher Alam1
1Department of Pharmaceutical Chemistry, College of pharmacy, Jazan University, Jazan, P.O. Box 114, 45142, Saudi Arabia
2Substance Abuse Research Centre, Jazan University, P.O. Box 114, 45142, Jazan, Saudi Arabia
Corresponding Author E-mail: haalhazmi@jazanu.edu.sa
DOI : http://dx.doi.org/10.13005/ojc/350518
Article Received on : 02-09-2019
Article Accepted on : 15-10-2019
Article Published : 30 Oct 2019
Cost of analysis and length of analytical procedure are among the most concerning factors in drug analysis. As conductometric analysis has been considered to be relatively inexpensive analytical technique offering fast analysis of drugs, in this study our aim was to develop a rapid and cost-effective method for quantitative determination of sitagliptin, linagliptin, vildagliptin and alogliptin in bulk and dosage forms. The test drugs were allowed to complex with metal ion (Cu2+) in the titration cell, which resulted in the change of conductance of the solution. The corrected conductance was calculated and graph was plotted between corrected conductance and the volume of the analyte solution added. The point of maximum change in the corrected conductance was considered as end point of the titration. The method was found to be linear in the concentration range of 1.0 – 1.4 mM for all analytes with good correlation coefficient (R2 ˃ 0.999). The %RSD of the corrected conductance values were in the range of 0.046-1.837, while the recovery of analytes were within 100 ± 2%, indicating that the method was precise and accurate. The specificity of the method was demonstrated by no interference from blank and placebo. The method was successfully applied for quantitative analysis of all the drugs in the dosage forms. The current method has a major advantage that it provided easy, fast and economical analysis of sitagliptin, linagliptin, vildagliptin and alogliptin in bulk drugs and formulations using conductivity meter.
KEYWORDS:Alogliptin; Conductometric Determination; Drug-Metal Ion Interaction; Linagliptin; Sitagliptin; Vildagliptin
Download this article as:| Copy the following to cite this article: Bratty M. A, Murayzin H, Almanaa A, Tawhari M. Q, Rehman Z. U, Alhazmi H. A, Javed S. A, Alam M S. Quantitative Conductometric Determination of Sitagliptin, Linagliptin, Vildagliptin and Alogliptin by Applying the Concept of Drug-Metal ion Interaction. Orient J Chem 2019;35(5). |
| Copy the following to cite this URL: Bratty M. A, Murayzin H, Almanaa A, Tawhari M. Q, Rehman Z. U, Alhazmi H. A, Javed S. A, Alam M S. Quantitative Conductometric Determination of Sitagliptin, Linagliptin, Vildagliptin and Alogliptin by Applying the Concept of Drug-Metal ion Interaction. Orient J Chem 2019;35(5). Available from: https://bit.ly/345WucW |
Introduction
Sitagliptin, linagliptin, vildagliptin and alogliptin (Fig. 1A, 1B, 1C and 1D) belong to a new class of dipeptidyl peptidase-IV (DPP-IV) inhibitors, which are prescribed to improve glycemic control in adults with type 2 diabetes mellitus1-3. Gliptins are among the most commonly prescribed antidiabetic agents, either alone or in combination with other drugs such as metformin, simvastatin and empagliflozin. Considering high prevalence of type 2 diabetes and gliptins being the first choice for its treatment, it is highly imperative that their usage will further increase. It is well known that a quality control test of the dosage forms is mandatory to evaluate the products with respect to certain regulatory guidelines before their marketing and distribution. Various analytical methods based on UV spectrophotometry, HPLC, capillary zone electrophoresis (CZE), UPLC, LC-MS-MS, and LC-ESI-MS/MS etc. have been developed for the quantitative determination of gliptins in the pure form or in different pharmaceutical formulations4-14. Nevertheless, these analytical methods require expensive equipments, solvent and reagents, in addition to their time-consuming procedures; therefore, sometime these methods are considered to be inappropriate for routine quality control analysis. However, conductometric analysis may prove to be more appropriate than other techniques due to its cost effectiveness, reasonable selectivity and fast response time. In addition, the conductometric methods are applicable to coloured and turbid solutions and provide faster response with comparable and sometime better sensitivity than HPLC methods. Various conductometric methods for quantitative determinations of pure drugs and dosage forms have been reported in the literature. Reports describing precise and accurate analysis of losartan potassium, pantoprazole sodium, sumatriptan succinate, rabeprazole sodium and lomefloxacin hydrochloride (using precipitating agents), diphenhydramine hydrochloride (using silver nitrate) and pioglitazone hydrochloride (by acid-base titrations) in bulk and pharmaceutical dosage forms by conductometric titrations are available15, 16.
 |
Figure 1: Structure of a: sitagliptin; b: linagliptin; c: vildagliptin and d: alogliptin Click here to view figure |
Conductometric titrations can be used for quantitative analysis of ionic solutions, wherein there is a significant change in the conductance values at the end point. In spite of the availability of several analytical methods for the determination of antidiabetic gliptins; to the extent of our apprehension, no method based on conductometric analysis through metal ion interactions is reported so far. Therefore, in the present investigation, the metal interaction capability of the test drugs was exploited to develop new and cost-effective procedure for their quantitative estimation in bulk and pharmaceutical preparations. The current study was also undertaken with the aim to hold a good future for routine analysis of gliptins in poor resource settings. The current study can be used as a reference for the development of conductometric methods for quantitative analysis other drugs in bulk and pharmaceutical dosage forms and can be used as cost-effective procedures for routine determination of pharmaceuticals in quality control laboratories.
Material and Methods
Chemicals, reagents and instruments
In this experiment, all the chemicals used were of analytical reagent grade. Double distilled water used for preparing all the analytical solutions, which was prepared in-house by using Milli Q (Millipore, Molsheim, France) water purifier system. Sodium chloride (NaCl), ferric chloride (FeCl3), ferrous sulphate (FeSO4), copper sulphate (CuSO4), and silver chloride (AgCl) were obtained from Merck, Germany. The authentic sitagliptin, linagliptin, vildagliptin, alogliptin and microcrystalline cellulose were purchased from Sigma Aldrich, Germany. Corn starch, lactose anhydrous and magnesium stearate were purchased from Loba Chemie, India, Germany. Jenway 470 model portable conductivity/TDS meter (Staffordshire, United Kingdom) was used for all the conductance measurements.
Preparation of drug formulations
Separate in-house mixtures of sitagliptin (100 mg), linagliptin (5 mg), vildagliptin (50 mg) and alogliptin (25 mg) were prepared separately by properly weighing and mixing calculated amounts of corn starch, lactose anhydrous, magnesium stearate and microcrystalline cellulose.
Preparation of analytical solutions
Ammonium formate buffer 10 mM; pH 3.5
0.631 g of ammonium formate was dissolved in 1000 mL of double distilled water and pH was adjusted to 3.5 with dilute formic acid solution. The final solution was filtered through 0.22 μm nylon filter.
Drug standard stock and metal ion solutions
Standard drug solution stock of sitagliptin (10 mM) was prepared by accurately weighing 40.7 mg and dissolving in 10 mL of double distilled water whereas, the stock solutions of linagliptin vildagliptin and alogliptin (all 10 mM) were prepared by weighing 47.2 mg, 30.3 mg and 33.9 mg, respectively and dissolving in 10 mL of ammonium formate buffer (10 mM; pH 3.5). Similarly, metal ion solutions using sodium chloride (NaCl) for Na+, ferric chloride (FeCl3) for Fe3+, ferrous sulphate (FeSO4) for Fe2+, copper sulphate (CuSO4) for Cu2+, and silver chloride (AgCl) for Ag+, of same concentration (10 mM) were prepared in double distilled water. Working solutions of desired concentrations for each analyte and metal ion was prepared by diluting their standard stock solutions with the respective diluents. All the final solutions were filtered through 0.22 μm nylon filter.
Solutions of drug formulations
Equivalent amounts of in-house pharmaceutical formulations containing sitagliptin (40.7 mg), linagliptin (47.2 mg), vildagliptin (30.3 mg) and alogliptin (33.9 mg) were accurately weighed in separate flasks and dissolved in 10 mL of water for sitagliptin and ammonium formate buffer (10 mM, pH 3.5) for linagliptin, vildagliptin and alogliptin to achieve stock solutions of 10 mM concentrations. The stock solutions were then diluted in the respective solvents to obtain working solutions of desired concentrations. All the final solutions were filtered through 0.22 µm filter.
Placebo solutions
Placebo solution for each drug formulation was prepared by dissolving equivalent amounts of a synthetic mixture of lactose, starch, microcrystalline cellulose and magnesium stearate in double distilled water (for sitagliptin) and ammonium formate buffer (10 mM, pH 3.5) for linagliptin, vildagliptin and alogliptin. The solutions were diluted to obtain working placebo solutions in the same way used for sample working solution. All the final solutions were filtered through 0.22 μm nylon filter. Double distilled water (for sitagliptin) and ammonium formate buffer (10 mM, pH 3.5) for linagliptin, vildagliptin and alogliptin were considered as blank.
Conductometric titration
A measured amount of metal ion solution (10 mL) was placed in the conductometric titration cell, which was maintained at room temperature (25oC). The conductivity probe was immersed in the metal ion solution and the drug solution was then quantitatively transferred to the titration cell. Conductance was measured following each addition of 10 μL, after stirring for 30 seconds. The corrected conductance values for each dilution was calculated as per the standard reported procedure17, 18. The following equation (1) was used for correction of conductance for each dilution by assuming that conductivity is a linear function of the dilution19.
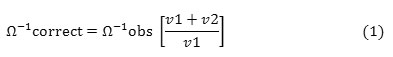
Where, Ω-1correct and Ω-1obs are the corrected and observed electrolytic conductivities respectively, v1 represents the initial volume and v2 is the volume of each titrant solution added. The equivalence point was determined conductometrically by plotting a graph of corrected conductivities against volume of drug solution (titrant) added.
Method Validation
The proposed conductometric method for quantitative analysis of sitagliptin, linagliptin, vildagliptin and alogliptin was validated on the parameters of specificity, linearity, precision, accuracy, solution stability, limit of detection (LOD) and limit of quantification (LOQ) as per ICH and USP guidelines20, 21. Linearity of the proposed method was evaluated using regression analysis and calibration graph were plotted by using respective corrected conductivities of each analyte against their five concentrations (1.0, 1.1, 1.2, 1.3, and 1.4 mM). The conductance was measured in six replicates for each drug concentration. Three quality control solutions at low (LQC, 1.1 mM), medium (MQC, 1.3 mM) and high (HQC, 1.4 mM) concentration levels were prepared and subjected to conductometric analysis to determine the precision and accuracy of the proposed method. The samples were analyzed at different times on the same day, and the same analyses were performed over three successive days for determination of intra-day and inter-day precision and accuracy, respectively. The precision of the method was determined by calculating %RSD of the corrected conductance values, whereas the recovery experiment was performed to evaluate the accuracy. The quality control solutions were analyzed in triplicate. For dosage forms, recovery samples at 80%, 100% and 120 % levels of targeted concentration (1.2 mM) were prepared by standard addition method and analyzed in six replicates. The specificity of the proposed method was determined by examining the conductivities from blank and placebo solutions and making a comparison with those obtained from sample solutions. The stability of test and standard solutions were evaluated after keeping the solutions aside for 7 days at room temperature (25 ºC). After completion of the storage time, the analytical solutions were analyzed by using proposed method. The stability experiment was performed at MQC (1.3 mM) concentration level. The solutions were analyzed in triplicate and the results were compared with those of fresh solutions.
Results and Discussions
Method Optimization
In this study, conductometric titration was performed for quantitative analysis of four antidiabetic drugs sitagliptin, linagliptin, vildagliptin and alogliptin. The ligands present in the drugs molecules were allowed to interact with metal ions, which has resulted in a significant change in the conductance values during the end point. The interaction behavior of metal ions such as Na+, Fe3+, Fe2+, Cu2+, and Ag+ with the test drugs were examined during the conductometric titration. All four selected gliptins were found to form complexes with metal ions such Cu2+ and Fe2+ except linagliptin which also formed complex with Ag+ under the optimized conditions. After several trials, Cu2+ was selected for this investigation since it has displayed significant binding interactions with all the selected gliptins under optimized conditions and best analytical results were obtained when Cu2+ was used as a reagent metal ion.
According to Pearson’s acid base theory, also known as Hard-soft acid base theory (HSAB theory), both metals and non-metals can behave as acids depending on their charge, mass and degree of polarizability. The metals with low polarizability index are termed as hard acids and those with high polarizability index are known as soft acids. Those having an in-between character are classified as borderline acids. In terms of HSAB theory, reactivity of metal ions can be generalized that hard acids prefer to associate with hard bases, and soft acids to soft bases22. The gliptins used for this study contain various ligands such as aminopiperidine, dihydropyrimidine, benzonitrile (in alogliptin), pyrrolidinecarbonitrile (in vildagliptin), triazolopyrazine (in sitagliptin), and aminopiperidine and quinazoline (in linagliptin) which have tendency to form complexes with certain metal cations23-26. The details of selectivity of metal ions (acids) with their corresponding ligands (bases) are illustrated in Fig. 2. Among the metal ions tried in this study, Na+ and Fe3+ are considered as hard acids, Cu2+ and Fe2+ as borderline acids and Ag+ as soft acid.
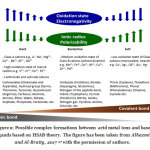 |
Figure 2: Possible complex formations between acid metal ions and base ligands based on HSAB theory. The figure has been taken from Alhazmi and Al-Bratty, 2017 27 with the permission of authors. Click here to view figure |
Several trials were made to select the suitable medium to dissolve the drugs and metal ions during the method optimization process. As water is the best and most economical medium for conductometric determinations, initial experiment was performed using water as medium. However, sharp end-point was only achieved for sitagliptin, which has shown acceptable solubility in water. The rest of the analytes displayed poor solubility in water as well as in buffers with basic pH, leading to undistinguishable end points and unsatisfactory analytical results were obtained. After several trials ammonium formate buffer (10 mM, pH 3.5) was found to be a suitable medium for linagliptin, vildagliptin and alogliptin, as all the drugs exhibited optimum solubility and hence acceptable results. In view, that temperature can affect the conductance of the analytical solutions in conductometric titrations, in this experiment, effect of temperature on the conductance values for all the selected drugs was examined in the respected medium in the range of 25 – 40 ºC. However, no remarkable change in the conductance values of the solutions was noticed, when the temperature of the medium was increased; as a result, room temperature (25 ± 2ºC) was selected for further analysis.
In order to obtain constant and stable conductance and hence sharp end points, several concentrations of analyte drugs and metal ions were studied. Drug and metal ion solutions of concentration range from 0.1 to 10 mM were tested and finally best results were achieved in the range of 1.0 – 1.5 mM concentrations. During the optimization process, it was observed that the concentrations of analyte drugs and metal ions below 0.5 mM were not suitable for conductometric analysis because unstable conductance values were obtained and the inflection at the end point was very poor. In this study, an equal concentration of drugs and metal ions were finalized, which has displayed sharp end point and acceptable results. The methodology involved transferring of respective drug solutions quantitatively with the help of micropipette to the titration cell containing measured amount of metal ion solution which has resulted in alteration in conductance of the solution due to interaction between the analyte drugs and metal ion. The conductance of the solution was measured after each addition of 10 µL of drug solution (titrant). Upon ionisation the gliptins furnish their respective anions (base) that can bind with different metal cations (acids) based on their affinity towards respective metal ions. Corrected conductance was calculated from the observed conductance during the titration process and graph was constructed by plotting corrected conductance against volume of the drug solution (titrant) added. The point of maximum change in corrected conductance value was considered as equivalence point. The drug solutions were showing negligible initial conductance and their addition to the metal ion solution caused a large and continuous increase in molar conductance until the end point (Fig. 3). The solvents used in this study (water and ammonium formate buffer, pH 3.5) were also tested for their conductivities prior to experiments, and found to have no interference in the final readings. A sharp end point in the graphs and good recoveries (98-102%) of the analytes have indicated the aptness of the method for quantitative determination of the selected drugs.
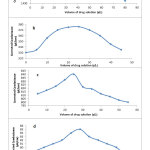 |
Figure 3: Conductometric titration curve of a: sitagliptin; b: linagliptin c: vildagliptin and d: alogliptin with Cu2+ metal ion. Click here to view figure |
Method Validation
The proposed conductometric method was validated as per ICH/USP guidelines. The specificity of the method was established by comparison of the conductometric curve obtained from analysis of blank and placebo solutions by following the same procedure. No sharp change in the conductance values were observed in the titration of blank as well as placebo solutions, suggesting negligible interference from the medium used (water and ammonium formate buffer, pH 3.5) and the ingredients of the placebo. This finding has indicated the developed method was specific.
The linearity of the developed method was evaluated by conductometrically analyzing the solutions of sitagliptin, linagliptin, vildagliptin and alogliptin over the concentration range of 1.0 to 1.4 mM. The calibration graphs were plotted between the corrected conductance and the molar concentrations of the drug analytes. In this study, linear calibration plots were obtained for all the tested drugs and the mean correlation coefficients (R2) for individual analytes was achieved to be >0.999. The results have suggested that the proposed method was linear. Calibration curves for all the tested drugs have been depicted in Fig. 4.
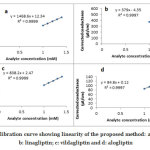 |
Figure 4: Calibration curve showing linearity of the proposed method: a: sitagliptin; b: linagliptin; c: vildagliptin and d: alogliptin Click here to view figure |
The sensitivity of the method was estimated by calculating the limit of detection (LOD) and limit of quantification (LOQ) values. The LOD values for sitagliptin, linagliptin, vildagliptin and alogliptin was found to be 0.0039, 0.0075, 0.0034 and 0.0336 mM, respectively; whereas the LOQ values were 0.0129, 0.0251, 0.0113 and 0.1121 mM, respectively. The lower LOD and LOQ values have suggested good sensitivity of the method. The precision and accuracy (intra-day and inter-day precision) results for selected gliptins in the quality control samples at LQC, MQC and HQC levels are shown in Table 1. The method precision was expressed as % RSD of corrected conductance for triplicate analysis, which were in the acceptable limit for all the test drugs (˂2%). The accuracy of the method, was demonstrated by performing the recovery study at all three concentration levels for all the analytes. The recovery results for all the analytes were within 98.0 – 102.0 % range. The stability of the standard and sample solutions were tested by storing them at room temperature (25±2 ºC) for 7 days. After the specified time the solutions for all the drugs were analyzed and recovery was calculated. The recovery for all the solutions were in the range of 99.86 – 100.97%, showing excellent stability. The recovery results have suggested that all the analytes are stable under normal laboratory conditions and the solutions can be used for 7 days without any degradation of test drugs. The solution stability results have been shown in Table 2.
Table 1: Precision and accuracy results of sitagliptin, linagliptin, vildagliptin and alogliptin determined by the proposed conductometric method
|
|
Concentration levels (mM) | Sitagliptin | Linagliptin | Vildagliptin |
Alogliptin |
|
Intra-day precision and accuracy |
|||||
|
% RSD of corrected conductance values (Average % recovery) |
LQC (1.1 mM) | 0.055 (100.01) | 0.249 (99.95) | 0.177 (100.34) | 1.034 (101.89) |
|
MQC (1.2 mM) |
0.046 (99.81) |
0.226 (100.27) |
0.193 (99.79) |
0.878 (100.12) |
|
| HQC (1.4 mM) | 0.051 (100.05) | 0.169 (99.95) | 0.103 (100.03) |
0.906 (101.82) |
|
|
Inter-day precision and accuracy |
|||||
|
% RSD of corrected conductance values (Average % recovery) |
LQC (1.1 mM) |
0.111 (100.01) | 0.305 (99.39) | 0.113 (100.22) |
1.837 (100.46) |
|
MQC (1.2 mM) |
0.046 (99.81) | 0.230 (100.23) | 0.183 (99.89) |
1.024 (100.61) |
|
|
HQC (1.4 mM) |
0.051 (100.05) | 0.142 (99.61) | 0.400 (100.33) |
0.740 (101.82) |
|
Table 2: Analytical solution stability results of sitagliptin, linagliptin, vildagliptin and alogliptin obtained for proposed conductometric method
|
Analyte |
Storage conditions |
Recoverya (%RSD) |
|
Sitagliptin |
25 ± 2°C; 7 days | 99.86 (0.084) |
| Linagliptin | 25 ± 2°C; 7 days |
100.16 (0.165) |
|
Vildagliptin |
25 ± 2°C; 7 days | 99.87 (0.343) |
| Alogliptin | 25 ± 2°C; 7 days |
100.97 (1.269) |
Application of the method for determination of sitagliptin, linagliptin, vildagliptin and alogliptin in dosage forms
The validated conductometric method was applied to quantitatively analyze sitagliptin, linagliptin, vildagliptin and alogliptin in the dosage forms prepared in-house by adding and mixing measured amounts of lactose, starch, microcrystalline cellulose and magnesium stearate to each drug separately. The individual conductometric titration curve for all the drugs in their respective dosage forms were compared with those recorded for placebo solutions. No, interference from the placebo was observed, as there was no sharp change in conductance values found in the analysis of placebo solution. The applicability of the method was further demonstrated by performing the recovery of analytes at 80, 100 and 120% levels of the targeted concentration (1.2 mM). The recovery was performed by standard addition method and the results were in within 100 ± 2 %. The calculated mean recovery data of sitagliptin, linagliptin, vildagliptin and alogliptin in their formulations are summarized in Table 3. The good recovery of analytes has indicated the aptness of the developed method for quantitative estimation of sitagliptin, linagliptin, vildagliptin and alogliptin in the dosage forms prepared in-house and we hope that the method will also be suitable for quantification of these drugs in their real formulations.
Table 3: Recovery data of sitagliptin, linagliptin, vildagliptin and alogliptin in dosage forms analyzed by proposed conductometric method
|
Analyte |
Recovery sample concentration (mM) | Concentration levels(%) | Drug recovered (mM) |
Recovery±%RSDa
|
|
Sitagliptin |
0.96 |
80 | 0.962 | 99.79 ± 0.63 |
| 1.2 | 100 | 1.198 |
99.84 ± 0.08 |
|
|
1.44 |
120 | 1.438 |
100.14 ± 0.71 |
|
|
Linagliptin |
0.96 |
80 |
0.961 |
99.89 ± 1.10 |
|
1.2 |
100 | 1.202 | 101.16 ± 0.18 | |
| 1.44 | 120 | 1.442 |
99.86 ± 1.10 |
|
|
Vildagliptin |
0.96 |
80 | 0.959 | 100.10 ± 1.11 |
| 1.2 | 100 | 1.197 |
99.79 ± 0.19 |
|
|
1.44 |
120 | 1.441 |
99.93 ± 1.16 |
|
|
Alogliptin |
0.96 |
80 | 0.958 | 100.21 ± 1.18 |
| 1.2 | 100 | 1.213 |
101.10 ± 0.69 |
|
|
1.44 |
120 | 1.443 |
99.79 ± 1.11 |
an = 6
Conclusion
Conductometric method for quantitative determination of sitagliptin, linagliptin, vildagliptin and alogliptin in bulk and dosage forms has been developed and validated as per ICH/USP guidelines. In this study, the complex forming behavior of the test drugs with metal ions was exploited, and the drugs and Cu2+ were allowed to interact in the titration cell leading to change in conductance of the analytical solutions. The point of maximum change in the conductance was considered as equivalence point of the titration. The developed method was found to be linear for all the tested drugs. The method was also found to be specific, precise and accurate. Pharmaceutical formulation prepared in-house was successfully analyzed without any interference from placebo in the detection of end point and with good recovery of analytes (within 100 ± 2%). The major advantages associated with the present method is that it has provided a fast and economical method for analysis of sitagliptin, linagliptin, vildagliptin and alogliptin, in bulk drugs as well as in their formulations, which can be used for routine quality control analysis of these agents.
Declarations
Acknowledgement
This research work was financially supported by Deanship of Scientific Research, Jazan University, Jazan, Saudi Arabia under 6th Future Scientist program.
Conflict of interests
The authors declare that they have no conflict of interests.
References
- Gupta, V.; Kalra, S. Indian J. Endocrinol. Metab. 2011, 15, 298-308.
- Fisman, E. Z.; Tenenbaum, A. Cardiovasc. Diabetol. 2015, 14, 129-141.
- Neumiller, J. J. J. Am. Pharm. Assoc. 2009, Suppl 1: 49, S16-S29.
- Suresh, P. S.; Srinivas, N. R.; Mullangi, R. Biomed. Chromatogr. 2016, 30, 749-771.
- Kumar, N.; Devineni, S. R.; Singh, G.; Kadirappa, A.; Dubey, S. K.; Kumar, P. J. Pharm. Biomed. Anal. 2016, 119, 114-121.
- Scherf-Clavel, M.; Högger, P. J. Chromatogr. B Analyt. Technol. Biomed. Life Sci. 2015, 997, 218-228.
- Barden, A. T.; Piccoli, B. L.; Volpato, N. M.; Schapoval, E. E.; Steppe, M. Pharmazie 2014, 69, 86-91.
- de Andrade, C.; de Araújo Lock, G.; Pigatto, M. C.; Haas, S. E.; Costa, T. D.; de Araújo, B. V. Biomed. Chromatogr. 2014, 28, 1722-1727.
- Rezk, M. R.; Riad, S. M.; Mahmoud, G. Y.; Aleem, A. A. J. AOAC Int. 2013, 96, 301-306.
- Gao, J. W.; Yuan, Y. M.; Lu, Y. S.; Yao, M. C. Biomed. Chromatogr. 2012, 26, 1482-1487.
- Nirogi, R.; Kandikere, V.; Mudigonda, K.; Komarneni, P.; Aleti, R.; Boggavarapu, R. Biomed. Chromatogr. 2008, 22, 214-222.
- Al Bratty, M.; Alhazmi. H. A.; Javed S. A.; Lalitha K. G.; Asmari, M.; Wölker, J.; El Deeb, S. Chromatographia 2017, 86, 891-899.
- Hess. C.; Musshoff. F.; Madea, B. Anal. Bioanal. Chem. 2011, 400, 33–41.
- Martín, J.; Buchberger, W.; Santos, J. L.; Alonso, E.; Aparicio, I. J. Chromatogr. B 2012, 895, 94-101.
- Al-Bratty, M.; Hashem, H.; Noureldeen, A.; Manoharan, G.; Towhar, F. Int. J. Pharm. Sci., 2015; 7, 72-76.
- Al-Bratty, M.; Hashem, H.; Eranhiyil, S. Int. J. Biol. Pharm. Allied Sci. 2016, 5, 93- 103.
- Vogel, A. J. Textbook of quantitative inorganic analysis. Longman, London, 4 th Edition, 1978, 367.
- Lingane, J. J. Electroanalytical Chemistry. 2 nd Edition, Interscience, New York, 1958, 90.
- Ayad, M. A.; Abdellatef, H. E.; Hosny, M. M.; Sharaf, Y. A. Eur. J. Chem. 2012, 3, 332-336.
- International Conference on Harmonization (ICH), Validation of Analytical Procedures: Text and Methodology, Q2 (R1), 2005. Available from: http://www.ich.org/fileadmin/Public_Web_Site/ICH_Products/Guidelines/Quality/Q2_R1/Step4/Q2_R1__Guideline.pdf
- Center for Drug Evaluation and Research, US Food and Drug Administration. Reviewer Guidance, Validation of Chromatographic Methods. FDA, Rockville (MD), 14 November 1994. Available from: https://www.fda.gov/downloads/Drugs/Guidances/UCM134409.pdf.
- Lopachin, R. M.; Gavin, T.; Decaprio, A.; Barber, D. S. Chem. Res. Toxicol. 2012, 25, 239-251.
- Djebbar-Sid, S.; Benali-Baitich, Q. Transition Met. Chem. 1998, 23, 443-447.
- 24. Rahimi-Nasrabadi, M.; Ganjali, M. R.; Gholivand, M. B.; Ahmadi, F.; Norouzi, P.; Salavati-Niasari, M. J. Mol. Structure 2008, 885, 76–81.
- Hasani, M.; Irandoust, M.; Shamsipur, M. Spectrochimica Acta Part A 2006, 63, 377–382.
- Rahimi-Nasrabadi, M.; Ahmadi, F.; Pourmortazavi, S.M.; Ganjali, M.R.; Alizadeh, K. J. Mol. Liq. 2009, 144, 97–101.
- Alhazmi H. A.; Al-Bratty, M. Orient. J. Chem. 2017, 33, 2858-2867.

This work is licensed under a Creative Commons Attribution 4.0 International License.
![]()
A New Edition of Web of Science
Journal Impact Factor
2022: 0.5
Five Year: 0.8
Journal is Indexed in

Cabells Whitelist
![]()


