Evaluation of Wheat Bran as a Biosorbent for Potential Mitigation of Dye Pollution in Industrial Waste Waters
Sujata Das, Shalini Singh
and Shashank Garg
School of Bioengineering and Biosciences, Lovely Professional University, Punjab, India
Corresponding Author E-mail: shalinisingh.iit@gmail.com
DOI : http://dx.doi.org/10.13005/ojc/350514
Article Received on : 11-09-2019
Article Accepted on : 12-10-2019
Article Published : 15 Oct 2019
Crystal Violet (CV) is a basic dye that is extensively used for various industrial uses, ranging from, antimicrobial agent, paints, printing ink, biological stains, to textile dyes. Despite its many uses, it has been associated with environment pollution and toxicity, just like other chemical based industrial dyes, if not kept in check. In the current study, wheat bran (WB), an agro-industrial waste reside, was tested for its adsorptive potential for removal/decrease of CV from industrial waste waters. Under optimized conditions of incubation (pH 8, temperature 30° C, adsorbent concentration 10gm/L, time 180 mins & adsorbate concentration 100mg/L), the adsorbent removed around 88% of CV from its aqueous solution, fitting appropriately adsorption model (Langmuir isotherm) with maximum adsorption capability (qm) value of 25.66 mg/gm, and following pseudo first-order kinetic model. Alkali treatment of adsorbent, though, showed around 4% increase in dye decolorization, but unmodified bran was preferred for further work to justify the need for cheap and environment friendly adsorbent to remediate industrial dye waste waters.
KEYWORDS:Adsorption; Crystal Violet; Isotherm; Wheat Bran
Download this article as:| Copy the following to cite this article: Das S, Singh S, Garg S. Evaluation of Wheat Bran as a Biosorbent for Potential Mitigation of Dye Pollution in Industrial Waste Waters. Orient J Chem 2019;35(5) |
| Copy the following to cite this URL: Das S, Singh S, Garg S. Evaluation of Wheat Bran as a Biosorbent for Potential Mitigation of Dye Pollution in Industrial Waste Waters. Orient J Chem 2019;35(5). Available from: https://bit.ly/2JNJu47 |
Introduction
Dyes are colored compounds, containing a chromophoric (credited for imparting color) and the auxochrome (credited for color intensity) group 1 but chemical based conventional dyes are recalcitrant and long period persistent molecules that pose threat to environmental quality as well as life forms. Hence, efficient removal/neutralization of residual dyes before their release into the environment is of utmost concern for which different methods (physical, chemical and biological) are being evaluated for reducing dye pollution in water bodies.
Various physico-chemical treatment methods, like, electro-coagulation, flotation etc. are been employed but have shown limited success in degradation of water soluble, complex structured reactive textile dyes. Improved methods like, Membrane filtration and Ion exchange (physical), Ozonation, Oxidation and Electrolysis (chemical) and microbiological (biological), alone or in different combinations, are providing some significant solutions to dye removal from wastewater. Still, the need for improved, more cost efficient and environment friendly methods to alleviate dye pollution, is ever increasing as many existing technologies are either too expensive or not-too-effective to treat dye waste. Biosorption using low-cost agriculture-based residues like, wheat bran, rice husk, sugarcane dust, etc., is a cost effective, high performance remediation approach to bioremediation. These lignocellulosic matrices, with a wide variety of functional groups, efficiently bind to dyes through various mechanisms 2. Consequently, the use of such biomaterials, both under modified and unmodified state, appreciably adsorb dyes from solutions. In the present study, wheat bran (WB) was evaluated as an adsorbent for the deduction/removal of crystal violet, a basic color, which finds its application in various industries like, biomedical, printing, textile etc.
Material and Methods
Materials
The chemicals, nutrient media, and reagents used in the current study were of analytical grade and purchased from HiMedia, Bangalore, India and Genei, Delhi, India. Pure Crystal violet (C25N3H30Cl) was procured from Loba Chemi, Mumbai, India.
Preprocessing of adsorbent
Wheat bran (WB) was obtained from local market of Cantonment area, Jalandhar, Punjab, India. The lignocellulosic material, WB was washed with distilled water, to remove of all dirt particles, followed by drying to constant weight at 70° C for 8 hours using a hot air oven. Dried bran was screened through mesh no.30 (0.6 mm) and the sieved portion was transferred in sterile polybags/ziplock bags for further storage at room temperature in a cool and dry place 3 .
Batch Adsorption Studies
Effect of pH on percent dye decolorization by test adsorbent
The adsorption study was carried out in 100ml Erlenemyer flask with 20 ml working volume of 100mg/L of aqueous solution of CV. A weighed amount (200mg), of the biosorbent, at a concentration of 10gm/L, was added to the mixture. The conical flasks were kept under static condition, in the incubator by varying the initial pH (2, 3, 4, 5, 6, 7, 8, 9, 10, 11, 12) of the aqueous dye solution at temperature of 30°C for 180 mins to evaluate the influence of pH on adsorption capacity of wheat bran. The pH was adjusted by 0.1M NaOH and 0.1M HCl and measured by using a pH meter (VLab). After 3 hrs (180 mins), 2ml of samples were dispensed out in microcentrifuge tubes, centrifuged for 15 min at 5000 rpm5. The supernatant was separated from pellet, and then residual concentration of test dye was spectrophotometrically determined in the collected supernatant, at 582nm by using a UV/Vis double beamed spectrophotometer (Shimadzu- 1800) 4. The standard curve for crystal violet was plotted using different concentrations (10-130mg/L) from its 1000mg/L stock solution, at 582nm wavelength. The curve was used to calculate change in dye concentration after the adsorption on adsorbent 5. The amount of dye (mg) adsorbed per unit WB (gm), the adsorption capacity (qe) was determined as per mass balance (state of equilibrium, a condition beyond which no further adsorption can take place on the provided adsorbent) on the dye concentration and percent decolorization or dye removal efficiency were calculated according to the following Equations (1) 6 and (2):
Whereby, C0 = Initial dye concentration and Ce = Final dye concentration, V is the sample volume (L) and W is the adsorbent’s mass (gm)
Influence of Adsorbate concentration and Incubation period on percent dye decolorization
The influence of adsorbate concentration (10, 20, 30, 40, 50, 60, 70, 80, 90, 100, 110, 130 mg/L), adsorbate-adsorbent contact time (30, 60, 90, 120,150, 180, 210, 240 mins) on adsorption equilibrium was investigated at an incubation temperature of 30°C at optimized pH. The residual dye concentration was determined, spectrophotometrically at 582 nm wavelength, as already explained4. The dye adsorbed per unit WB and percent decolorization was calculated by using the above formulae respectively2.
Effect of adsorbent dosage on percent dye decolorization
Variable concentration (2,4,6,8,10,12,14 gm/L) of adsorbent were suspended in optimized aqueous solution of adsorbate, at an optimized pH and incubation time, at 30°C and the remaining concentration of dye was determined spectrophotometrically for the calculation of dye per unit WB and decolorization percent on the basis of the above mentioned formulae2.
Influence of Incubation Temperature on percent dye decolorization
The incubation temperature was varied (25°, 30°, 35°, 40°, 45°, 50°, 55°, 60°, 65°, 70° C) and its effect on equilibrium was evaluated by suspending WB in aqueous solution of CV, maintained at optimum pH for optimized incubation time. The residual dye concentration and percent decolorization were estimated by using above mentioned formulae2.
Effect of Chemical Modification of WB on percent decolorization
25 gm of the bran and 250 mL of 0.4 mol/L Citric Acid were mixed, and the mixture was dried for a duration of 2 hrs at 50° C. The mixture was then centrifuged (4000 rpm), and the leftover solid-phase matter was further dried at 70°C for 6 hrs before it was grounded. Next, the material was esterified in presence of ethanol at 120°C for 3 hrs. Further, the acid-functionalized wheat bran (AMWB) was washed repeatedly using 0.05 M solution of NaHCO3 7, 8 , followed by washing with deionized water before being grounded and finally stored in dark coloured glass containers for further usage.
Similarly, 25 gms of preprocessed bran was mixed with 5% solution of NaOH and sterilized at 121oC & 15 psi for 15 minutes. Further, the bran was filtered to separate it from residual liquid, and then washed thoroughly with distilled water, until the pH of the filtered alkali solution was close to neutral. After drying at 70°C for 6 hrs, the treated WB (ALMWB) was stored in dark colored bottles for its further usage 9.
200 mg of adsorbent, each of acid-modified, alkali-modified and unmodified wheat bran was dispensed in 100 mg/L aqueous solution of test dye, incubated under optimized conditions of incubation time, temperature, pH, adsorbent and adsorbate dosage 3. Subsequently, the remaining dye concentration was found by spectrophotometrically for the determination of dye per unit WB and percent decolorization2.
Adsorption Isotherm studies
Adsorption isotherms were using Langmuir and Freundlich 10 isotherms by establishing a graphically represented relationship between the amount of dye adsorbed by absorbent (10gm/L) and the residual adsorbate concentration in the given test medium at equilibrium, with different initial concentration (60-120mg/L), at 30°C with initial pH of the medium set at 8, for a duration of 180 mins to show the distribution of adsorbate between the liquid phase and the solid phase.
The empirical model of adsorption is either given by Langmuir isotherm model, assuming that the adsorption can occur only at definite sites and at finite number of times. The non-linear expression of the model is 6:
Where, Ce denotes dye concentration (mg/L) in the solution at equilibrium, qe denotes the adsorption capacity (mg/g); qm in mg/g, relates to adsorption capacity as a constant, and kl in L/mg, is a constant in reference to energy of adsorption.
Or given by the Freundlich isotherm modeling system which describes the non-ideal and reversible adsorption, one of the most-earliest relationship known. Based on assumption, it can be applied to multilayer adsorption concerning surface energetic heterogeneity. The non-linear expression of this type of isotherm is given by 11 :
where kf is a constant relating to adsorption capacity and n is a measure of intensity. The values of correlation coefficient, R2, normalized standard deviation have helped in comparison of isotherm equation with equilibrium constant to judge their applicability & sustainability. The non-linear graph was plotted (Microsoft excel) for the determination of isotherm.
Kinetic studies
Under batch kinetic study, the adsorbent-adsorbate was taken at predetermined time periods to measure the concentration of the solutions. The adsorption (qt ) at time, t was determined by, Eq. 3. 12 :
Where, C0 and Ct (mg/L) are concentrations of the adsorbate in liquid phase at the initial and time, t, respectively. V denotes the volume (L) of the solution and W (gm) is the adsorbent mass. By using pseudo-first and second order models the adsorption kinetics in the given case was investigated.
Pseudo First-order kinetic model
The pseudo first order kinetic model is generally expressed 13 :
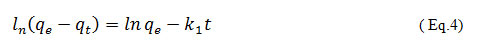
where the amount of adsorbed dye at equilibrium is qe, in mg/g, qt, denotes the solute adsorbed/weight (mg/g) of the wheat bran at time t, k1 depicted as 1/h, is the rate constant of the pseudo first order sorption, a plot of ln ( qe – qt ) vs t gives a straight line with k1 as slope and lnqe as an intercept.
Pseudo second-order model
The kinetic model of pseudo second order can be expressed as 13 :
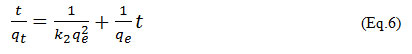
1/qe and 1/h is obtained as the slope & intercept, respectively, of the linear plot of t/qe versus t
Statistical analysis of the data
All the experiments have been conducted in triplicates. The mean values of the observed data have been presented and standard deviation was calculated.
Spectroscopic analysis of active functional groups
The structure and functional group information in reference to untreated, CV adsorbed untreated and chemically modified wheat bran was analyzed by Fourier Transfer Infrared (FTIR) spectroscopy using Model no 8400S Shimadzu, in the range of 4000-500cm-1 using potassium bromide (KBr) disc containing 1% of finely ground treated and untreated wheat bran14.
Result and Discussion
Batch Adsorption Studies
The plot corresponding to the batch adsorption study (Fig. 1) reveals a gradual increase in removal of CV reaching to the maximum of pH 8 contradictory percentage of removal, 87.7%. As pH affects both the degree of ionization of the dye as well as the surface properties of the adsorbent, as hydrogen ions affect the surface charge of the adsorbents and the adsorbate species, the sorption is greatly affected by the variation of solution pH 4 .The point of zero charge (pH pzc) is also an important factor for the determination of the linear range of pH sensitivity indicating the type of surface-active centers and the ability of the surface to adsorb 5. A decrease of 1% was seen at pH 9, in comparison to percent decolorization at pH 8. Similar findings were reported in case of adsorption of CV on pearl millet, where maximum percentage of CV removal was observed at pH 11 5. Another study reveals an increase in adsorptive capacity with increase pH from 3 to 9 15 . In another study, it has been shown that the interaction between Reactive Black 5 and chitosan is also dependent on pH of the solution, which affects surface charge on the sulphonate groups of the Reactive dyes and also that of chitosan which affects the degree of neutralization of amine groups 16 ( Elwakeel, 2009).
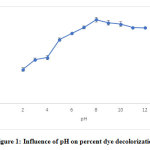 |
Figure 1: Influence of pH on percent dye decolorization Click here to view figure |
The effect of initial adsorbate concentration (Table 1) was determined, where the highest percentage (87.9%) of dye decolorization occurred at 100mg/L adsorbate concentration after an incubation period of 180 mins on 10 g/L concentration of wheat bran at a temperature of 30⁰ C.
Table 1: Influence of initial dye concentration and incubation period on % removal of CV
|
Dye (mg/L) |
Time (mins) | |||||||
| 30 | 60 | 90 | 120 | 150 | 180 | 210 |
240 |
|
|
60 |
55.96±0.7 | 65.56±0.7 | 78.95±0.4 | 85.51±0.6 | 87.12±0.4 | 88.17±0.9 | 88.73±0.3 |
88.64±0.7 |
|
70 |
51.77±0.3 | 58.80±0.2 | 67.78±0.3 | 78.30±0.3 | 85.96±0.5 | 88.08±0.6 | 88.51±0.4 |
88.57±0.6
|
|
80 |
46.05±0.1 | 58.18±0.3 | 66.09±0.9 | 76.41±0.6 | 84.20±0.2 | 88.03±0.4 | 88.05±0.9 |
88.01±0.1
|
|
90 |
43.97±0.1 | 54.78±0.1 | 65.84±0.1 | 74.67±0.1 | 82.80±0.5 | 87.98±0.6 | 87.95±0.7 |
87.92±0.4
|
|
100 |
38.39±0.7 | 49.57±0.1 | 58.87±0.9 | 71.69±0.8 | 81.99±0.2 | 87.93±0.7 | 87.85±0.3 |
87.86±0.1
|
|
110 |
31.00±0.2 | 43.64±0.2 | 50.46±0.9 | 68.24±0.4 | 70.71±0.3 | 77.65±0.2 | 78.30±0.7 |
78.93±0.2
|
|
120 |
24.00±0.3 | 34.00±0.1 | 45.45±0.5 | 49.17±0.2 | 52.76±0.4 | 54.58±0.1 | 56.24±0.2 |
56.19±0.3
|
| Incubation Conditions: pH: 8; Adsorbent dose, gm/L:10; Temperature, ⁰ C: 30 | ||||||||
As indicated in Table 1, percent dye removal was higher under low concentration (30mg/L) of dye, whereas it decreases with increase in concentration of dye with a constant volume of adsorbent (10gm/L). This may be due availability of larger surface area at the beginning for the adsorption 3. With increase in contact time, the percentage removal increase and it remains constant after 180mins, showing reaching of equilibrium for different initial concentrations of CV, with 100mg/L concentration showing 88% dye removal. The adsorption and desorption occur simultaneously for which equilibrium reaches after an appropriate time, which may be attributed by the composition of the wheat bran 17. A concentration of 2gm/L for pearl millet, lead to a decrease in removal of CV from 80% to 71%, dye concentration increased from 15-50 mg/L, with equilibrium within 3 hr 30 mins 5 (Selvapandiyan et al., 2015), as also similar to the current investigation where, 10% decrease in the CV removal percentage with increase in dye concentration from 100 to 110 mg/L. Another study highlights equilibrium of CV adsorption on tamarind seed powder at around 50 mins with 75.4% removal of the dye 18 (Karthik et al., 2019).
The effect of adsorbent dosage (Fig. 2) was investigated at 30⁰C with the initial dye concentration of 100 mg/L. A rapid surge in the dye removal with a rise in the dose of WB might be attributed to surface area availability with increasing concentration of the adsorbent.
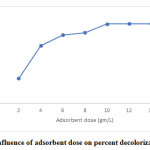 |
Figure 2: Influence of adsorbent dose on percent decolorization of CV Click here to view figure |
As the adsorbent dose increased from 2-4mg/L, an abrupt increase in dye removal was observed from 28-64%, followed by a gradual increase upto of 88% dye removal with adsorbent dose of 10mg/L. Beyond this, no significant change in the adsorption occurred. This might be because of over-crowding by the adsorbent particles which had led to the overlapping of the sites for adsorption 19. Another study has revealed similar type of observations where, CV on Lysiloma latisiliquum seed powder, showed an increase in dye removal from 60-85% with an increasing adsorbent dose (0.5- 2.5gm/L) 18. The findings indicate that percentage of CV adsorption on WB, determined by adsorption capacity, is within a specific range of initial concentration of CV. The graph depicts that the maximum removal of dye was obtained in 10 gm/L dose of adsorbent showing the fluctuation to be a consequence of an increase in the no. of possible active sites and surface region of the adsorbent.
Under specific incubation conditions, temperature was found to influence dye adsorption as well, when 87.9% CV removal by WB was seen at 30°C incubation temperature. Interestingly, the adsorptive ability was more or less similar even at higher temperatures of 35°C (87.12% dye removal) and 40°C (86% dye removal), with a sharp drop beyond 40°C incubation temperature (Fig. 3).
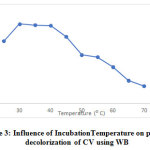 |
Figure 3: Influence of IncubationTemperature on percent decolorization of CV using WB Click here to view figure |
The observation might be due to specific physical forces responsible for decrease in adsorption 4. Adsorption studies of coomassie brilliant blue on wheat bran on the other hand, has shown an increase in the percent dye removal upto an temperature of 60⁰ C beyond which, the absorptive efficiency decreased 17.
Influence of acid and alkali modification of WB was studied to compare the effect of chemical modification of wheat bran with the unmodified sorbent (Fig 4). Under static conditions, at a temperature of 30°C, initial pH of 8 for a period of 180mins, alkali-modified wheat bran (ALMBW) yielded 92% of dye removal in comparison to unmodified WB (88%). In contrast, acid-modified WB (AMBW) (83%) did not perform better than unmodified WB. The carboxyl groups in acid modified WB is believed to be primarily responsible for the adsorption of the basic dyes 20. Inferior performance of acid-modified bran, in comparison to both alkali-modified as well as unmodified bran, is inherently is expected to be contributed to proton, which most importantly influences at low pH, and can consequently compete with cationic dyes for surface sites. Adsorption of methylene blue on papaya seeds showed that the adsorption was minimum at pH 3.0, with increase in dye removal upto a pH of 4.0, after which, it remained constant 21, 2. In another study, adsorption by a chemically synthesized thiourea formaldehyde calcium alginate (TFCA) of Reactive black 5 was executed for checking the efficiency of adsorption and has shown that high adsorption capacity was shown under high acidic pH (pH 1), where the most significant observation was observed after desorption studies, that is, the composite could be reused for adsorption for acidic dyes for several times by subjecting it to regeneration process by sodium hydroxide solution (pH 12) 22. In another similar study with magnetic glycidyl methacrylate conjugated with a ligand diethylene triamine (MGMA-DETA) apart from an efficient removal of the dye AY99 by such chemically synthesized composite, under an optimized condition, the regeneration efficiency for each adsorption/desorption cycle, with 1.0M NaOH, of AY99 dye on the same had shown to be 88.2, 86.1 and 84.5% depicting a good efficiency minimally upto 4 cycles of their usage 23.
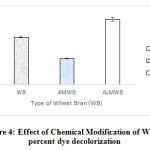 |
Figure 4: Effect of Chemical Modification of WB on percent dye decolorization Click here to view figure |
The adsorption of CV on WB was studied as a function of different concentration (mg/L) of CV, while keeping all other parameters, pH (8) and sorbent concentration (10gm/L) constant and temperature 30⁰ C for a period of 180mins. Fig. 5 reveals the relation between concentrations of the dye at equilibrium (Ce ) and their corresponding adsorption capacity (qe) respectively, showing at 100 mg/L CV, the adsorption capacity of WB has shown an increase till 180 mins after which it remains constant showing that the equilibrium was reached. Such equilibrium study model depicts the dissemination of dye species between the solvent and the substrate based on assumptions related to homogeneity and heterogenous nature of adsorbents 24. Fig.5 depicts Langmuir and Freundlich isotherms for WB. Table 2 shows the corresponding values of the isotherm parameters, their correlation coefficients and related errors for each parameter. R2 value between 0 and 1 indicates favourable adsorption 25. In Fig. 4 and Table 2, high correlation coefficient is deduced by fitting experimental data into Langmuir isotherm model (R² > 0.9566) as in comparison to Freundlich isotherm model. This suggests that Langmuir models fits appropriately with the experimental data. The maximum adsorption capacity, as determined by Langmuir model was 25.66 mg/gm and closely corresponds to the adsorption plateau, indicating that the given model is acceptable for adsorption. Besides, the system is following a monolayer adsorption mechanism.
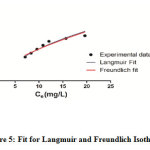 |
Figure 5: Fit for Langmuir and Freundlich Isotherm Click here to view figure |
Table 2: Langmuir and Freundlich isotherm parameters obtained by non-linear fitting for WB, as an adsorbent
|
Model/ Parameters |
Value |
S.E. |
|
|
Langmuir Isotherm Model |
qm (mg/g) |
25.66 |
6.248 |
|
kL |
0.03834 |
0.01287 |
|
|
R² |
0.9566 |
– |
|
|
Freundlich Isotherm Model |
kf |
1.648 | 0.3346 |
| n | 1.578 |
0.2071 |
|
|
R² |
0.9207 |
– |
|
The adsorption kinetic study was important for the optimization dye adsorption conditions using given adsorbent. The two models used for adsorption kinetics of CV on WB were, pseudo first order and pseudo second order. Table 3 gives the calculated values of the constant and kinetic model parameters plotted at 30⁰ C. qe experimented value (93.29mg/gm) with R2 value 0.9578 more matching with pseudo first order kinetic model. Monolayer coverage capacities of WB for Reactive Blue 19, 195 and 145 dyes , in another study, were obtained as 117.6 mg/g, 119.1 mg/g and 196.1 mg/g at a temperature of 60⁰ C, respectively, with a regression coefficient (R2) for pseudo second order kinetic model higher than 0.99 26, in contrast to that of the present study. A study revealed the characteristics of an efficient adsorbent, synthesized from left over sepia shells (SSBC, Sepia Shell Based Composite) having good ability for an efficient removal of both cationic (MB, Methylene Blue) and anionic (RB5, Reactive Black 5) dyes from their aqueous solution. Adsorption, as per Langmuir isotherm model, showed maximum adsorption capability reaching 254.05mg/g and 269.18mg/g for MB and RB5 respectively, with an additional ability of reusability after 4 repeated cycles with an adsorption capacity exceeding 86% 27.
Table 3: Constant values for adsorption kinetics for CV onto WB at a temperature of 30⁰ C
|
Model |
Kinetic Parameters |
100mg/L concentration of CV |
|
Pseudo first order |
qe (mg/gm) | 93.29 |
|
k1 |
0.01318 |
|
| R² |
0.9578 |
|
|
Pseudo second order |
qe (mg/gm) | 39.56 |
|
k2 (/min) |
0.0001751 |
|
| R² |
0.9074 |
Three major changes along with minor ones in the FT-IR spectrum of CV adsorbed WB could be observed by comparing it with that of unadsorbed WB spectrum. Fig.6 and Fig.7 reveal the reduction in amide (-NH) group by the stretching band at 459 cm-1 and 522 cm-1 and stretching of hydroxyl (-OH) group at 3308 cm-1 peak, this broad adsorption corresponds to carboxylic acids, alcohols, phenols as in lignin, pectin, and cellulose, indicating the presence of free OH (hydroxyl) groups on the surface of adsorbent used 28, 29. The changes in the absorption peaks of two spectrum, therefore, clearly indicates the adsorption of CV dye onto the surface of WB. Fig.8 on comparison with Fig 6. shows that there is change in the surface with the presence of ester bonds on acid treatment at 1730 cm⁻¹, depicting the changes on the surface of the WB. Fig. 9 shows also shows changes on the surface of the WB after alkali treatment with medium and strong intensity, 1,3,5 substitutions. However, the regeneration capacity of such materials often poses a serious drawback, which may limit their practical application 2. The adsorption process has thereby been reported as an efficient method for dye removal, ultimately producing treated effluent possessing the possibility of reusage.
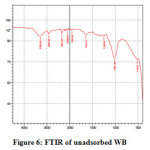 |
Figure 6: FTIR of unadsorbed WB Click here to view figure |
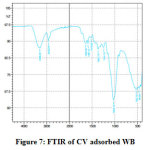 |
Figure 7: FTIR of CV adsorbed WB Click here to view figure |
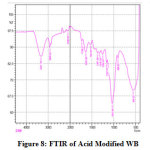 |
Figure 8: FTIR of Acid Modified WB Click here to view figure |
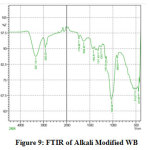 |
Figure 9: FTIR of Alkali Modified WB Click here to view figure |
Conflict of Interests
The authors declare that there is no conflict of interests regarding the publication of this paper.
References
- Bharathi, K.S.; Ramesh, S.P.T.; Fixed-bed column studies on biosorption of crystal violet from aqueous solution by Citrullus lanatus rind and Cyperus rotundus, App. Water Sc. 2013, 3, 673-687.
- Djilali, Y.; Elandaloussi, E.H.; Aziz, A.; Menorval, L.C.; Alkaline treatment of timber sawdust: A straightforward route toward effective low-cost adsorbent for the enhanced removal of basic dyes from the aqueous solution, J. Saudi Chem. Soc. 2012, 241-249.
- Alzaydien, A.S.; Adsorption Behavior of Methyl Orange onto Wheat Bran: Role of Surface and pH, Ori. J. Chem. 2015, 31, 643-651.
- Akazdam, S.; Chafi, M.; Yassine, W.; Gourich, B.; Removal of Acid Orange 7 Dye from Aqueous Solution Using the Exchange Resin Amberlite FPA-98 as an Efficient Adsorbent: Kinetics, Isotherms, and Thermodynamics Study, J. Mat. and Env. Sc. 2017, 8, 2993-3012.
- Selvapandian, P.; Ananthakumar., K.; Cyril, A.; Biosorption of crystal violet from aqueous solution by pearl millet powder: Isotherm modelling and kinetic studies, J. App. Res. Wat.Was.Wat. 2015, 2, 143-149.
- Zhu, B.; Fan, T.; Zhang, D.; Adsorption of Copper ions from aqueous solution by citric acid modified soyabean straw, J. Haz. Mat. 2008, 152, 300-308.
- Hariharan, S.; Nambisan, P.; Optimization of lignin peroxidase, manganese peroxidase, and Lac production from Ganoderma lucidum under solid state fermentation of pineapple leaf. Bio. Res. Tech. 2012, 8, 250-271.
- Feng, Y.; Liu, Y.; Xue, L.; Sun, H.; Guo, Z.; Zhang, Y. and Yang, L.; Carboxylic acid functionalized sesame straw: a sustainable cost-effective bioadsorbent with superior dye adsorption capacity, Bio. Res. Tech. 2017, 238, 675-683.
- Chowdhury, S.; Chakraborty, S.; Saha, P. D.; Response surface optimization of a dynamic dye adsorption process: a case study of crystal violet adsorption onto NaOH-modified rice husk, Env. Sc. Pol. Res. 2013, 20, 1698-1705.
- Bulut, Y.; Gozubenli, N. and Aydin, H.; Equilibrium and kinetics studies for adsorption of direct blue 71 from aqueous solution by wheat shells, J. of Haz. Mat. 2007, 144, 300–306.
- Freundlich, H.M.F.; Over the adsorption in solution, J. Phy. Chem. 1906, 57, 385–471.
- Zhou, Q.; Wang, X.; Liu, J.; Zhang, L.; Phosphorus removal from wastewater using nano-particulates of hydrated ferric oxide doped activated carbon fiber prepared by Sol-Gel method, Chem. Eng. J. 2012, 200, 619–626.
- Ho, Y.S.; Mackay, G.; The sorption of lead (II) ions on peat, W. Res. J. 1998, 33, 578-584.
- Fisal, A.; Wan, D.W.M.A.; Ahmad, M.A.; Radzi, R.; The effects of acid leaching, on porosity and surface functional groups of cocoa (Theobroma cocoa) -shell based activated carbon, Chem. Eng. Res. Des. 2013, 90, 1-11.
- Madhavakrishnan, S.; Manickavasagam, K.; Vasanthakumar, R.; Rasappan, K.; Mohaviraj, R.; Pattabhi, S.; Crystal violet dye from aqueous solution using Rincus communis pericarp carbon as an adsorbent, e-J Chem, 2009, 1109-1116.
- Elwakeel, K.Z., Removal of Reactive Black 5 from the aqueous solution using magnetic chitosan resins, J. Haz. Mat., 2009, 167, 383-392.
- Ata, S.; Din, M.I.; Rasool, A.; Qasim, I.; Mohsin, Ul.; Equilibrium, thermodynamics and kinetics sorption studies for the removal of coomasie brilliant blue on wheat bran as a low-cost adsorbent, J. Ana. Met. Chem., 2012, 1-8.
- Karthik, K.V.S.; Sudhkar, B.; Pranav, P.S.; Sridevi, V.; Removal of crystal violet dye from aqueous solution through biosorption using Lysiloma latisilinquum seed powder: kinetics and isotherm; Int. J. Eng. Res. Tech, 2019, 8, 493-497.
- Namasivayam, C.; Prabha, D.; Kumutha, M.; Removal of direct red and acid brilliant blue by adsorption on to banana pith, Bio Res. Tech. 1998, 64, 77–79.
- Hashemian, S.; Dadfarnia, S.; Nateghi, M.R.; Gafoori, F.; Sorption of acid red 138 from aqueous solutions onto rice bran, Afr. J. Biotech. 2008, 7,600–605.
- Hameeda, B.H.; El-Khaiary, M.I.; Sorption kinetics and isotherm studies of a cationic dye using agricultural waste: broad bean peels, J. Haz. Mat. 2008, 154, 639-648.
- El-Bindary, A.A.; Shoair, A.F.; Kiwaan, H.A.; Hawas, A.R.; Preparation, characterization and application of Synthesized Thiourea formaldehyde-calcium alginate in removing of Reactive Black-5, Can. J. Chem., 2018, 1-51.
- Elwakeel, K.Z.; Ei-Bindary, A.A.; El-Sonabati, A.Z.; Hawas, A.R.; Adsorption of toxic acidic dye from aqueous solution onto diethylenetriamine fuctionalized magnetic glycidyl methacrylate- N, N’ methylenebisacrylamide, Roy. Soc. Chem. Adv., 2019, 1-46
- Kumar, P.S.; Krithika, K.; Equilibrium and kinetic study of adsorption of nickel from aqueous solution onto bael tree leaf powder, J. Eng. Sc. Tech. 2009, 4, 351-363.
- McKay, G.; Blair, H.S.; Gardner, J.R.; Adsorption of dyes on chitin. I. Equilibrium studies, J. App. Pol. Sc. 1982, 27, 3043–3057.
- Cicek, F; Ozer, D.; Ozer, A.; Ozer, A; Low cost removal of reactive dyes using wheat bran, J. Haz. Mat., 2007, 146, 408-416.
- Elgarahy, A.M.; Elwakeel, K.Z.; Elshowbaky, G.A.; Mohammad, S.H.; Untapped Sepia Shell-Based Composite for the sorption of cationic and anionic dyes, Wat. Air Soil Poll. 2019, 217-239.
- Li, F.T.; Yang, H.; Zhao, Y.; Xu, R.; Novel modification of pectin for heavy metal adsorption, Ch. Chem. Let. 2007, 18, 325-328.
- Liang, S.; Guo, X.; Feng, N.; Tian, Q.; Isotherms, kinetics and thermodynamic studies of adsorption of Cu²⁺ from aqueous solution by Mg²⁺/ K⁺ type orange peel adsorbent, J. Haz. Mat. 2010, 174, 756-762.

This work is licensed under a Creative Commons Attribution 4.0 International License.
![]()
A New Edition of Web of Science
Journal Impact Factor
2022: 0.5
Five Year: 0.8
Journal is Indexed in

Cabells Whitelist
![]()


