Chlorinated Phenols Sorption Performance by Macadamia Activated Carbon and Grafted Macadamia Activated Carbon: Characterization, Kinetics, and Thermodynamic studies
Sechaba Machedi1, Ikechukwu P. Ejidike*1,2 , Fanyana M. Mtunzi1,3 Vusumzi E. Pakade1and Michael J. Klink1
1Department of Chemistry, Faculty of Applied and Computer Sciences, Vaal University of Technology, Vanderbijlpark, 1911, South Africa.
2Department of Chemical Sciences, Faculty of Science and Science Education, Anchor University Lagos, Lagos, Nigeria.
3Institute of Chemical and Biotechnology, Vaal University of Technology Southern Gauteng Science and Technology Park, Sebokeng, 1983, South Africa
Corresponding Author E-mail: destinedchild12@gmail.com
DOI : http://dx.doi.org/10.13005/ojc/350501
Article Received on : 10-07-2019
Article Accepted on : 03-09-2019
Article Published : 09 Oct 2019
Our environment is filled with chemicals that pollute the air, water, soil and food, the need to find solutions to the pollution problem. In this study, owing to the research niches like waste beneficiation, macadamia nutshell activated carbon (MAC) was investigated for its potential usage as an adsorbent for chlorinated phenols: 3-chlorophenol, 2,4,6-Trichlorophenol, 4-chloro-3-methylphenol, 2,4-Dichlorophenol removal, and its activity compared with grafted macadamia nutshell activated carbon (GMAC). The adsorbent was characterized using FTIR, SEM, and TGA. Parameters like pH, temperature, contact time, concentration and adsorbent were examined. The PFO and PSO kinetic models were employed to investigate the experimental data. The PSO displayed the best fitting for the kinetic studies for MAC adsorption. The kinetics studies confirmed the adsorption system by pseudo-second-order kinetics model. The negative values of ΔG confirmed a spontaneous process, thereby, supporting the physisorption mechanisms of interactions between the chlorinated phenols and the adsorbents
KEYWORDS:Activated Carbon; Adsorption; Chlorinated Phenols; Macadamia Nutshell; Optimum Conditions; Thermodynamic
Download this article as:| Copy the following to cite this article: Machedi S, Ejidike I. P, Mtunzi F. M, Pakade V. E, Klink M. J.Chlorinated Phenols Sorption Performance by Macadamia Activated Carbon and Grafted Macadamia Activated Carbon: Characterization, Kinetics, and Thermodynamic studies. Orient J Chem 2019;35(5). |
| Copy the following to cite this URL: Machedi S, Ejidike I. P, Mtunzi F. M, Pakade V. E, Klink M. J.Chlorinated Phenols Sorption Performance by Macadamia Activated Carbon and Grafted Macadamia Activated Carbon: Characterization, Kinetics, and Thermodynamic studies. Orient J Chem 2019;35(5). Available from: https://bit.ly/31ZIwYG |
Introduction
Phenols and chlorinated phenol derivatives are injurious constituents present in the water system [1]. These compounds are utilized in several industrial activities for the manufacture of herbicides, pesticides, insecticides, and synthetic products [1,2]. In the paper manufacturing industries, they are also used in the bleaching technique. Phenols containing a certain quantity of wood preservatives and pesticides can lead to precise health indemnities at the lowest concentration levels. However, it is significant to be aware of these phenols and phenol derivatives existing within biological and environmental samples [3]. Phenols are categorized as organic compounds related to alcohol, but they form stronger hydrogen bonds. The hydroxyl group (-OH) attached to a carbon (C) atom forms part of the aromatic ring that characterizes the phenolic compound. The structural formula of phenol: C6H5OH represents only a phenol as the simplest member of the family, and there are phenols with structure C6H4OH-R, where R represents groups like CH3 and NO2.Phenols and its derivatives (phenolic) are considered to be among the most recalcitrant and hazardous contaminants due to their high toxicity for human life, aquatic life and others [4,5].
Activated carbon refers to that kind of carbon treated to possess small and low volume pores with increased surface area present for sorption or interactions [6]. Activation of material that would be satisfactory for application might be attained exclusively from the large surface area; nevertheless, additional chemical handling often improves the sorption characteristics. Activated carbon is typically obtained from charcoal, and occasionally employed as biochar. They are used as a sorbent in water and wastewater treatment for taste- and odor-causing organic compounds removal from drinking water; it has also been used for the removal of organic contaminants [7,8]. Activated carbon removes compounds via sorption both to the surface and within the granules or substrate matrix. The effectiveness of activated carbon is influenced by surface area, porosity, surface pH, and surface charge [9].
The organic compounds in wastewater are problem to the environment and to humans due to phenolic compounds discharged to the aquatic environment, as a result, they bioaccumulate in soils and sediments, thereby, leading to groundwater contamination [10]. High toxicity and persistence of these compounds in the environment have made both the European Union (EU) and United States Environmental Protection Agency (USEPA) to include some of the compounds in the priority pollutant lists [11]. The chlorinated phenols chemicals removals from wastewater are necessary to lower the unsafe outcome on the environment and human health [12]. Chlorinated phenols have been previously listed as some of the highest priority contaminants and as well as mainly important capability carcinogenic toxins released from chemical plants. Their availability in water supplies has been perceived by their bad taste and smell. The acceptable chlorinated phenols concentration in potable water is 1 (mg/l) base on the approval of the world health organization [13].
Therefore, the study reports the adsorption performance of selected chlorinated phenolic compounds from aqueous solution using activated macadamia nutshell charcoal and grafted activated macadamia carbon as a cheaper and effective adsorbent. The sorbent material was prepared and characterized by thermal gravimetric analysis (TGA), scanning electron microscopy (SEM), and Fourier transforms infrared spectroscopy (FTIR) analyses. Parameters like concentration, pH, temperature, contact time, and adsorbent were investigated. Kinetic models such as pseudo-first-order (PFO) and pseudo-second-order (PSO) were utilized in order to evaluate the experimental data followed by kinetics and thermodynamic studies.
Material and Method
All solvents and chemicals were obtained from Sigma-Aldrich, ultra-pure water was used for all dilutions and standard preparations. Commercially available Macadamia nutshell activated carbon (MAC) was obtained from Filtatech, South Africa, and used without further purification. The activated carbon surface area is about 1000 m2/g. The chlorophenols: 2,4,6-Trichlorophenol (2,4,6TCP), 3-chlorophenol (3CP), 2,4-Dichlorophenol (2,4DCP), and 4-chloro-3-methylphenol (4C3MP) were obtained from Sigma-Aldrich (Johannesburg, South Africa). The adsorbate mixtures of various initial concentrations Co ranging from 1ppm -10 ppm were prepared. Accurately weighed chlorinated phenols in gram were added each to a pre-cleaned 1000 mL volumetric flask, dissolved with a small quantity of ultra-pure water, and then made to the mark. The prepared stock solutions were stored in a 5-litre dark brown bottle to avoid photo-oxidation taking place.
Synthesis of Grafted Macadamia Activated Carbon (GMAC)
Grafting of macadamia nutshell activated carbon with the octadecylamine functional group was achieved as follows: 0.09 L of 6N H3PO4 was mixed with 0.81 L water and stirred in a 1 L flask; it was further out gassed for one hour under nitrogen bubbling. Weight 0.5 octadecylamine was then added to the solution with continuous stirring until is a complete solubility. To this as added into MAC (0.5 g) and sodium nitrite (0.01g) quickly and the mixture was further stirred ranging from 1 to 8 h under nitrogen. The unreacted amine was removed from the grafted MAC by washing in cycles using three varied solvents namely: water, acetone, and methanol; each washing cycle was then applied for one day. Finally, the grafted MAC was dried in an oven for 24 h at 105 °C.
Characterization of MAC and GMAC
Thermal gravimetric analysis (TGA) was carried out towards identifying the thermal performance of macadamia nutshell activated carbon and grafted macadamia activated carbon (GMAC). Shimadzu DTG-60H simultaneous DTA-TG apparatus was used for TGA analysis. TGA experiments were performed under a N2 atmosphere with a heating rate of 5 °C min-1 from 0 °C to 900 °C. Fourier Transform Infrared Spectroscopy (Shimadzu Spectrum FT-IR spectrometer, 8300, Japan) was used to detect the surface functional group changes. The spectra were recorded from 4000 to 400 cm-1. Morphology, pore structure, and structural changes information was obtained by a surface morphological analysis in the field by electron Hitachi S-5200 scanning electron microscope (SEM).
Batch adsorption experiments
The effects of different parameters on chlorophenols: 2,4,6-Trichlorophenol (2,4,6TCP), 3-chlorophenol (3CP), 2,4-Dichlorophenol (2,4DCP), and 4-chloro-3-methylphenol (4C3MP) adsorption efficiency by the MAC and GMAC adsorbent were investigated through batch adsorption process at 25 °C.
The tests were carried out using 50.0 ml of chlorinated phenol solutions namely: initial concentration (1, 3, 6, 8, 10 mg/L); different contact times (50, 100, 150, 200, 250 min); adsorbent dosage (0.1, 0.2, 0.3, 0.4, 0.5 g/L), pH values (2, 5, 7, 9,11), and different temperature (20, 25, 30, 35, 40 °C), respectively. Adsorption equilibrium studies was performed using 0.5 mg adsorbent placed in a sequence of 50.0 mL conical flasks, each containing 10.0 mL of unlike initial chlorinated phenol concentrations (1, 3, 6, 8,10 mg/L) at pH 7.0, and the flask shaken in a rotary orbital shaker at 300 rpm for 10 min.
The analysis was performed in replicate (n = 3), the blanks were also performed. The quantity of chlorinated phenol adsorbed per gram of adsorbate (qe), the chlorinated phenol removal percentage (R), and any time (qt) were calculated using Eqs. (1) – (3), respectively:
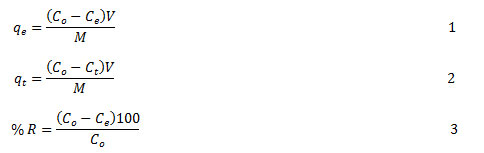
Co = initial concentration of chlorinated phenols (mg/L)
Ce = concentration of chlorinated phenols (mg/L)
Ct = concentration of chlorinated phenols (mg/L)
V = solution volume (L)
M = amount of the adsorbent required (g)
Results and Discussion
Fourier transform infrared spectra of MAC and GMAC
The macadamia activated carbon spectrum was compared to that of the grafted MAC in order to under the differences in the functional/ or reactive groups present at the surfaces to support adsorption activities (Fig. 1). Activated carbon sorption capacity depends on the absorbency in addition to the chemical reactivity of functional/ or reactive groups at the surface [14]. The sorption capacity creates an inequity amongst forces at the surface as related to those inside the sphere, thereby bringing about the molecular sorption by the Van der Waals force. Surface reactive groups’ information gives insight to the adsorption competence of the generated activated carbons. The spectra of MAC (Fig. 1a) showed an alkyl aromatic/ aliphatic activated carbon structure within the regions 3000 – 2800 cm-1 and 900–700 cm-1, an abundant oxygen-containing hydroxyl groups: ν(–OH) around 3700 – 2000 cm-1, ν(–COOH) a shoulder around regions 2600 cm-1 and 1700 cm-1. The bands around 1275 cm-1 are assignable to aliphatic C–O–C, while the band around the region 1050 cm-1 might be accredited to the aliphatic C–H bending. The most intense band at 1600 cm-1 can be ascribed to an aromatic skeletal ring, expressively strengthened by the existence of oxygen-bonded polar substituents [15-17].
The FT-IR spectra of grafted macadamia activated carbon (GMAC) show that the alcohol structure ν(O-H) stretching is sharp and broad around 3385 – 3268 cm-1 and ν(–COOH) stretching at 2628 cm-1. The high-pitched peaks within the regions 2950 – 2850 cm-1 could be ascribed to the stretching alkane ν(C–H) band (Fig. 1b). A bending aromatic compound overtone, with an amine containing functional groups: N-H stretching of secondary amine was observed around 2000 – 1650 cm-1, while the C=N stretching imine group was around 1690 – 1640 cm-1. A strong aliphatic ether stretching C–O showed at 1158 cm-1. Those at 1000 – 754 cm-1 are accredited to the bending aliphatic ν(C–H), while the spectra band around 1649 cm-1 can be credited to aromatic skeletal mode [14,18,19].
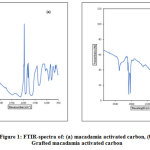 |
Figure 1: FTIR-spectra of: (a) macadamia activated carbon, (b) Grafted macadamia activated carbon Click here to view figure |
Thermal gravimetric analysis (TGA)
TGA/DTA of the MAC and GMAC data were collected under nitrogen atmosphere (atm) with a heating system rate of 5 °C/min starting from 0 °C to 900 °C. The percentage weight loss against temperature of the collected results were plotted in order to have understanding about the nature, characterizations of different fragments or molecules, together with the oxidized carbons found afterward the thermal decomposition [15,17]. Figure 2 shows the outcome of temperature on the residual percent weight of the macadamia nutshell activated carbon (MAC) and Grafted macadamia-nutshell activated carbon (GMAC).The thermogram of macadamia nutshell activated carbon demonstrates that the thermal arrangement of the material showed a perceptible weight loss at about 71 °C in Fig. 2(a) for MAC and 69 °C Fig. 2(b) for GMAC. The mass loss detected preceding 71 °C and 69 °C correlates to the moisture composition of activated material found as 5.39% and 5.29% respectively. After the above temperature, main carbonization reactions started to dominate [17].
The samples exhibited a weight loss at a temperature greater than 150 °C, and this is most likely due to the loss of moisture attributed to the existence of hydroxyl (O-H) sets present on the surface of carbon thereby fascinating water via the hydrogen bonding [20] in macadamia nutshell activated carbon and the grafted MAC starts losing at <100 °C. The drastic decrease in weight loss was observed around 150 – 482 °C and at 102 – 310 °C for MAC and grafted MAC respectively, which are likely associated with a loss of unstable matters for example CO, CO2, aldehydes (RCHO-), SO2,CH4, and refinement of tar [21].
The third weight loss was slowly noticed between 482 – 926 °C and 310 – 929 °C for MAC and GMAC respectively, and this is attributed to the main compound cellulose, hemicelluloses and partial lignin loss from the various materials [17,22]. After that, a slight decrease of weight loss observed until 925.59 °C and 929 °C corresponded to the energy absorption, and mostly associated the phase structure stable when compared to the precursor [23].
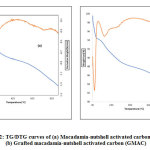 |
Figure 2: TG/DTG curves of (a) Macadamia-nutshell activated carbon (MAC), (b) Grafted macadamia-nutshell activated carbon (GMAC) Click here to view figure |
Scanning electron microscopy (SEM) Analysis
Scanning electron microscopy was utilized towards observing the morphology and structural differences of macadamia nutshell activated carbon (MAC) and the changed produced by phosphoric acid activation in grafted activated (GMAC) as displayed in Fig. 3 a and b. The SEM pictures demonstrate that the textures of the activated carbons displayed asymmetrical small size, circular pores signifying a large surface area together with porous structure [16].
The micrographs of grafted activated carbon sample (GMAC) showed effects due to treatment with phosphoric acid of MAC, which caused visible porosity in the materials (Fig. 3b) and gave an extremely porous surface in the micrograph of this activated carbon. The micrograph of the GMAC exhibited an asymmetrical and heterogeneous texture possessing an eroded texture/ surface. Indisputably, the openings or cracks happened as a result of the thermal degradation with phosphoric acid layer on the surface throughout the activation and carbonization processes leaving behind holes or openings. The permeable surface of the generated activated carbon is crucial for enchanting in adsorbate particles or molecules during the sorption procedures [16,17].
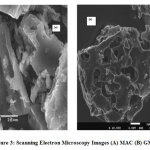 |
Figure 3: Scanning Electron Microscopy Images (A) MAC (B) GMAC Click here to view figure |
Adsorption studies by macadamia nutshell activated carbon
Effect of pH on the adsorption of chlorinated phenols onto MAC and grafted MAC
Numerous studies have reported that the solution pH is an imperative factor in adsorption study [14]. It is noticeable from Fig. 4 that increase in pH increases the sorption of phenol reaching the maximum rate at pH = 7 afterwards, decrease in pH decreases the uptake of phenol. Consequently, the quantity of phenol adsorbed is maximum at pH= 7 seconded by 9, hence, phenol uptake reaches equilibrium at pH = 7 – 9. The degree of ionization of phenol in sorption medium is affected by change in pH. With pKa value of phenol: 9.89, above this pH, phenol could exist as a negatively charged phenolate ion, therefore, the repulsion existing between the anionic phenolate and surface layer leads to decreased molecule sorption. At low pH value, it could be observed that additional protons in the solution, achieved by acid solution results in the competition of the ions for the available carbonyl sites (Fig. 4). Therefore, a decreased adsorption was recorded at a low pH [14,16,17].
With several literatures supporting the adsorption of phenol onto surface materials like activated carbon occur through multi-layered interchange of dispersion and electrostatic interactions. Such usually take place via three probable mechanisms such as π-π dispersion interchange taking place between the delocalized electrons and phenol aromatic sphere present within the structure of the carbon layers, hydrogen bond formation, and electron donor-acceptor compound deposition at the carbon surface [17]. Though in the sorption process, electrostatic interaction existing between the adsorbent surface and phenolate ions (C6H5O−) impacts a very substantial role. Also, surface carbonyl-oxygen group behaves as the electron donor while the electron acceptor is the phenol aromatic ring. These two factors are affected by pH of the solution. This is further supported as proposed that activated carbons handling with mineral acids releases positive ions like hydronium ions such as –OH2+, –COOH2+, and =C–OH+ onto the modified or grafted carbons surfaces that are responsible for sorption spots for electrostatic interchange of anions like phenolate ions (C6H5O−) leading to greater removal [17,24].
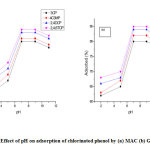 |
Figure 4: Effect of pH on adsorption of chlorinated phenol by (a) MAC (b) GMAC Click here to view figure |
Effect of initial concentration on the adsorption of phenols
To study the outcome of initial concentration of phenol against the activated carbons, tests were carried out in different sample holders with a secure sorbent dose of 0.5 g/L at variable phenol concentrations of 1,3,6,8 and 10 mg/L. The holders were agitated for 250 min at constant pH= 7 in a shaker for all the samples. The adsorption information for the phenol uptake versus various initial concentrations is symbolized in Fig. 5 showing increasing value from 2 ppm up until 6 ppm. It is obvious that 81% removal was recorded with an initial phenol (2,4,6-TCP) concentration of 2 – 6 ppm and the equilibrium reached at 6 – 8 ppm. Nevertheless, using an initial concentration of 6 ppm, around 81% of trichlorophenol elimination was achieved and the equilibrium state approached within 6 – 8 ppm. The results of the initial concentration at 6 ppm have shown that equilibrium was attained at 250 min for all the chlorinated phenol with above 75 % of the entire quantity of phenol uptake occurring in the first 6 ppm, and the adsorption process shows no significant effect after the equilibrium [25]. Higher adsorption rate at the preliminary period (first 60 min) can be attributed to an increased concentration gradient between adsorbate on sorbent surface and adsorbate in solution. As time proceeds, the gradient concentration also reduced, and this can ascribe to the buildup of phenol particles present at the vacant sites bringing about reduction in the adsorption rate at the greater stages in the range 50 to 250 minutes [16,26].
The initial phenol concentration result on grafted MAC as a character of time is displayed in Fig. 5b. At time 250 min, the % adsorbed of the adsorbate increased with initial concentration increase. It provided the necessary driving force required to overcome the resistance associated with the mass distribution of phenol sandwiched between the solid phase and the aqueous phase. With increase in initial concentration, the interaction between phenol and grafted MAC also increases, thereby, promoting the adsorption uptake of phenol [17].
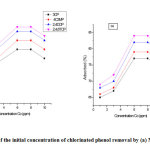 |
Figure 5: Effect of the initial concentration of chlorinated phenol removal by (a) MAC (b) GMAC Click here to view figure |
Adsorbent dose effect on the phenols adsorption onto MAC and grafted MAC
The percentage removal of chlorinated phenol removal by MAC and GMAC with sorbent dose ranged from 0.1 to 0.5 g/L for adsorption is displayed in Fig. 6. The % removal of the phenols increased as the adsorbent dosage increases. The percentage removal of the chlorinated phenol increased from 61.3% to 76.82% for MAC and 64.82%– 83.6% for GMAC as the doses were increased from 0.1 to 0.5 g. The additional sorption sites available with respect to the adsorbent dosage increase could be responsible for the amplified adsorbent surface area. Nevertheless, the phenol quantity adsorbed per unit mass of MAC reaches equilibrium with an adsorbent dosage increase at 0.3 g, since for the same phenol concentration, adsorbent dose increment could account for the large numbers of adsorption sites availability [26]. In conclusion, sorbent mass increment increases the surface area of the materials (MAC and GMAC), thereby increasing the number of available binding sites significant to removal the adsorbate.
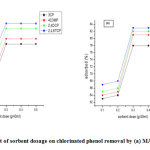 |
Figure 6: Effect of sorbent dosage on chlorinated phenol removal by (a) MAC (b) GMAC Click here to view figure |
Contact time effect for the adsorption of phenols onto MAC and grafted MAC
To explain the contact time effect on the adsorption of phenol (Co= 1 mg/L), the set experiments were performed with a constant dosage of 0.5g/L for all the samples for 50, 100, 150, 200 and 250 min as presented in Fig. 7. The results indicated about 60% of the total quantity of phenol uptake occurred in the first 50 min for MAC, while 70% of the total quantity for the uptake of phenol at the same time occurred with respect to grafted MAC. The advanced sorption rate at the initial period (first 50 min) could be due to availability of large number of unoccupied sites on the adsorbent at the initial stage; consequently, between adsorbate in solution and those on the adsorbent surface, there was increased concentration gradient [26].
As time precedes the concentration gradient was observed to decrease owing to the buildup of phenol constituent part in the unoccupied sites leading to an equilibrium stage in the adsorption rate at the advanced stages from 150 to 250 min. In line with kinetics of removal, the grafted MAC adsorbents transformed by phosphoric acid demonstrated larger percentage removal than MAC. It is predicted that during the modification with mineral acids and heating to an elevated temperature, the acids penetrate MAC pores and seepage via the holes alongside the extractants, thereby leaving behind a harmonized absorbency. The cavities left behind enhances in the adsorbates uptake via physico- and chemico- interactions with the subsequent functional sets [17]
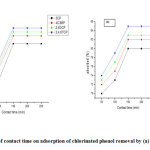 |
Figure 7: Effect of contact time on adsorption of chlorinated phenol removal by (a) MAC (b) GMAC Click here to view figure |
Temperature effect on the chlorinated phenol adsorption onto MAC and grafted MAC
Effect of temperature on adsorption of phenols by the adsorbent was studied by maintaining the sample solutions at a natural pH and 0.5 g/L sorbent dose and then agitated for 250 min at various temperatures 20, 25, 30, 35 and 40 °C respectively. Figure 8 shows the % adsorption by the MAC and grafted MAC samples at variable temperatures with optimal sorption of 75.5% taking place at 30 °C for MAC and 76.2 % at 30 °C for GMAC. It is obvious from Fig. 8 that the value of maximum sorption capacity qe increase with temperature therefore, supporting that phenol adsorption on MAC and grafted MAC is favored at lower temperatures. The plots presented that further increase in temperature instigated an adsorption decrease. This reflection agrees with the principle that an increase in temperature brings about physical adsorption decrease, this can be attributed to the fact that compounds adsorbed initially on the activated carbon surface tend to desorb at elevated temperatures [16].
The energy of adsorbate at high-temperature kinetic does support binding with the functional sites accessible on the activated carbon surfaces. Nevertheless, when the process is endothermic in nature then sorption capacity is likely to increase owing to the intermolecular pore diffusion. The temperature increase effect on the adsorption properties could be attributable to target molecules the tendency to escape from the solid phase back into the bulk phase at an elevated solution temperature [14].
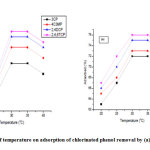 |
Figure 8: Effect of temperature on adsorption of chlorinated phenol removal by (a) MAC (b) GMAC Click here to view figure |
Adsorption kinetics study
In order to investigate the adsorption rate process and the possible rate controlling step, kinetics models were utilized. In this study, batch studies kinetic data were analysed by pseudo-first-order (PFO) and pseudo-second-order (PSO) models for 3-chlorophenol,2,4-dichlorophenol, 2,4,6-trichlorophenol, and 4-chloro-3-methylphenol [17]. The first order equation of Lagergren is mostly articulated as follows Eq. (4).
![]()
Where qe and q are the amounts of phenol adsorbed (mg/g) at equilibrium and at time t (min), respectively, while k1= rate constant of pseudo-first-order (PFO) sorption (min-1). The linearized arrangement of the above equation is given as Eq. (5),
![]()
Expression for the pseudo-second-order kinetic rate equation follows Eq. (6),
![]()
Where k2 = rate constant of pseudo-second-order (PSO) sorption (gmg-1min-1). The linearized arrangement of eq. (6) becomes Eq. (7),
![]()
When the second-order kinetic equation is applicable, the plot of t/q against t gives a linear relationship. The qe and k2 can be obtained from the slope and intercept of the graph (26). The error correlation coefficient (R2) was used to select the best fit model: MAC (R2 = 0.9501–0.9879) and GMAC (R2 = 0.9583–0.9744).The calculated qe, k1, k2, and the consistent linear regression coefficient R2 values are listed in Table 1.
The kinetic model applicability is compared from the correlation coefficient of R2 which is in agreement with the calculated and the experimental qe values. Therefore, pseudo-second-order (PSO) is predominant. Conclusively, for all sorbents fitting in PSO, a chemisorption mechanism is predicted, while physisorption is projected for those following PFO. Similar kinetics results have been conveyed for adsorption dealing adsorption of pollutants onto activated carbon [26, 27]. However, both physisorption and chemisorption have previously been reported by researchers for the pollutants sorption unto adsorbents nevertheless thermodynamics studies are required for further conclusive mechanistic interpretations [27,28].
Table 1: Pseudo first and second order parameters for chlorinated phenol sorption onto MAC and grafted MAC
| Adsorbent Analyte Equation k1 R2 k2 |
| (min-1) (gmg-1min-1) |
| 3CP y=0.0280x+2.786 0.0280 0.9879 2.815 x 10⁻⁴ |
| MAC 4C3MP y=0.0138x+2.124 0.0138 0.9501 8.967 x 10⁻⁵ |
| 2,4DCP y=0.0154x+1.026 0.0154 0.9866 2.312 x 10⁻⁴ |
| 2,4,6TCP y=0.0133x+1.020 0.0133 0.9800 1.734 x10⁻⁴ |
| 3CP y=0.0228x+2.128 0.0228 0.9583 2.443x 10⁻⁴ |
| GMAC 4C3MP y=0.0141x+1.978 0.0141 0.9601 1.005x 10⁻⁴ |
| 2,4DCP y=0.0149x+1.041 0.0149 0.9744 2.133x 10⁻⁴ |
| 2,4,6TCP y=0.0132x+1.018 0.0132 0.9691 1.711 x 10⁻⁴ |
| Chlorophenols: 3CP= 3-chlorophenol, 4C3MP= 4-chloro-3-methylphenol, 2,4DCP= 2,4-Dichlorophenol, 2,4,6TCP= 2,4,6-Trichlorophenol. |
Thermodynamic parameters of adsorption
Calculations from the disparity of the thermodynamic equilibrium constant, Ko with temperature were utilized for the evaluation of thermodynamic parameters like the free energy change (∆G°), entropy change (∆S°), and enthalpy change (∆H°). Other thermodynamic parameters and the values of Ko for the sorption process were designed by means of reported methods [16,27,28]. The values of ∆H, ∆S, and ∆G for the temperature 20, 25, 30, 35 and 40 °C are tabulated in Table 2. The ostensive sorption Gibbs free energy ΔG°, an essential measure for spontaneity, was assessed following the Eq. (8),
![]()
The free energy change temperature dependence is given by the Eq. (9),
![]()
The constant of equilibrium can then be articulated in terms of change of enthalpy of sorption as a temperature function by the Eq. (10),
![]()
When the equilibrium constant increases with temperature, then process is endothermic (ΔH° > 0), and when the equilibrium constant decreases as the temperature is raised, the process is exothermic (ΔH° < 0).
The ΔG° values of −1063.67 to −836.82 J/mol for MAC and −1062.08 to −894.95 J/mol for GMAC were negative signifying that the processes of sorption were spontaneous. The negative values of ∆G designate the spontaneous and feasibility nature of chlorinated phenol on the activated carbon materials. The degree of ∆G, enlarged with temperature increase, signifying that at elevated temperatures, the spontaneity degree also increased. The positive values of ∆S, namely MAC (17.69 J/mol K) and GMAC (0.061 J/mol K) showed an amplified degree of disorderliness at the liquid-solid interface throughout the sorption of phenols onto the adsorbents; suggest that the freedom of the adsorbed phenols was not restricted on the activated carbons [16,25]. The exothermic nature of chlorinated phenols sorption by MAC and GMAC was confirmed by the negative values of ∆H, namely MAC (−0.189 J/mol) and GMAC (−0.031 J/mol). The enthalpy value for the adsorption procedure could be used to differentiate between physical and chemical sorption. Values of enthalpy change ranging from 83 to 830 kJ/mol are used to represent the chemical sorption, while for physical sorption ranges from 8 to 25 kJ/mol. Hence, the low values of ∆H indicate clearly that the communication between chlorinated phenol and macadamia activated carbon is weak and frail.
This is an indication that electrostatic interactions occurred between the chlorinated phenol and the MAC or grafted MAC samples, thereby support physisorption mechanisms [16]. This demonstrates that physisorption mechanisms predominate.
Table 2: Gibbs free energy change parameters of chlorinated phenols onto MAC and grafted MAC adsorption system
| Adsorbent | ∆S° (J/molK) | ∆H° (J/mol) | ∆G° (J/mol) | T(K) |
| MAC | 17.69 | -0.189 | -836.82-801.97-902.96-983.95-1063.67 |
293 298 303 308 313 |
| GMAC | 0.061 | -0.031 | -894.95-803.44-897.95-993.43-1062.08 |
293 298 303 308 313 |
Conclusion
Macadamia activated carbon chemically grafted with the octadecylamine functional group in the presence of phosphoric acid and was assessed for the sorption of chlorinated phenols from aqueous solution. Phenol-MAC system and Phenol-GMAC system adsorption were achieved through the characterized MAC and GMAC with confirmed mesoporous texture and highly carbonaceous nature. Amalgamation of amine clusters was substantiated by an existence of a strong band within the FTIR spectrum around 2000−1650 cm-1, a bending aromatic compound overtone, with functional groups: N-H stretching of a secondary amine and C=N stretching imine (1690−1640 cm-1) in the GMAC. The maximum uptake of phenol onto MAC was observed to be 83 % and for GMAC was 77% at t= 250 min, T= 25 °C, pH= 5, Co= 1 mg/l, and m= 0.3 g/L. Phenol-MAC adsorption system could be defined by the pseudo-second-order kinetics model. The adsorption capacity of phenol unto MAC and GMAC has been observed to decrease with temperature increase signifying an exothermic adsorption process, which was also strengthened by the negative values enthalpy of change. The negative values of Gibbs’ free energy recommended that phenol adsorption onto the materials was a spontaneous process. Overall thermodynamic parameters analysis indicates that electrostatic interactions occurred between the chlorinated phenol and the MAC or grafted MAC samples, thereby support physisorption mechanisms. The obtained results from the study gave an understanding of sorption methods of using waste materials which helps to clean the environment.
Acknowledgment
Directorate of Research, Vaal University of Technology, Vanderbijlpark Campus, South Africa is gratefully acknowledged by the authors towards financial support received for this study.
Conflicts of Interests
The authors declare that they have no conflict of interest.
References
- Pradeep, N. V.; Anupama, S.; Navya, K.; Shalini, H. N.; Idris, M.; Hampannavar, U. S. Appl. Water Sci., 2015, 5(2), 105-112.
- Schubert, J.; Müller, F. D.; Schmidt, R.; Luch, A.; Schulz, T. G. Arch. Toxicol., 2015, 89(11), 2129-2139.
- Igbinosa, E. O.; Odjadjare, E. E.; Chigor, V. N.; Igbinosa, I. H.; Emoghene, A. O.; Ekhaise, F. O.; Igiehon, N. O.; Idemudia, O. G. Sci. World J., 2013, 2013, 1-11.
- Choquette-Labbé, M.; Shewa, W. A.; Lalman, J. A.; Shanmugam, S. R. Water, 2014, 6, 1785-1806.
- Villegas, L. G. C.; Mashhadi, N.; Chen, M.; Mukherjee, D.; Taylor, K. E.; Biswas, N. Curr. Pollution Rep., 2016, 2(3), 157-167.
- Khoshnabadi, R. J.; Lotfi, H.; Vadi, M. Res. J. Pharm. Biol. Chem. Sci., 2015, 6(3), 1469-1475.
- Kim, T.–K.; Kim, T.; Choe, W.–S.; Kim, M.–K.; Jung, Y.–J.; Zoh, K.–D. Environ. Eng. Res., 2018, 23(3), 301-308.
- Krishnaiah, D.; Anisuzzaman, S. M.; Bono, A.; Sarbatly, R. J. King Saud Univ. Sci., 2013, 25(3), 251-255.
- Ekpete, O. A.; Marcus, A. C.; Osi, V. J. Chem., 2017, 2017, 1- 6.
- Fayemiwo, O. M.; Daramola, M. O.; Moothi, K. Water SA, 2017, 43(4), 602-613.
- Bai, X.; Acharya, K. Environ. Pollut., 2017, 247, 534-540.
- Chiong, T.; Lau, S.Y.; Khor, E.H.; Danquah, M. K. OA Biotechnology, 2014, 3(1), 9.
- Kumar, M; Puri, A. Indian J. Occup. Environ. Med., 2012, 16(1), 40-44.
- Phele, M. J.; Ejidike, I. P.; Mtunzi, F. M. J. Pharm. Sci. & Res., 2019, 11(1), 258-262.
- Dikio, C. W.; Ejidike, I. P.; Mtunzi, F. M.; Klink, M. J; Dikio, E. D. Int. J. Pharm. Pharm. Sci., 2017, 9(12), 257-267.
- Ejidike, I.P.; Dikio, C.W.; Wankasi, D.; Dikio, E.D.; Mtunzi, F.M. Int. J. Environ. Stud., 2018, 75(6), 932-949.
- Lesaoana, M.; Mlaba, R. P. V.; Mtunzi, F. M.; Klink, M. J.; Ejidike, P.; Pakade, V. E. S. Afr. J. Chem. Eng., 2019, 28, 8-18.
- Li, K.; Wan, Z. J. Vis. Exp., 2019, 144(e58161), 1-10.
- Ejidike, I. P.; Ajibade, P. A. J. Pharm. Sci. & Res., 2017, 9(5), 593-600.
- Pakade, V. E.; Maremeni, L. C.; Ntuli, T. D.; Tavengwa, N. T. S. Afr. J. Chem., 2016, 69, 180-188.
- Kumar, A.; Jena, H. M. Appl. Surf. Sci., 2015, 356, 753-761.
- Omri, A.; Benzina, M. Alexandria Eng. J., 2012, 51(4), 343-350.
- Rony, A. H.; Kong, L.; Lu, W.; Dejam, M.; Adidharma, H.; Gasem, K. A. M.; Zheng, Y.; Norton, U.; Fan, M. Bioresour. Technol., 2019, 284, 466-473.
- Yahya, M. A.; Al-Qodah, Z.; Ngah, C. W. Z. Renew Sust. Energ. Rev., 2012, 46, 218-235.
- Arshadi, M.; Amiri, M. J.; Mousavi, S. Water Resour. Ind., 2014, 6, 1-17.
- Aljeboree, A. M.; Alshirifi, A. N.; Alkaim, A. F. Arabian J. Chem., 2017, 10, S3381-S3393.
- Doke, K. M.; Khan, E. M. Arabian J. Chem., 2017, 10, S252–S260.
- Maneechakr, P.; Karnjanakom, S. J. Chem. Thermodyn., 2017, 106, 104-112.

This work is licensed under a Creative Commons Attribution 4.0 International License.
![]()
A New Edition of Web of Science
Journal Impact Factor
2022: 0.5
Five Year: 0.8
Journal is Indexed in

Cabells Whitelist
![]()


