Effect of Ultrasonic Pretreatment on Biogas Production from Rice Straw
Saran Pansripong*1, Weerachai Arjharn2, Pansa Liplap2 and Thipsuphin Hinsui3
1School of Environmental Engineering, Institute of Engineering, Suranaree University of Technology, 111 University Avenue, Muang District, Nakhon Ratchasima, 30000, Thailand.
2School of Agricultural Engineering, Institute of Engineering, Suranaree University of Technology, 111 University Avenue, Muang District, Nakhon Ratchasima, 30000, Thailand.
3Center of Excellence in Biomass, Suranaree University of Technology, 111 University Avenue, Muang District, Nakhon Ratchasima, 30000, Thailand.
Corresponding Author E-mail: saranp@g.sut.ac.th
DOI : http://dx.doi.org/10.13005/ojc/350403
Article Received on : 18-07-2019
Article Accepted on : 20-08-2019
Article Published : 19 Aug 2019
The effect of ultrasonic pretreatment on biogas production from rice straw was investigated. Results showed that the application of 37 and 102 kHz resulted in a reduction of hemicellulose about 25.78% and 20.82%, respectively. An increase in the power level and exposition time decreased the hemicellulose content. The biochemical methane potential values at 37 kHz and 102 kHz of the pretreated rice straw for a period of 45 days were 250.36 and 243.79 mL CH4 g VS-1added, which were about 21.95% and 18.75% increase compared to the unpretreated one, respectively. The pretreatment with 37 kHz has provided a better methane yield compared to the one with 102 kHz. Response surface methodology indicated a positive result toward the methane yield and production rate. The utilization of ultrasonic pretreatment toward rice straw for biogas production seems to provide a solution to help solving the problems of both agricultural waste and renewable energy.
KEYWORDS:Biogas; Biochemical Potential Assay; Pretreatment; Rice Straw; Ultrasonic
Download this article as:| Copy the following to cite this article: Pansripong S, Arjharn W, Liplap P, Hinsui T. Effect of Ultrasonic Pretreatment on Biogas Production from Rice Straw. Orient J Chem 2019;35(4). |
| Copy the following to cite this URL: Pansripong S, Arjharn W, Liplap P, Hinsui T. Effect of Ultrasonic Pretreatment on Biogas Production from Rice Straw. Orient J Chem 2019;35(4). Available from: https://bit.ly/2zawrni |
Introduction
A depletion in fossil fuel resources and an increased awareness of their adverse impact on the climate trigger an extensive attention for exploring and enhancing the use of renewable energy sources. Rice straw is one of the major agricultural residues and attractively used as a biomass fuel due to its high energy content, abundance, and low cost.1 Additionally, re-utilization of rice straw rather than being used as the fuel possibly avoids some environmental issues such as air pollution, fire disaster, and degradation of soil fertility.2 One of the potentials of this waste is to be a raw material for producing biogas.
Anaerobic digestion (AD) is a biochemical degradation process widely used for converting organic matter to a mixture of gases, known as biogas. This biogas is regarded as a sort of renewable energy and possibly used for producing heat, electricity, and compress natural gas (CNG).3 However, rice straw has limited itself for a significant biogas production in the AD process due to its intrinsic composition and structure. Rice straw contains high carbon-nitrogen ratio (C/N) leading to have a low nutrient content available for microorganisms. Furthermore, the structure of rice straw is complex and consists of lignin, cellulose, and hemicellulos, which limits a biodegradable activity of enzymes and microorganisms. Consequently, a series of processes of biogas production from hydrolysis to methanization cannot take place efficiently, resulting in a meager energy recovery in terms of methane yield.4,5 A pre-treatment technique should be applied to obtain a high efficacy of biogas production from rice straw.
Various pretreatment methods that have been used in a single or combination include physical techniques (e.g. mechanical and thermal), chemical techniques (e.g. acids, bases, and oxidants), and biological techniques (e.g. fungi and enzymatic hydrolysis).6,7 Some pretreatments are currently impracticable due to the economic aspect and their drawbacks. The chemical pretreatments require a high energy consumption and generate a large amount of wastewater8 while the biological methods are difficult to be controlled with high cost of production.9 The physical pretreatments seem to be more advantageous and feasible due to their convenience in an operation and comparative low investment.
Ultrasonic method is a recent interesting physical pretreatment used to enhance biogas production.10 High frequency of ultrasonic wave allows the cells and regions with liquid vapor to generate microbubbles.11 The explosion of microbubbles causes a disruption of cell membrane and induces cell lysis to release the intracellular material. This pretreatment also disintegrates sludge flocs and breaks large organic particles to smaller ones.12 Consequently, the hydrolysis of sonicated materials is accelerated and subsequently the volatile fatty acids are more readily generated and transformed to methane. Furthermore, the ultrasonic application is more attractive for producing a significant biogas production because of its simplicity, i.e. without adding chemical agents.13 Many studies indicated that the factors affecting the performance of the ultrasonic pretreatment include a raw material related, such as total solid (TS) content, temperature, pH, and particle size, and the operation related, such as exposition time, intensity, frequency, and power input.10 The operational parameters, such as frequency, exposition time and power input, play a very important role in a disintegration of raw materials prior to using for the biogas generation, so the optimization of those parameters would provide a significant influence of the ultrasonic pretreatment. Recently, several studies have reported the potential application of the ultrasonic pretreatment; however, they were mainly focused on a sludge pretreatment and some lignocellulosic biomass.11,13 The ultrasonic pretreatment on rice straw for biogas production is still little reported.
The main objective of this study was to investigate the effects of ultrasonic pretreatment on biogas production from rice straw. The physical and chemical changes of the material before and after being subjected to the pretreatment were investigated. The pretreated samples were also used to study the biochemical methane potential. Additionally, the response surface method was applied to observe the relationship between the ultrasonic parameters and the produce.
Materials and Methods
Rice straw was obtained from a local farmer in Nakhon Ratchasima Province, Thailand. The material was left in the hot sun till the moisture reduced to about 12% w.b., and consecutively milled with 25 mm and 2.5 mm screen size hammer mill machines. The milled produce was kept in a ventilated room. The properties of rice straw are presented in Table 1. Sludge from an anaerobic digestion wastewater plant of the cassava starch factory was collected for the inoculum. The collected sludge was settled down for 24 h, and the supernatant was discarded while the settling material was used as a seed.
Table 1: Characteristics of rice straw
| Analysis | Parameter | Value |
| Proximate | Moisture content (wt%, wb) | 5.91 ± 0.80 |
| Calorific value (MJ kg–1) | 17.84 ± 0.74 | |
| Volatile matter (wt%, db) | 77.09 ± 2.78 | |
| Fixed carbon (wt%, db) | 12.24 ± 0.15 | |
| Ash (wt%, db) | 13.82 ± 0.43 | |
| Ultimate | Carbon (C) | 49.46 ± 0.13 |
| analysis | Hydrogen (H) | 6.24 ± 0.05 |
| (wt%, db) | Nitrogen (N) | 0.50 ± 0.04 |
| Sulfur (S) | 0.17 ± 0.01 | |
| Oxygen (O) | 43.63 ± 0.23 |
Ultrasonic Pretreatment
A 500 ml slurry for 5% TS was prepared by adding distilled water to the prepared rice straw. The slurry was sonicated in a vessel equipped with 8 ultrasonic transducers at the bottom, and the ultrasonic wave was generated by the ultrasonic generator (Model AG1007, T &C Power Conversion, Rochester, NY). The 37 kHz (Transducer HNC-8SH-3840, Hainertec, China) and 102 kHz (Transducer HNC-4SS-38100, Hainertec, China) frequencies were chosen to cover a low frequency range, effectively and efficiently used for pretreatment of biomass materials.11,14 The ultrasonic power level and exposition time were varied to determine the optimal conditions for methane production. After cooling down to room temperature, the pretreated samples were partitioned for the composition and structure change investigation and the biochemical methane potential study.
Biochemical Methane Potential (BMP) Test
The BMP experiment was conducted using a serum bottle technique based on the BMP assay with some modifications.15 Briefly, 20 ml inoculum was mixed with 20 ml substrate in a 100-ml serum bottle with a pH adjustment to about 7. The mixture was then supplemented with the medium containing macro- and micro-elements. The stock nutrient solution (5 times concentrated) makes up of 1.4 g l–1 NH4Cl, 1.25 g l–1 K2HPO4, 0.5 g l–1 MgSO4⸱H2O, 0.05 g l–1 CaCl2⸱H2O, 0.5 g l–1 yeast extract, and 5 ml l–1 trace element solution. The trace element solution consists of 2000 mg l–1 FeCl2⸱4H2O, 50 mg l–1 H3BO3, 50 mg l–1 ZnCl2, 38mg l–1 CuCl2⸱2H2O, 500 mg l–1 MnCl2⸱4H2O, 50 mg l–1 (NH4)6Mo7O24⸱4H2O, 90 mg l–1 AlCl3⸱6H2O, and 2000 mg l–1 CoCl2⸱6H2O.
Each 60 ml working volume serum bottle was flushed with pure N2 for 2 min prior to being sealed, and then placed in an incubator shaker (Wis10RL, Wisd Laboratory Instrument) with the agitation speed of 150 rpm and temperature of 35°C. The accumulating biogas was measured daily via the displacement method. The composition of biogas was determined with the gas chromatography (SHIMADZU GC-14B, Japan) that has a thermal conductivity detector (TCD) and a stainless-steel column (Molecular sieve-5A, mesh 30/60, and 2 m x 3 mm). Temperatures of the injection, column, and TCD detector were 100, 80, and 100°C, respectively, and a carrier gas Helium was introduced at the flow rate of 50 ml/min. The methane production was corrected for the STP condition.16 The experiments with the pre-treated and non-pre-treated mixed-inoculum substrates were carried out for 45 days.
The modified Gompertz equation was employed to determine the cumulative methane production, and its mathematical expression is as follows17:
![]()
where H(t) is the cumulative methane production (ml); e is exp (1); Rm is the maximum specific methane production rates (ml d-1); H is the accumulating methane production potential (ml), and λ is the lag phase time (day).
Analyses
Characteristics of rice straw was determined with the proximate analysis (ASTM D1762-84 and ASTM D2015-77) and the ultimate analysis using a CHNS-932 element analyzer (LECO Corp., St. Joseph, MI, USA). Thermal degradation of the untreated and treated rice straw in an O2 atmosphere was performed with the Thermogravimetric analysis (TGA) using TGA/DSC-1 thermogravimetric analyzer (Mettler-Toledo, Greifensee, Switzerland). On the other hand, thermal stability of the hemicellulose was performed with the TGA and differential scanning calorimetry (DSC) using a simultaneous thermal analyzer (NETZSCH STA 449 F3, Germany). 3.5 mg samples in the alumina pan were heated to 600°C with the rate of 10°C/min and a continuous introduction of 10 ml/min of nitrogen gas.
The SEM investigation was carried out with a field emission scanning electron microscope (FE-SEM) (JEOL JSM-7800F, Japan) coupled with energy dispersive X-ray spectroscopy (EDS) (50 mm2 Silicon Drift Detector (SDD)-X-MaxN, Oxford Instrument, USA). The samples were stuck on the iron slice using a carbon tape for a gold coated process in a JFC-1100E ion sputter (JEOL, Japan). The prepared samples were then directly observed under a low vacuum.
Experimental Design
The ultrasonic powers (100, 160, and 200 W) and treatment durations (10, 20, and 30 min) were applied for investigating the chemical and structural changes, including hemicellulose, cellulose, lignin, AIA, TGA, and FE-SEM. Each treatment was performed in triplicate. Plus, response surface methodology (RSM) with the central composite design (CCD) was used to observe the relationship between the experimental variables (the power level and exposition time) and the BMP parameters (H and Rm). The relationship can be related with the following mathematical model:
![]()
where Y is the response (H and Rm); X1 and X2 represent the ultrasonic power level and exposition time, respectively; a0, a1, a2, a11, a12, and a22 are the coefficients that could be estimated from the least square method. The coded and real values in this experimental design are given in Table 2.
Table 2: Variable and coded unit for faced central composite design.
| Variable | Code | Response | ||
| -1 | 0 | 1 | ||
| Power level (W) | 120 | 160 | 200 | H and Rm |
| Exposition time (min) | 10 | 20 | 30 | |
Results and Discussion
Effect of Ultrasonic Pretreatment Lignocellulose Compositions
Table 3 shows the decomposition of lignocellulose in rice straw before and after the ultrasonic pretreatment with different frequencies, power levels and exposition times. Apparently, the ultrasonic pretreatment significantly influenced on hemicellulose compound, but slightly affected on cellulose and lignin. After the pretreatment, hemicellulose content has decreased from 41.70% to 37.43 – 30.95%, which corresponds to the highest reduction of 25.78% and 20.82% for 37 kHz and 102 kHz, respectively. This obviously indicated that increasing the value of frequency provided less impact on the hemicellulose reduction from the pristine rice straw. Contradictorily, an increase of the power level and exposition time resulted in decreasing the hemicellulose content for each applied frequency. The results are as expected because higher value of the power level and exposition time would enhance the intensity and physical effects in terms of liquid streaming and turbulence, which consequently improve the active cavitation volume.
The hemicellulose with light molecular weight can be more decomposed while one with heavy molecular weight still significantly quantitatively remains when the time of applying an ultrasonic wave is expanded to 25 – 35 minutes. The ultrasonic wave helps to elevate the effectiveness of hemicellulose extraction via a mechanically decomposing process of cell wall and α-benzyl ether bond between lignin and polysaccharide.18 Lower frequency range provides more effective decomposition than higher frequency range in any circumstances because the lower one emits higher cavitation energy that enables to break down hemicellulose better.19,20
The proportion of acid insoluble ash or AIA increased from 1.97% to approximate 2.09 – 4.41% (Table 3). This may be due to rising of the molecular weight and the distribution of lignocellulosic material because the bonds in lignin are decomposed and the distracts from cellulose into smaller particles affect the structure of lignin to be more fragile.21
Table 3: Compositions of lignocellulose in rice straw with the ultrasonic pretreatment at 37 kHz and 102 kHz.
| Freq. (Hz) | Power (W) | Time (min) | % Dry matter | |||
| Hemicellulose | Cellulose | Lignin | AIA | |||
| Untreated | – | – | 41.70 | 37.52 | 3.09 | 1.97 |
| 37 | 120 | 10 | 34.04 | 36.63 | 3.68 | 2.50 |
| 20 | 33.89 | 35.55 | 3.02 | 2.43 | ||
| 30 | 33.51 | 36.76 | 2.91 | 2.65 | ||
| 160 | 10 | 33.46 | 36.09 | 3.45 | 2.43 | |
| 20 | 33.08 | 36.63 | 3.50 | 3.09 | ||
| 30 | 33.99 | 36.02 | 3.56 | 3.56 | ||
| 200 | 10 | 32.63 | 37.34 | 3.35 | 3.01 | |
| 20 | 32.70 | 37.59 | 3.78 | 3.77 | ||
| 30 | 30.95 | 37.64 | 4.01 | 4.41 | ||
| 102 | 120 | 10 | 37.23 | 35.01 | 2.32 | 2.55 |
| 20 | 36.58 | 35.99 | 2.67 | 2.64 | ||
| 30 | 34.62 | 35.02 | 3.33 | 2.36 | ||
| 160 | 10 | 33.04 | 36.82 | 3.09 | 2.09 | |
| 20 | 33.24 | 36.80 | 3.14 | 3.94 | ||
| 30 | 33.73 | 37.95 | 3.27 | 3.26 | ||
| 200 | 10 | 34.88 | 35.64 | 3.07 | 2.41 | |
| 20 | 34.21 | 36.03 | 3.89 | 2.54 | ||
| 30 | 33.02 | 36.28 | 3.54 | 2.93 | ||
Thermal Stability
The measurement of thermal stability of lignocellulosic material is observed by determining the change of weight at a certain thermal interval and time session. As previously mentioned, the ultrasonic pretreatment can cause the compositions of lignocellulose to alter, including a decomposition of cell wall.22 Moreover, the ability to bind the bonds of the compositions is more stable, compared to the material without the pretreatment. 23
Figure 1 shows that the combustion process of this material can create exothermic zones. The first zone occurring at 250 – 380°C was caused by an evaporation of the volatile organic compound with light molecules, and the second zone at 380 – 525°C could occur from combusting the carbon compound consisting in the material.24 The initial temperatures with the highest decomposition rate were at 249 and 255°C for the 37 and 102 kHz ultrasonic wave, respectively. These values are higher than 243°C of the controller set. The ultrasonic pretreatment causes the light-molecule hemicellulose to decompose out first and makes the rice straw have only the heavy-molecule compositions that are resistible to decomposing with heat.23 It is also found that the cause of increasing the decomposing temperature is from the higher proportion of ash.24
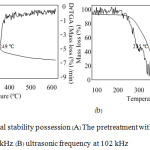 |
Figure 1:Thermal stability possession (A) The pretreatment with the ultrasonic frequency at 37 kHz. (B) ultrasonic frequency at 102 kHz. |
Physical Structure
The physical morphology structure of untreated and pretreated rice straws obtained from the FE-SEM analysis is presented in Figure 2. The untreated rice straw exhibits a relatively smooth and compact surface, indicating a rigid cell wall most probably due to its intricate structure (Figure 2a). The toughness of cell wall is from the binding of lignocellulose polymers and depends on the proportion of its constituents, such as hemicellulose, cellulose, and lignin.25 Noticeably, such a kind of structure makes it difficult for the biological decomposition, resulting in a low productivity. After the ultrasonic pretreatment, the surface structure has changed to have a relatively roughness with voids and cracks (Figure 2b and 2c). The ultrasonic application could provide the amplitude of shock waves that can cause the particle size reduction as well as a degradation of large molecules in the medium.26 Plus, the cavitation effect may also be responsible for the physical structure change of the pretreated rice straw.27
The ultrasonic pretreatment can also decompose the cell wall, as well as the hemicellulose. This could cause the lignocellulose material to have more exposed surface areas and pore volume.28 Moreover, some of the covering materials on the surface of the untreated rice straw are fallen out, which creates a high possibility for decomposing by an enzyme activity and consequently increases the biological decomposition rate. The present of disrupted and microfibrils are clearly visible for the 102 kHz frequency (Figure 2c). It is suggested that decomposing the hemicellulose from microfibrils can be easily done.23 These results showed that the ultrasonic pretreatment could change the physical structure of rice straw to be more appropriate for easily accessing the cellulose, which is expected to improve the produce.
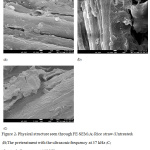 |
Figure 2: Physical structure seen through FE–SEM (A) Rice straw (Untreated) (B) The pretreatment with the ultrasonic frequency at 37 kHz (C) ultrasonic frequency at 102 kHz. |
The Potential Production of Methane Gas
Table 4 and 5 present the methane yield (H) and maximum specific methane production rate (Rm) from the BMP test at the 37 kHz and 102 kHz, respectively. In case of the application with 37 kHz, with a variation of the applied power levels, the cumulative methane gas production has improved from 225.23 to 250.36 mL CH4 g VS–1added. The cumulative methane gas for the 120, 160, and 200 W with the 30 min treatment were found to be 231.05, 244.41, and 250.36 mL CH4 g VS–1added, respectively. Moreover, the Rm was in the range of 21.08 – 27.67 mL CH4 g VS–1added. In case of the pretreatment with 102 kHz, the lowest cumulative methane gas (209.28 mL CH4 g VS–1added) was obtained at the shortest time (10min) of 120 W whereas the highest one (243.79 mL CH4 g VS–1added) was found at the longest time (30 min) of 200 W. The values of Rm were varied from 21.95 to 29.25 mL CH4 g VS–1added. For all cases, the yielded methane gas has accumulated rapidly for the first 10 days and then gradually continuously increased till stabilizing on the day of 45 (Figure 3). Kaparaju and Felby (2010)21 suggested that the primary decomposition enables an enzyme of microorganism to decompose the substrate more easily. Plus, it allows the carboxyl group of the hemicellulose decomposed more, resulting in higher exposed surface area.29 The remaining cellulose and lignin are the compounds that are not able to decompose easily, resulting in having either low or none productivity.
Table 4: Methane yield (H) and maximum specific methane production rate (Rm) from biochemical methane potential (BMP) method of ultrasonic pretreated rice straw at 37 kHz.
| Power (W) | Time (min) | H (mL CH4 g VS–1added) | Rm (mL CH4 g VS–1added) | λ (hrs) | Cum. Methane yeild (mL CH4 g VS–1added) |
| 120 | 10 | 211.95 | 20.62 | 0.01 | 225.23 |
| 20 | 214.87 | 20.89 | 0.36 | 230.63 | |
| 30 | 213.61 | 21.08 | 0.38 | 231.05 | |
| 160 | 10 | 214.50 | 22.07 | 0.20 | 231.51 |
| 201) | 229.97 | 24.10 | 0.13 | 241.40 | |
| 30 | 227.98 | 24.68 | 0.47 | 244.41 | |
| 200 | 10 | 228.40 | 22.59 | 0.10 | 240.36 |
| 20 | 228.28 | 24.96 | 0.04 | 247.68 | |
| 30 | 232.82 | 27.67 | 0.37 | 250.36 |
Means of treatment (n=3) by RSM.
Every treatment deducted from controller (The gas caused by seed).
The amount of methane at STP.
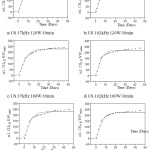 |
Figure 3: A model of accumulating methane gas from the pretreatment with the ultrasonic. |
Apparently, the performance of the pretreatment with 37 kHz is better than that of the pretreatment with 102 kHz in terms of methane yield (Figure 4). For the pretreatment with 102 kHz, the methane gas production diminishes between 1.15 to 7.63 percent compared to the results of the 37 kHz frequency. It is consistent with the results obtained from the composition changes after the pretreatment. As early mentioned, the more effective improvement on the amount of hemicellulose, which is an easily decomposed compound in AD process, was found with the ultrasonic pretreatment with 37 kHz. In comparison to other methods, ultrasonic pretreatment gave methane yield a little lower than chemical treatments but slightly better than some other physical treatments.11
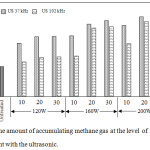 |
Figure 4: The amount of accumulating methane gas at the level of pretreatment with the ultrasonic. |
A Proper Model of Response Surface Method
In this study, the second-order polynomial model was applied for correlating two main ultrasonic variables (power level and exposition time) with two responses (methane yield, H and maximum specific methane production rate, Rm), and its good fit was evaluated by the values of coefficient of determination (R2). The obtained values of R2 for all cases in the study were found to be in the range of 0.95-0.98 and 0.91-0.94 for H and Rm, respectively (Table 5). It was suggested that a model with a goodness-of fit should have R2 at least greater than 80%.30 The R2 are higher than 90% and close enough to the adjusted coefficient of determination (Adj. R2), indicating that the fitting model could satisfactorily explain the experimental data.31 Furthermore, the p-values of the linear regression of the actual and predicted data were all less than 0.05, implying a statistical significance and indicating a good agreement between the experimental and predicted values of the response (Figure 5). Thus, it further confirms the suitability of the models fitted.
Table 5: Methane yield (H) and maximum specific methane production rate (Rm) from biochemical methane potential (BMP) method of ultrasonic pretreated rice straw at 102 kHz.
| Power (W) | Time (min) | H (mL CH4 g VS–1added) | Rm (mL CH4 g VS–1added) | λ (hrs) | Cum. Methane yeild (mL CH4 g VS–1added) |
| 120 | 10 | 202.02 | 21.95 | 0.15 | 209.28 |
| 20 | 202.42 | 22.83 | 0.16 | 213.04 | |
| 30 | 203.09 | 22.91 | 0.17 | 213.58 | |
| 160 | 10 | 199.81 | 23.09 | 0.26 | 214.24 |
| 201) | 225.66 | 25.18 | 0.17 | 238.04 | |
| 30 | 219.46 | 27.10 | 0.18 | 239.20 | |
| 200 | 10 | 215.27 | 23.39 | 0.39 | 224.86 |
| 20 | 226.21 | 27.69 | 0.12 | 243.56 | |
| 30 | 233.53 | 29.25 | 0.08 | 243.79 |
Means of treatment (n=3) by RSM.
Every treatment deducted from controller (The gas caused by seed).
The amount of methane at STP.
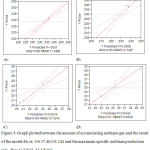 |
Figure 5: Graph plotted between the amount of accumulating methane gas and the result of the model (H) (A) US37 (B) US102 and the maximum specific methane production rate (Rm) (C) US37 (D) US102. |
The calculated model coefficients for linear, square and interaction effects are presented in Table 6. Positive coefficients indicate that such variables have a positive effect while the factors with a negative coefficient negatively influence on the studied responses.32 Apparently, the square terms of both power level and exposition time provided a negative effect on both H and Rm, whereas either individual or interactive increase of power level and exposition time provided a positive result for H and Rm. The relationship between the variables and responses can be visualized in the 3D-response surface plots (Figure 6). For both 37 kHz and 102 kHz cases, the lowest values of H and Rm were observed to be at the intersection of lower constraints set for the studied variables. An increase of the interaction between the power level and exposition time provided more favorable results for both H and Rm. Nevertheless, the H values were optimal at approximately 200 W and 30 min for both 37 kHz and 102 kHz.
Table 6: Coefficient of response surface model of Methane yield (H) and maximum specific methane-producing rate (Rm).
| Constant variable | (H) | (Rm) | |||
| US37 | US102 | US37 | US102 | ||
| Intercept | 241.23 | 237.05 | 23.97 | 25.32 | |
| Power (120,200) | 8.58 | 12.72 | 2.11 | 2.11 | |
| Time (10,30) | 4.79 | 8.03 | 1.36 | 1.81 | |
| Power*Power | -1.73 | -6.79 | -0.78 | -0.32 | |
| Power*Time | 1.05 | 3.66 | 1.16 | 1.23 | |
| Time*Time | -2.92 | -8.37 | -0.33 | -0.49 | |
| Statistics | R2 / Adj. R2 | 0.98 / 0.96 | 0.95 / 0.90 | 0.94 / 0.88 | 0.91 / 0.88 |
| RMSE | 1.44 | 4.14 | 0.72 | 0.93 | |
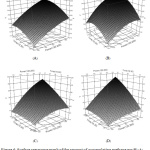 |
Figure 6: Surface rresponse graph of the amount of accumulating methane gas (H) (A) US37 (B) US102 and the maximum specific methane production rate (Rm) (C) US37 (D) US102. |
Conclusion
Rice straw, a residue from an agricultural product, can be used as a raw material in the ultrasonic pretreatment for biogas production. The physical and composition of rice straw has changed after the pretreatment. At the different values of applied frequencies, two main parameters, namely the power level and exposition time, mainly influenced on the pretreatment. Higher power level and longer exposition time have helped to improve the reduction of hemicellulose content while higher frequency provided an opposite effect on the hemicellulose reduction. The pretreated rice straw provided a better biogas product yield compared to the unpretreated one. Higher methane yield was obtained from the application of 37 kHz. In terms of methane yield and maximum specific methane production rate, around 90% of the experimental data could be explained by the mathematical model of the applied RSM with CCD, and those data well agreed to the predicted data. Interaction effect between the power level and exposition time was the most influent factor for H and Rm. The ultrasonic pretreatment toward rice straw could be considered as a safe, environmentally friendly and less energy intensive approach compared to other pretreatment methods. Plus, it could help to overcome the limitation of the pristine rice straw to be used for improving biogas production.
Acknowledgements
The authors would like to acknowledge the financial support given by Office of Research and Project Coordination, Office of the National Research Council of Thailand, Energy Policy and Planning Office, Ministry of Energy, Thailand, and Institute of Research and Development, Suranaree University of Technology, Thailand.
Conflict of Interest
The authors confirm that there are no known conflicts of interest associated with this publication and there has been no significant financial support for this work that could have influenced its outcome.
References
- Menardo, S.; Cacciatore, V.; Balsari, P. Bioresour. Technol. 2015, 180, 154-161.
- Amnuaycheewa, P.; Hengaroonprasan, R.; Rattanaporn, K.; Kirdponpattara, S.; Cheenkachorn, K.; Sriariyanun, M. Ind. Crops. Prod. 2016, 87, 247-254.
- Zheng, Y.; Zhao, J.; Xu, F.; Li, Y. Prog. Energ. Combust. 2014, 42, 35-53.
- Lu, S.G.; Imai, T.; Ukita, M.; Sekine, M. J. Environ. Sci. 2007, 19, 416-420.
- Tiehm, A.; Nickel, K.; Zellhorn, M.; Neis, U. Water Res. 2001, 35, 2003-2009.
- Lei, Z.; Chen, J.; Zhang, Z.; Sugiura, N. Bioresour. Technol. 2010, 101, 4343-4348.
- Zhong, W.; Zhang, Z.; Qiao, W.; Fu, P.; Liu, M. Renew. Energ. 2011, 36, 875-1879.
- Hesami, S.M.; Zilouei, H.; Karimi, K.; Asadinezhad, A. Ind. Crops. Prod. 2015, 76, 449-455.
- Achinas, S.; Achinas, V.; Euverink, G.J.W. Engineering. 2017, 3(3), 299-307.
- Rasapoor, M.; Ajabshirchi, Y.; Adl, M.; Abdi, R.; Gharibi, A. Energy Convers. Manag. 2016, 119, 444-452.
- Rodriguez, C.; Alaswad, A.; Benyounis, K.Y.; Olabi, A.G. Renew. Sust. Energ. Rev. 2017, 68, 1193-1204.
- Chu, C.P.; Chang, B.-V.; Liao, G.S.; Jean, D.S.; Lee, D.J. Water Res. 2001, 35, 1038-1046.
- Sorys, P.; Zielewicz-Madej, E. Eur. Phys. J. Special Topics. 2008, 154, 289–294.
- Naveena, B.; Armshaw, P.; Tony Pembroke J. Biotechnol Biofuels. 2015, 8, 140.
- Raposo, F.; Banks, C.J.; Siegert, I.; Heaven, S.; Borja, R. Process Biochem. 2006, 41, 1444-1450.
- Paepatung, N.; Nopharatana, A.; Songkasiri, W. As. J. Energy Env. 2009, 10, 19-27.
- Lay, J.J.; Li, Y.Y.; Noike, T. J. Environ. Eng. 1998, 124, 730-736.
- Ebringerova, A.; Srokova, I.; Talaba, P.; Kacurakova, M.; Hromadkova, Z. J. Appl. Polym. Sci. 1998, 67, 1523–1530.
- Mason, T.J.; Peters, D. Practical Sonochemistry: Power Ultrasound Uses and Applications, 2nd ed., Elsevier Science & Technology Publishing: Chichester, UK. 2003.
- Sun, R.; Tomkinson, J. Sep Sci Technol. 2005, 39(2), 391-411,
- Kaparaju, P.; Felby, C. Bioresour. Technol. 2010, 101(9), 3175-3181.
- Duff, S.J.B.; Murray, W.D. Bioresour. Technol. 1996, 5(1), 1-33.
- Zhang, H.; Zhang, H.; Tong, M.; Shao, H.; Hu, X. J. App. Polym. Sci. 2008, 107, 636–641.
- Kok, V.M.; Özgür, E. Fuel Process Technol. 2013, 106, 739–743.
- Gírio, F.M.; Fonseca, C.; Carvalheiro, F.; Duarte, L.C.; Marques, S.; Bogel-Łukasik, R. Bioresour. Technol. 2010, 101(13), 4775-4800.
- Suresh, K.; Ranjan, A.; Singh, S.; Moholkar, V. S. Ultrason Sonochem. 2014, 21(1), 200-207.
- Xiong, Z. Y.; Qin, Y. H.; Ma, J. Y.; Yang, L.; Wu, Z. K.; Wang, T. L.; Wang, C. W. Bioresour. Technol. 2017, 227, 408-411.
- Grethlein, H.E. Nat. Biotechnol. 1985, 3(2):155-160
- Himmelsbach, D.S.; Khalili, S.; Akin D.E. J. Sci. Food Agric. 2002, 82, 685-696.
- Azizi, D.; Shafaei, S. Z.; Noaparast, M.; Abdollahi, H. T. Nonferr. Metal Soc. 2012, 22(9), 2295-2305.
- Trinh, T. K.; Kang, L. S. Environ. Eng. Res. 2010, 15(2), 63-70.
- Velmurugan, R.; Muthukumar, K. Bioresour. Technol. 2012, 112, 293-299.

This work is licensed under a Creative Commons Attribution 4.0 International License.
![]()
A New Edition of Web of Science
Journal Impact Factor
2022: 0.5
Five Year: 0.8
Journal is Indexed in

Cabells Whitelist
![]()


