Bioremediation of Phenolic Waters using the Microalgae Chlamydomonas Reinhardtii
Jorge Sanchez-Aponte1, Ildefonso Baldiris-Navarro1, Martha Torres-Virviescas*2 and Carlos Bohorquez3
1Environmental program, Sena Cinaflup Research Group, National Learning Service -Sena, Cartagena - Colombia.
2Marine Biology program, Universidad del Sinu, GIBEAM Research Group, Cartagena, Colombia.
3College of Science and Engineering, James Cook University. Douglas - 4718, Queensland, Australia.
Corresponding Author E-mail: ibaldiris@gmail.com
DOI : http://dx.doi.org/10.13005/ojc/350404
Article Received on : 30-12-2018
Article Accepted on : 01-07-2019
Article Published : 18 Jul 2019
In this research, the capacity of biodegradation of phenolic compounds using the microalgae Chlamydomonas reinhardtii was evaluated, as well as the impact of the contaminant on the growth of the microalgae. The bioassays consisted on three phenol concentrations: 25 mgL/L, 50 mgL/L and 100 mg/L and a control solution. Bioremediation rates of approximately 99% were obtained, showing no significant difference between medium and high concentration bioassays. A good microalgae growth rate was obtained for the tests at low and medium concentration, they were above the control bioassay, but the high concentration bioassay showed an inhibition in the cell growth, this one presented growth below the control bioassay. The use of the microalgae Chlamydomonas reinhardtii in bioremediation processes of phenolic effluents, whose concentrations are below 100 mg/L, is proposed for future research.
KEYWORDS:Bioassays; Bioremediation; Chlamydomonas reinhardtii; Phenol
Download this article as:| Copy the following to cite this article: Sanchez-Aponte J, Baldiris-Navarro I, Torres-Virviescas M, Bohorquez C. Bioremediation of Phenolic Waters using the Microalgae Chlamydomonas Reinhardtii. Orient J Chem 2019;35(4). |
| Copy the following to cite this URL: Sanchez-Aponte J, Baldiris-Navarro I, Torres-Virviescas M, Bohorquez C. Bioremediation of Phenolic Waters using the Microalgae Chlamydomonas Reinhardtii. Orient J Chem 2019;35(4). Available from: https://bit.ly/2JMCPGh |
Introduction
The quality of water sources in recent years has been under anthropogenic pressure due to population growth and industrialization, which has brought with it effluents contaminated with pollutants, being phenol one of the most commonly found. Phenolic compounds are those whose molecular structures have at least one phenol group, an aromatic ring attached to a functional group. The most common sources of anthropogenic phenol in natural waters are wastewater from industries that produce resins, plastics, fibers, adhesives, iron, steel, aluminum, rubber, and refinery effluents.1,2
Phenol and its derivatives represent a group of dangerous pollutants, which have an antibacterial and phytotoxic effect due mainly to their phenolic group. The most significant acute effects observed in aquaculture species after exposure to phenol include a reduced rate of heartbeats and epithelial damage to gills, liver, and kidneys. It is suspected that some phenolic compounds at low concentrations are endocrine disruptors.3 Therefore, even at low concentrations, phenolic compounds have adverse effects on humans and other organisms.4,5,6 Phenol might be removed from effluents by conventional physicochemical means which are very complex and costly. Bioremediation is currently a mechanism to eliminate this pollutant from the different ecosystems, because in addition to its low cost it leads to the mineralization of the initial contamination to CO2, H2O, NO3– and other inorganic compounds.7 Microalgae begin to play an increasingly important role in the treatment of water contaminated with organic compounds and fractions of petroleum.8 To date, microalgae such as Prototheca zopfii, Selenastrum capricornutum, Scenedesmus acutus and Ankistrodesmus braunii, Chlamydomonas ulvaensis, Chlorella pyrenoidosa and Scenedesmus brasiliensis, the phytoflagellate Euglena gracilis have been shown efficient degrade various organic compounds including petroleum derivatives and HPA.7,9,10,11 El-Sheekh, M. M.; Ghareib, M. M.; EL-Souod, G. A.; Abou-el-souod, G. W12 used the green microalgae Chlorella vulgaris, Elkatothrix viridis and Volvox aureus and the blue microalgae Lyngbya lagerlerimi, Nostoc linckia and Oscillatoria rubescens in bioassays to degrade phenolic compounds. The species Nostoc linckia degraded 47.71% of naphthalene in 7 days, Elkatothrix viridis degraded 92.3% of anthracene and 79.74% of 3.1 benzexaninen-4 at the same time.12
Lee Lee, H. C.; Lee, M.; Den, W 9 investigated the tolerance and biodegradation of microalgae Spirulina maxima using wastewater contaminated with phenol. The results showed that the microalgae could grow and removed 97.5% of the phenol in the first 24 hours of the study. A. T. Al-fawwaz, A.T.; Jacob, J. H.; Al-wahishe, T. E.7 used the microalgae Desmodesmus sp. and Chlamydomonas sp. and two species of Rhizopus sp. and Mucor sp. to study its ability to remove phenolic compounds.
The aim of the present study was twofold: (a) evaluate the capacity of biodegradation of phenolic compounds using the microalgae Chlamydomonas reinhardtii, and (b) to evaluate the impact of the contaminant on the microalgae growth.
Materials and Methodology
Materials
The native microalga Chlamydomonas reinhardtii was obtained from the collection of the National Learning Service (SENA), a single species belonging to the Chlorophyta division, Chlorophyceae (Chlorophyceae), Volvocales order, Chlamydomonadacea family, Chlamydomonas genus.
Culture Conditions
The microalgae were scaled up from an algae batch. It was started with a petri dish, to a test tube, to a 250 ml Erlenmeyer and finally to a 1000 ml Erlenmeyer. Strains were maintained in modified Conway culture medium. Culture conditions included a temperature of 24 ± 2°C, fluorescent lamps of 39W as a source of artificial illumination with irradiation of 5000 lux, photoperiod of 12 hours of light and 12 of darkness, aeration of 0.7 vvm using atmospheric air through of a mechanical ventilator, without CO2 injection. Each microalga was cultured four times for the time needed to achieve the reduction of the phenol concentration.
Phenol Bioassays
In order to analyze the variation of the phenol concentration, a calibration curve was first made to measure the concentration of this analyte by spectrophotometry. The calibration curve was prepared using standard solutions of 0.1, 0.25, 0.5, 0.75, 1.0, 2.5 and 5.0 mg/L of reagent grade phenol using a Genesys spectrophotometer. To measure the phenol degradability by Chlamydomonas reinhardtii, the microalga was contacted with phenol solutions of 25, 50 and 100 mg/L and allowed to interact. The growth of the biomass was analyzed at equal intervals of 24 h by spectrophotometry at 680 nm and by Neubauer chamber (haemocytometer).13 Residual phenol was analyzed by spectrophotometry at 510 nm using the 4-aminoantipyrine method at equal 24 h time intervals, samples were diluted with ultrapure water in order to use the prepared calibration curve, then the resulting concentrations were multiplied by the dilution factor.14
Results and Discussion
Bioassays with Phenol at Different Concentrations
Bioremediation of phenolic waters at concentrations of 25 mg/L, 50 mg/L and 100 mg/L with the species Chlamydomonas reinhardtti under laboratory conditions, produced phenol removal rates between 96 and 98% as shown in Figures 1 to 3.
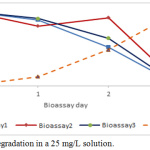 |
Figure 1: Phenol degradation in a 25 mg/L solution. |
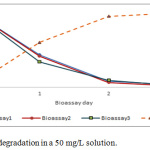 |
Figure 2: Phenol degradation in a 50 mg/L solution. |
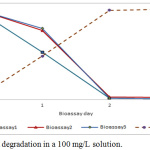 |
Figure 3: Phenol degradation in a 100 mg/L solution. |
On the other hand, the ANOVA analysis for the percentage of biodegradation (Fig. 4) showed that the process of phenol removal had no significant differences between the medium and high concentrations, but the low concentration behaved differently. Although low concentration reached equals removal levels, the performance was lower during the bioassays.
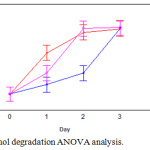 |
Figure 4: Phenol degradation ANOVA analysis. |
Micro-algal growth at different phenol concentrations
The growth of Chlamydomonas reinrhadtti depending on the culture time shown for the 25 mg/L phenol concentration, a cell density above the control bioassay. Although the third bioassay at this phenol concentration started below the control, it finally exceeded the growth obtained at the control (1’252.375 cells/mL). The highest population density attained was 1’692.500 cells/mL (Figure 5).
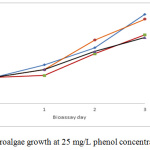 |
Figure 5: Microalgae growth at 25 mg/L phenol concentration. |
The maximum cell density reached for 50 mg/L phenol test was 1’865.000 cells/mL, being this phenol concentration favourable for micro-algal growth (see Fig. 6).
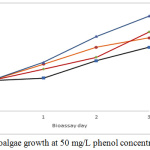 |
Figure 6: Microalgae growth at 50 mg/L phenol concentration. |
At the highest phenol concentration used (100 mg/L), inhibition of microalgal growth was noticed, with a maximum cell density of 1’020.000 cell/mL, which was below the growth of the control bioassay (1’252.375 cells/mL) (see fig 7).
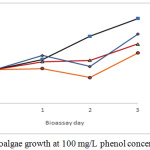 |
Figure 7: Microalgae growth at 100 mg/L phenol concentration. |
Different authors such as Ellis, since 1976 have been reporting successful biodegradation processes using the genus Chlamydomonas14. In this work phenolic waters bioremediation using Chlamydomonas reinhardtii, that was carried out in a closed system, showed a percentage of removal greater than 96% on the third day for all bioassays.
Those are highly promising results compared to those obtained by authors such as Udaiyappan, A. F. M.; Hasan, H. A.; Takriff, M. S.; Abdullah, S. R. S 16 who mentioned that with the species Chlamydomonas sp. a degradation of 56% was reached at 25 mg/L phenol concentration, while at a concentration of 100 mg/L it was only removed 7% in a period of 25 days under similar laboratory conditions.
Samanthakamani, D.; Thangaraju, N.,10 on the third day using Chlamydomonas reinhardtii obtained an 8.2% removal of phenol. In other studies, Hirooka et al.5 with the same species managed to remove only 1% of 2.4 dinitrophenol.
The microalgal growth of Chlamydomonas reinhardtii in the presence of phenol at different concentrations was evaluated in batch tests into a closed system. It was observed that there was microalgae growth at 25 and 50 mg/L phenol concentrations. Cell density values increased between 1’700.000 and 1’900.000 cel/mL and above of the control bioassay. This may be because the microalgae used phenol as a carbon source to growth, such as had been proposed by Nazos, T. T. and Kokarakis, E. J.17 At 100 mg/L phenol concentration, the growth was observed below the control test, similarly, in phenol toxicology tests with phenol concentrations between 10 and 80 mg/L, was observed marine microalgae growth inhibition.18
Nazos, T. T. and Kokarakis, E. J.,17 also reported growth inhibition, decreasing from 29% to 42% as the phenol concentration increased at a concentration of 14.1mg/L to 376mg/L respectively. Ji et al.,19 using Bisphenol at a concentration of 25 mg/L, observed that the growth of the microalgae Chlamydomonas mexicana and Chlorella vulgaris was slightly inhibited during the first 5 days, recovering after a certain level at the end of the 10-day. With Chlamydomonas mexicana at a Bisphenol concentration of 50 mg/L, cell growth was inhibited by 18%, observing a greater inhibition (85%) for Chlorella vulgaris. The growth rates of both microalgae decreased with increasing BPA concentration.
Conclusion
It was found that the microalgae Chlamydomonas reinhardtii may efficiently remove the phenol in concentrations of 25, 50 and 100 mg/L in three days with photoperiods of 12 hours and mechanical ventilation. The effect of the initial concentration of phenol on cell growth was also tested in this study. It was found that for phenol concentrations below 50 mg/L the microalgae had a growth above the control tests, which did not contain phenol and for concentrations above 100 mg/L, an inhibition of microalgae growth was evidenced.
Acknowledgements
The authors thank the National learning Service (SENA) for providing the funding for this research.
References
- Das, B.; Mandal, T. K.; Patra, S.; Int. J. Environ. Sci. Technol., 2016, 13, 529–542.
- Kang, J. H.; Katayama, Y.; Kondo, F.; Toxicology, 217, no. 2–3,81–90, 2006.
- Li, R.; Chen, GZ.; Tam, NF.; Luan, TG.; Shin, PK.; Cheung, SG.; Liu, Y.; Ecotoxicol. Environ. Saf., 2009, 72, 321–328.
- Ghasemi, Y.; Rasoul-Amini, S. Fotooh-Abadi, E., J. Phycol., 2011, 47, 969–980.
- Hirooka, T.; Akiyama, Y.;Tsuji, N.; Nakamura, T.; Nagase, H.; Hirata, K.; Miyamoto, K.; J. Biosci. Bioeng., 2003, 95, 200–203.
- Barron, M.; Haber, L.; Maier, A.; Zhao, J.; Dourson, M.; US EPA, 2002.
- A. T. Al-fawwaz, A.T.; Jacob, J. H.; Al-wahishe, T. E.; Int. J. Sci. Technol. Res., 2016, 5, 155–160.
- Ammar, S. H.; Khadim, H.J.; Mohamed, A. I.; Environmental Technology & innovation, 2018, 10, 132-142.
- Lee, H. C.; Lee, M.; Den, W.; Water. Air. Soil Pollut., 2015, 226, 395.
- Samanthakamani, D.; Thangaraju, N.; Ind. J. Sci. Res. and Tech., 2015, 3, 9–12, 2015.
- De Llasera, M. P. G.; Olmos-Espejel, J. de J.; Díaz-Flores, G.; Montaño-Montiel, A.; Environ. Sci. Pollut. Res., 2016, 23, 3365–3375.
- El-Sheekh, M. M.; Ghareib, M. M.; EL-Souod, G. A.; Abou-el-souod, G. W.; J. Bioremediation Biodegrad., 2012, 03, 1–9.
- Subashini, P.S.; Rajiv, P.; Orient. J. Chem., 2018, 34, 2517-2524.
- Lenore S Clesceri. Standard Methods for the Examination of Water and Wastewater;. 20th Edn, American Public Health Association, Washington, DC, USA. 1998.
- Ellis, B.E.; plant Sci Lett., 1977, 8, 213- 216.
- Udaiyappan, A. F. M.; Hasan, H. A.; Takriff, M. S.; Abdullah, S. R. S.; J. Water Process Eng., 2017, 20, 8–21.
- Nazos, T. T.; Kokarakis, E. J.; Photosynth. Res., 2017, 131, 31-40.
- Duan, W.; Meng, F.; Lin, Y.; Wang, G.; Environ. Toxicol. Pharmacol., 2017, 52, 170–176.
- Ji, M. K.; Kabra, A. N.; Choi, J.; Hwang, J.H.; Kim, J.R.; Abou-Shanab, R.A.I.; Oh, Y.K,; Jeon, B-H. Ecol. Eng., 2014, 73, 260–269.

This work is licensed under a Creative Commons Attribution 4.0 International License.
![]()
A New Edition of Web of Science
Journal Impact Factor
2022: 0.5
Five Year: 0.8
Journal is Indexed in

Cabells Whitelist
![]()


