Bioethanol from Guinea Grass (Panicum Maximum) and Ragi Tempeh as Fermentation Starter using Bioreactor and Shaker
Y. C. Wong* and Z. K. Lam
Faculty of Bioengineering and Technology, Universiti Malaysia Kelantan, Jeli Campus, Locked Bag 100, 17600 Jeli, Kelantan, Malaysia.
Corresponding Author E-mail: yeeching@umk.edu.my
DOI : http://dx.doi.org/10.13005/ojc/350408
Article Received on : 03-02-2019
Article Accepted on : 30-07-2019
Article Published : 17 Aug 2019
This study was investigating the production of bioethanol from the mixture of guinea grass (Panicum maximum) and using ragi tempeh through fermentation. The acid pretreatment process was carried out using 15% v/v sulphuric acid. The fermentation was carried out in anaerobic condition using bioreactor and shaker at 37°C and different pH of 5,6,7, and 8. Freezing test and Tollens’ test result showed very ethanol concentration in the sample product is very low, and aldehyde compounds are present in the product sample. The aldehyde is released due to degradation of lignocellulosic feedstock by acid hydrolysis. HPLC is carried out for getting a more accurate result. The best result is chromatogram of sample 5, obtained by fermentation using shaker with pH 8. It shows normal chromatogram with ethanol yield of 7.89%.
KEYWORDS:Acid Pretreatment; Bioethanol; Panicum Maximum; Ragi Tempeh
Download this article as:| Copy the following to cite this article: Wong Y. C, Lam Z. K. Bioethanol from Guinea Grass (Panicum Maximum) and Ragi Tempeh as Fermentation Starter using Bioreactor and Shaker. Orient J Chem 2019;35(4). |
| Copy the following to cite this URL: Wong Y. C, Lam Z. K. Bioethanol from Guinea Grass (Panicum Maximum) and Ragi Tempeh as Fermentation Starter using Bioreactor and Shaker. Orient J Chem 2019;35(4). Available from: https://bit.ly/2YUs2V6 |
Introduction
Nowadays, the fossil fuel depletion issue triggered the finding of research of alternative fuel source. Bioethanol rises as second-generation biofuel and as replacement of petrol, it can blend with diesel with different proportion to produce usable biofuel and have high potential to replace petrol in the future. The case of Brazil that successfully produces ethanol using sugarcane as material and commercializes was fundamental for bioethanol production as biofuel. Food and fuel debate was the resistance for sugarcane ethanol production, so lignocellulosic biomass which is non-edible food crops with high energy yield can be considered as suitable feedstock for bioethanol production.2 Unlike sugarcane, energy crops like grass which a high growth rate, high survivability and high resistance to extreme environmental condition was suitable to replace sugarcane in bioethanol production. High carbohydrate content in the grass is a good source of the substrate to produce ethanol, this research focuses on using cellulose, which is occupied 25-40% in a plant to carry out fermentation and produce ethanol.
Guinea grass (Panicum maximum) belongs to lignocellulosic feedstock with high energy yield, it is easily assessible with high growth and survivability rate, make it become the most abundant grass in tropical region country.12 Ragi tempeh is the fermentation starter for tempeh production, it is served as media for Rhizopus spp microorganisms to grow and carry out fermentation.3 In anaerobic respiration, Rhizopus spp bacteria able to produce ethanol instead of lactic acid.1 The use of Guinea grass as lignocellulosic feedstock and use ragi tempeh as fermentation starter is the new combination for bioethanol production, if this combination can produce high bioethanol production with only acid hydrolysis involved in pretreatment, it could prove useful.
The second-generation biofuel was able to produce from edible and non-edible biomass, but the edible biomass here refers to the biomass contain sugar or starch content which is served as substrate for fermentation process; while the non-edible biomass refers to those forest residue, lignocellulosic feedstock, and domestic or industrial biomass.14 Regardless of the type of biomass, it can release several types of fermentable substrate used for fermentation. Example for the biomass are sucrose-based feedstock, starch-based feedstock, and lignocellulosic feedstock. Sucrose-based and starch-based feedstock can release sucrose and starch that used for fermentation process, while lignocellulosic feedstock can provide cellulose, hemi-cellulose, and lignin as fermentation substrate that used for ethanoic fermentation. Grass are example of lignocellulosic feedstock that contain high amount of cellulose, it can be hydrolyse by enzyme cellulase to release glucose as fermentable substrate.15 If the use of guinea grass on bioethanol production is succeed, it is important as fundamental and provided another selection and possibility for biofuel production industry in Malaysia.
For this study, both bioreactor and shaker are used for the fermentation process. The parameter of this experiment is the acid concentration using in pretreatment process, and the pH of the fermentation process. Acid pretreatment is the common method used to pretreat the feedstock and for increasing the yield of fermentable substrate release from the feedstock, such as glucose.8 The pH of fermentation indicates the optimum pH for microorganisms in carrying out ethanoic fermentation in the broth. The sample collected will proceed to High Performance Liquid Chromatography (HPLC) for the quantitative and qualitative test.
Material and Methods
Preparation of Panicum Maximum Bagasse
Fresh Guinea grass sample was collected within an area of UMK Jeli campus with GPS Coordinates of (05°44‟48.2”, 101°52‟05.6”) Latitude, Longitude. The feedstock was cut in small pieces and dried to remove water content, the drying process carry out using air oven, and the drying temperature is 60°C, for 2 days. The bagasse was milled to powder form for further size reduction and easy to store, the sample is stored in the poly bag.
Identification of the Number of Bacteria in Ragi Tempeh
The ragi tempeh is brought from Jeli Town market. The serial dilution and simple dilution were carried out to identify the bacteria amount and morphology of the bacteria. For carry out serial dilution, 1g of the sample were ground to powder and poured into media bottle that filled with 99 ml distilled water to fill up to 100 ml. The dilution concentration was ranged from . The culture media contained 7.5 g/L peptone, 5g/L yeast extract. 1 g/L , and agar powder. The medium was autoclaved at 121°C for 15 min. After dilution, using inoculating loop the streak the different diluted solution on the medium and incubated at 37°C for 2-3 day.
Acid-Pretreatment of Sample
The bagasse at a solid loading of 10% (w/v) was mixed with diluted sulphuric acid at different concentration of 0.6%, 0.9%, 1.2%, 1.5% and 5.0% (v/v), also the concentrated sulphuric acid which is 15%. The sulphuric acid with different concentration prepared by mixing concentrated sulphuric acid (98% – 100%) with distilled water. The mixture was then proceeded to pre-treatment process by autoclaved at 121°C for 15 min. After the pre-treatment, removed the solid bagasse of acid solution by vacuum filtration and collected the filtrate. Noted that the pH of the solution was extremely low due to the high concentration of sulphuric acid was used. The titration method is used to titrate 2M sodium hydroxide solution to neutralize the pH of the solution to a suitable pH. After neutralization, remove the suspended substance in solution by vacuum filtration again. Before further proceed of experiment, use benedict solution to test the glucose content in pre-treated solution.
Fermentation using Bioreactor and Shaker
The model of the bioreactor was BIOSTAT® A entry-level bioreactor/fermenter. 50g of ragi tempeh powder, 200 – 250 ml of acid pre-treated solution, and 800ml of nutrient media was added into the bioreactor. The nutrient media was made up by 7.5 g/L peptone, 5g/L yeast extract. 1 g/L and distilled water to make up to 800ml. Beside those main ingredients for fermentation, the choice for acid and base used to control the pH of bioreactor was 250ml of 1M sulphuric acid and 250 ml of 2M sodium hydroxide. Since the fermentation process belonged to anaerobic respiration the bioreactor should be seal and no air allowed entering, also it is no need to use antifoam for the fermentation. The RPM of the impeller is set to 100, and the dissolved oxygen amount in the broth should control to range 0.1 to 1 and shouldn’t be too high. The temperature was set at 35°C and control by the electrical heating jacket. Duration for fermentation was 2-3 days. The different pH used as a parameter for fermentation was 5, 6, 7, and 8. Before and after use of bioreactor it should be autoclaving to ensure no contamination would affect the fermentation process. Another fermentation process was carried out using benchtop shaker.
Recovery of Fermentation Broth by Centrifugation and Rotary Evaporation
After fermentation was done, the fermentation broth was collected and proceed to centrifugation and rotary evaporation by rotary evaporator. The fermentation broth was equally divided filled in all centrifuge bottle and centrifuge using a high capacity centrifuge. The RPM and duration were set to 1000 and 20 minutes. After centrifugation and remove solid content, the fermentation broth was proceeding to rotary evaporation. 200ml of fermentation broth was placed in a 500ml round bottom flask, too high amount of fermentation broth filled have the risk to spilled out when boiling, affect the amount of ethanol collect. The rpm of the rotor was 100, and the temperature of the water bath was set to 76°C. The collected sample in collecting flask in store and proceed to HPLC testing.
Characterization
Freezing test
After rotary evaporation, the samples were labeled and stored in the freezer. The temperature of the freezer was set to -20°C. Observed the change of the sample after 24 hours to check whether it is freeze to solid or not.4
Silver Mirror test
Chemical used in silver mirror test was 0.3M silver nitrate solution, 0.3M sodium hydroxide, and aqueous ammonia solution. Poured 2 mL of silver nitrate into a clean test tube, dropped 2-3 drops of sodium hydroxide in the test tube too, the brownish precipitate will be formed. After that, use dropper to dropped aqueous ammonia into the test tube until the brownish precipitate disappeared and the solution became colorless and clear, the fresh Tollens’ reagent was prepared and ready to use. 5ml of the sample was added into the mixture, the test tube was shaken well and placed in the hot water bath until the silver mirror was formed.9
High Performance Liquid Chromatography
High performance liquid chromatography machine was used to do qualitative and quantitative test. 1.5ml of the sample was injected into the HPLC system to determine the bioethanol yield. The recommended analytical conditions were: C18 column, 0.1% formic acid solution as mobile phase, 1ml/min flow rate, 20uL injection volume. The detector used is 254nm PDA detector and the calibration method was compared with ethanol standard curve
Results and Discussion
Benedict Test for Glucose Content After Pretreatment
The purpose for carrying out glucose assay is to test the amount of sugar release after pretreatment, also it was able to confirm the presence of sugar prior for fermentation. Benedict test result gives semi-quantitative estimation amount of reducing sugar, table 1 recorded the colour change for all 6-test subject. The concentration of diluted sulphuric acid concentration is 0.6%, 0.9%, 1.2%, 1.5% and 5%. Result in figure 1(a) showed that the colour appeared as green for 5% sulphuric acid concentration, and dark green color for 0.6%, 0.9%, 1.2% and 1.5% sulphuric acid concentration. Meanwhile, from figure 1(b) Benedict’s test for 15% sulphuric acid concentration showed yellow color. Acidic pretreatment using 15% sulphuric acid showed the best result among others, yellow color represents approximately 1.0% amount of glucose after pretreatment, while other sample having acid concentration of lower or equal to 5% show green color that represent approximately 0.5% amount of glucose. 15% sulphuric acid concentration now selected as acid concentration with the best performance and used it on the following procedure. Concentrated acid pretreatment able to release higher glucose yield compares to diluted acid pretreatment, which can cover the inadequate of not using in enzyme during fermentation.
Table 1: Result of benedict test for 6 acid pre-treated sample.
| Percentage of sulphuric acid used | Colour change after benedict test |
| 0.6 | Dark green |
| 0.9 | Dark green |
| 1.2 | Dark green |
| 1.5 | Dark green |
| 5.0 | Light green |
| 15.0 | Pale yellow |
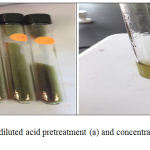 |
Figure 1: Benedict test for diluted acid pretreatment (a) and concentrated acid pretreatment (b) sample. |
Freezing Test
The sample is stored in a falcon tube and freeze it in the -20°C freezer. The observation of the freezing test has been done and tabulated in Table 2. After 48 hours of freezing, all the sample was freeze to solid. From direct observation, there is no liquid content appear in the sample. There are two possible outcomes to explain this: no ethanol content can be found, or the concentration of ethanol is extremely low. Although all the sample has frozen and become solid, there is still a possibility that it is because of the concentration of ethanol in the mixture is too low, maybe even lower than 1%. Also, it is assuming that the ethanol content might remain liquid in the middle of the frozen solid that cannot be observed directly. Further analysis of the mixture by HPLC will be proceeding to determine the presence of ethanol in the sample. When the temperature is -20°C then the only the mixture that has ethanol concentration less than or equal to 30 % will freeze.6 It is assuming that the concentration of ethanol is too low, cannot be identified by using a freezing test.
Table 2: Observation of physical state of ethanol produced using shaker and bioreactor at -20°C freezing point.
| Shaker | ||||
| Time | Physical state of ethanol mixture at -20°C | |||
| pH 5 | pH 6 | pH 8 | ||
| 24 hours | Solid | solid | solid | |
| 48 hours | solid | solid | solid | |
| Bioreactor | ||||
| Time | Physical state of ethanol mixture at -20 °C | |||
| pH 5 | pH 7 | |||
| 24 hours | solid | solid | ||
| 48 hours | solid | solid | ||
Tollens Test
After running the Tollens’ test, figure 2 showed the result for all 5 samples. Counting from the left, the first test tube showed grey-cloudy solution with the presence of black precipitate after remove the liquid content; unfortunately, the second test tube is accidentally broken, but from the figure, the black precipitate is formed in the inner of the test tube and attach on the surface. The first & second test tube is the sample carry out fermentation using bioreactor with different pH, the pH of the first test tube is 5 while the second test tube is 7. Although no silver mirror but the only cloudy solution with some black precipitate present, it is still a positive result for Tollens test, means the aldehyde is present in this 2 sample. The third to fifth test tube contains the sample produced by using a shaker with different pH as the parameter, the pH for sample 3, 4, 5 is pH 5, 6, 8. Sample 4 is showed the best performance of silver mirror test, the silver element is formed in the inner test tube surface. Sample 3 showed the same result as sample 1, which is a grey-cloudy solution with some black precipitate present. Sample 5 showed brown color solution after test, it is considered a negative result because it is neither form of silver mirror nor black precipitate with dark-cloudy solution appears. This Tollens test showed sample 1 to 4 present aldehyde that might cause the inhibitory effect of ethanoic fermentation and reduce the ethanol yield.
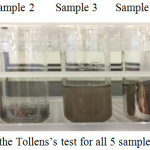 |
Figure 2: Result of the Tollens’s test for all 5 sample. |
Figure 3 showed all the possible molecules can be produced by using an acid pretreatment of lignocellulosic feedstock. Using acid pretreatment method will produce the inhibitory component.11 The example of an inhibitory substance that might bring inhibitory effect to ethanol production was furans, aliphatic carboxylic acids, uronic acids, and phenolic compounds.10 The hydrolysis of acetyl groups and esterified phenols in hemicellulose by acid pretreatment produce aliphatic carboxylic acids such as acetic acid, formic acid, levulinic acid, and phenolic compounds such as phenolic compounds, and non-phenolic aromatic compounds.10 other than furan aldehyde and phenolic aldehyde, there is also present of the small aliphatic aldehyde from acid pretreatment.10 Those inhibitory components will cause the inhibition of microorganisms, which causing limited growth of fermentative microorganisms and lower ethanol yield. The result of the silver mirror test showed the presence of aldehyde in all example, except sample 5. The presence of aldehyde is suspected to be the main reason for low ethanol yield after fermentation in this study.
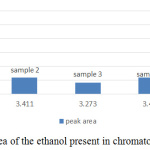 |
Figure 3: The peak area of the ethanol present in chromatogram of sample 1 to 5. |
High Performance Liquid Chromatography
After fermentation process, the fermentation broth is centrifuged to remove all the solid content. In order to improve the efficiency of centrifugation, the fermentation broth can be centrifuge by using smaller scale centrifuge machine, although the duration of centrifuge will highly increase. Rotary evaporation is selected to extract ethanol content from the liquid fermentation broth, its advantages is saved time but still less efficiency than steam distillation method, also called ethanol distillation method.
Table 3: Detail information for each peak in figure 13 (a).
| Peak # | Retention time | area | height | Area% | Height % |
| 1 | 0.602 | 124264 | 5767 | 8.349 | 7.817 |
| 2 | 1.512 | 647112 | 7647 | 43.480 | 10.366 |
| 3 | 2.497 | 220741 | 12241 | 14.832 | 16.592 |
| 4 | 2.768 | 202805 | 8200 | 13.627 | 11.115 |
| 5 | 3.475 | 28350 | 2668 | 1.905 | 3.617 |
| 6 | 4.171 | 68697 | 9004 | 4.616 | 12.205 |
| 7 | 5.071 | 196320 | 28246 | 13.191 | 38.288 |
| Total | 1488289 | 73772 | 100.000 | 100.000 |
From the standard curve, the acceptable range of the retention time of ethanol is within 3.2 – 3.4 min. It’s average producing peak area that increases directly proportional with the concentration of ethanol. Area of the peak and height of the peak has 2 different concepts, figure 4 and figure 5 summaries the useful information of ethanol concentration in the sample from figure 5 (a) to (e). The area of the peak refers to the concentration of the compound. The highest peak area was obtained from figure 5(a), which showed almost 30000Uv of height and it is a significant difference among other peaks in all chromatogram, but it didn’t mean the concentration of ethanol in sample 1 is high. Since the baseline drifting problem is very serious, studying the peak area percent showed in figure 5 will more accurate compared to figure 4. Figure 5 showed that except sample 3 and 5 all other samples only tested approximate 1% of ethanol present in the sample. The abnormal percentage of peak area is due to the baseline drifting problem too.
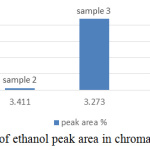 |
Figure 4: The percentage of ethanol peak area in chromatogram of sample 1 to 5. |
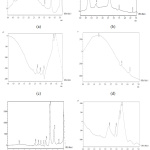 |
Figure 5: The chromatogram of (a) sample 1 produced using bioreactor with pH 5, (b) sample 2 produced using bioreactor with pH 7, (c) sample 3 produced using shaker with pH 5, (d) sample 4 produced using shaker with pH 6, (e) sample 5 produced using shaker with pH 8, (f) distilled water. |
Monitoring Data of Sample 1 and 2 which is Using Bioreactor for Fermentation
Unfortunately, besides the result of figure 5 (b) and 5 (e), all other chromatogram showed a very serious baseline shifting problem that brings negative impact to the result. Although these 2 chromatograms have better baseline among all chromatogram, there are many peak presents. The more peak obtains from the chromatogram, the less pure the sample is obtained. The retention time for ethanol obtains from the standard is around 3.3 minutes. The figure 5 (a) and (e) showed the major component peak appear after 3.3 minutes while the figure 5 (b) and (d) showed the major component peak appear before 3.3 minutes. This showed that the major component obtains in figure 5 (a) and (e) is not ethanol but less polar than ethanol following the principle of polarity, ethanol is less polarity than lactic acid but more polarity than aldehyde or ketone. It is suspect that the major component peak after ethanol peak is aldehyde and ketone while the other two is lactic acid.7
Table 4: Detail information for each peak in figure 13 (b).
| Peak # | Retention time | area | height | Area% | Height % |
| 1 | 0.740 | 278758 | 28803 | 53.880 | 65.802 |
| 2 | 1.392 | 32015 | 2357 | 6.188 | 5.385 |
| 3 | 2.614 | 195758 | 12073 | 37.837 | 27.581 |
| 4 | 3.411 | 9454 | 420 | 1.827 | 0.959 |
| 5 | 4.624 | 1383 | 120 | 0.267 | 0.273 |
| Total | 517368 | 43773 | 100.000 | 100.000 |
Table 5: Detail information for each peak in figure 13 (c).
| Peak # | Retention time | area | height | Area% | Height % |
| 1 | 2.657 | 1918 | 268 | 20.423 | 23.806 |
| 2 | 2.920 | 1831 | 190 | 19.492 | 16.899 |
| 3 | 3.273 | 4123 | 383 | 43.899 | 33.978 |
| 4 | 4.189 | 1520 | 285 | 16.185 | 25.317 |
| Total | 9392 | 1127 | 100.000 | 100.000 |
The parameter of the fermentation was pH, in sample 1 and 2 the pH set is 5 and 7. Figure 6 (left) and figure 9 (left) showed that during both fermentations process the pH is remains constant from the beginning to the end. If comparing figure 8 and 11, only sample 1 showed anaerobic condition along the fermentation period because there is no air enter the bioreactor, the amount of dissolved oxygen in the fermentation broth is near to zero during fermentation. Unfortunately, there is some air enters the bioreactor after 2 hours start of fermentation.
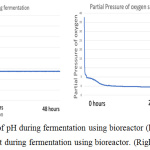 |
Figure 6: The monitor of pH during fermentation using bioreactor (left), the monitor of dissolve oxygen amount during fermentation using bioreactor. (Right). |
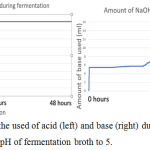 |
Figure 7: The monitor of the used of acid (left) and base (right) during fermentation using bioreactor to constant the pH of fermentation broth to 5. |
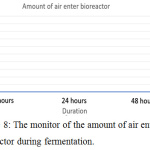 |
Figure 8: The monitor of the amount of air enter the bioreactor during fermentation. |
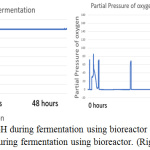 |
Figure 9: The monitor of pH during fermentation using bioreactor (left), the monitor of dissolve oxygen amount during fermentation using bioreactor. (Right). |
The figure 11 showed when the system detects the entry of air into the bioreactor; the fermentation was started on 9 am morning, the input of air is detected on 11 am, 1 pm and 9 pm. Although the bioreactor is immediately checked when finding the air enters bioreactor during 1 pm, but at 9 pm system still, detect the presence of air enter bioreactor for a little while. All the used and unused lid port is seal with parafilm to ensure no air enter. Unfortunately, the amount of dissolved oxygen in the fermentation broth is increased in the middle of fermentation. The amount of dissolved oxygen is increasing, it is believed that there is another reaction occur that acidified the fermentation broth and produce dissolve oxygen. During the halfway of fermentation that is not in supervision, all the base solution prepared for adjusting pH is finish used, but the system wasn’t able to detect and keep pumping air inside the base solution bottle into the bioreactor, this last for approximate 1-2 hours until it was found. Although the base solution is refilled immediately, it already brings serious impact to the reaction happen in the fermentation broth. From the figure 7 (left) and 10 (left), it can be found that no acid used by bioreactor system to adjust pH, but from figure 7 (right) and figure 10 (right) the amount of base used is keep increasing during fermentation. This showed the fermentation process will produce ethanol and others substance that increasing the acidity of the fermentation broth, the lactic acid is produced in the fermentation that used ragi tempeh as fermentation starter,13 hence more base enters the fermentation broth to ensure the pH stay constant.
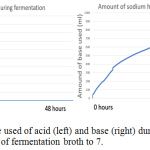 |
Figure 10: The monitor of the used of acid (left) and base (right) during fermentation using bioreactor to constant the pH of fermentation broth to 7. |
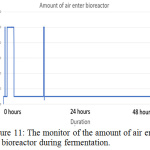 |
Figure 11: The monitor of the amount of air enter the bioreactor during fermentation. |
From the observation of figure 6 to 11, there is one change in common, which is the reaction in fermentation broth will acidify the fermentation broth, the used of a base solution by the system to adjust pH proved this statement. The ethanol is well-known to produce in an anaerobic condition, which is the absence of oxygen. Since the ragi tempeh is used and the starter culture is Rhizopus spp bacteria, with the presence of oxygen the amount of lactic acid production. Generally, the higher the lactic acid production, the lower the ethanol production. Rhizopus spp requires oxygen supply to carry out aerobic fermentation to produce lactic acid. For pH 5 sample, which is sample 1, since there is no dissolved oxygen enter the fermentation broth, the amount of lactic acid production is very little, only a few ml of base solution is used to adjust back the pH to 5, the pH value will drop during its production. The condition in the pH 7 sample is different since the dissolved oxygen is entered due to the experimental mistake, the fermentation change to aerobic fermentation for Rhizopus spp bacteria. Lactic acid is produced, and the amount of ethanol is decreased. From figure 10 (right), the use of the base solution is kept increase indicate the production of lactic acid, but from figure 9 (right) showed the amount of dissolved oxygen is decrease when the fermentation is going to stop. It is predicted as the amount of dissolved oxygen is used up hence the production of lactic acid is slowing down, aerobic fermentation was started to convert back to anaerobic fermentation.
Table 6: Detail information for each peak in figure 13 (d).
| Peak # | Retention time | area | height | Area% | Height % |
| 1 | 1.355 | 581025 | 4480 | 98.637 | 88.061 |
| 2 | 3.416 | 5895 | 249 | 1.001249 | 4.895 |
| 3 | 4.151 | 2136 | 358 | 0.363583 | 7.044 |
| Total | 589056 | 5088 | 100.000 | 100.000 |
Table 7: Detail information for each peak in figure 13 (e).
| Peak # | Retention time | area | height | Area% | Height % |
| 1 | 0.957 | 1248 | 158 | 0.612 | 0.504 |
| 2 | 2.449 | 6156 | 1036 | 3.017 | 3.314 |
| 3 | 2.691 | 3925 | 710 | 1.923 | 2.272 |
| 4 | 2.913 | 5040 | 471 | 2.470 | 1.506 |
| 5 | 3.175 | 2927 | 466 | 1.435 | 1.491 |
| 6 | 3.411 | 16048 | 2655 | 7.865 | 8.497 |
| 7 | 3.790 | 117941 | 18636 | 57.800 | 59.635 |
| 8 | 4.159 | 48601 | 6799 | 23.818 | 21.756 |
| 9 | 4.538 | 2166 | 320 | 1.062 | 1.024 |
| Total | 204051 | 31251 | 100.000 | 100.000 |
Table 8: Detail information for each peak in figure 13 (f).
| Peak # | Retention time | area | height | Area% | Height % |
| 1 | 2.306 | 18194 | 644 | 24.645 | 13.499 |
| 2 | 2.914 | 4432 | 699 | 5.273 | 14.661 |
| 3 | 3.253 | 15444 | 1419 | 18.373 | 29.751 |
| 4 | 3.439 | 45986 | 2007 | 54.709 | 42.088 |
| Total | 589056 | 5088 | 100.000 | 100.000 |
Figure 6 to figure 11 showed the fermentation data that contribute to the result of figure 5 (b). But from figure 5 (b) the result of chromatogram still showed low production of ethanol at the end. The retention time at 0.74 minutes showed a major peak area and is suspect to be lactic acid. Lactic acid is a polar molecule, according to the principle of the polarity of an organic compound, the polarity of acid is greater than alcohol.7 From figure 5 (b) the major component peak appears before retention time of ethanol showing this major component is more polar than ethanol, although there is no testing to prove the presence of lactic acid in the sample, it is highly suspected to be lactic acid.
Discussion
Malaysia as a palm oil producing countries was highly depending on palm oil for biofuel production, but the demand of palm oil in manufacturing industry of Malaysia is high too. This limitation restricts the development of biofuel industry in Malaysia, carry unstable effect on the export of palm oil product and biofuel to other country. If Malaysia able to find an alternative to replace the palm oil as raw material for bioethanol production, it would provide huge advantage for Malaysia to occupy larger market share in worldwide bioethanol market and raise the competitive strength of Malaysia. If grass plant as lignocellulosic feedstock can provide another selection of raw material for biofuel production, the Malaysia’s biofuel production and its export will surely increase.
The baseline drifting problem might cause by the contamination of the mobile phase. The dirty column also the reason of irregular baseline problem. During the preparation of the mobile phase, the water used is distilled water, HPLC instrument is highly sensitive, any contaminant might affect the reading of PDA detector. The method used to test ethanol using PDA detector is the in-direct photometric mode, it is highly sensitive to the change of absorbance due to the contaminant present in the mobile phase. It is suggested to purge the column before use and prepares the mobile phase with high purity distilled or deionized water. When operating HPLC, make sure only use HPLC grade salt, reagent, and solvent. Besides the peak present on retention time 3.3 min, the possibility of other peak represents lactic acid, an inhibitory substance for ethanoic fermentation, and the glucose, which is the substrate that cannot be used for ethanoic fermentation because of the presence of inhibitory substance.
Due to the limitation of time and instrumentation, the result showed the chromatogram with some defect. The method used to detect ethanol content in fermentation broth through HPLC isn’t inappropriate but considered as out-of-date method, if RI detector can be used provided with appropriate standard of ethanol and other by-product it can improve the accuracy of the result obtained. Beside HPLC method, GCMS (Gas Chromatography Mass Spectrophotometry) is an appropriated method for determination of ethanol and others content. Also, perhaps in future research there is various kind of enzymatic hydrolysis and fermentation condition can be added to investigated and study, with the support of better instrumentation.
Conclusion
The bioethanol production from lignocellulosic biomass such as tropical grass is recommended because it is cheap and easy accessible, but the proper pretreatment and enzymatic hydrolysis to the feedstock are challenging and costly. The chemical pretreatment is necessary for the degradation of lignocellulosic feedstock for better release of fermentation substrate and ease of enzymatic hydrolysis, and it is proved from the result of Benedict’s test. Besides the use of a chemical substance, the ragi tempeh act as fermentation media for living of microorganism that involved to utilize the fermentable substrate to ethanol. This paper belongs to lab-scale study, the test used for characterization is freezing test, Tollens’ test, and High-Performance Liquid Chromatography (HPLC). The result showed the acid pretreatment and fermentation without involved the enzyme has very low ethanol yield.
The concentration of acid used in pretreatment, pH of fermentation broth, and fermentation using bioreactor and shaker, is the parameter selected for this study, the concentration of acid for pretreatment is 0.6%, 0.9%, 1.2%, 1.5%, 5.0%, and 15%. Although 15% of sulphuric acid pretreatment showed a greater amount of glucose release, the characterization test showed low ethanol concentration in all sample. Among all HPLC chromatogram, the sample obtained from pH 8 fermentation broth using shaker showed the highest ethanol yield compared to other which is 7.8% of ethanol. This is not expected because the optimum fermentation pH is within 5-7. To study the composition of the product, the Tollens’ test showed that the aldehyde is present in all the sample after fermentation, the aldehyde is an inhibitory substance that causes the inhibitory of activity of microorganisms, lower the yield of the substrate be consumed and fermented to ethanol. Further analysis using HPLC showed the ethanol concentration is very low in all sample.
Acknowledgements
The authors express their sincere appreciation to the Faculty of Bioengineering and Technology, Universiti Malaysia Kelantan, Jeli Campus for the support and good facilities which made this study possible.
References
- Abedinifar, S.; Karimi, K.; Khanahmadi, M.; & Taherzadeh, M. J. Ethanol production by Mucor indicus and Rhizopus oryzae from rice straw by separate hydrolysis and fermentation. Biomass and Bioenergy., 2009, 33(5), 828–833.
- Araújo, K.; Devinder Mahajan, Kerr, R.; & Silva, M. da. Global Biofuels at the Crossroads: An Overview of Technical, Policy, and Investment Complexities in the Sustainability of Biofuel Development. Agriculture., 2017, 7(4), 32.
- Azlin, S,A.; Gek, C, N.; Maizirwan, M.; & Masitah, H. Ragi tapai and Saccharomyces cerevisiae as potential coculture in viscous fermentation medium for ethanol production. African Journal of Biotechnology., 2010, 9(42), 7122-7127.
- Cooper, A. Science How Stuff Works., 2019.
- Danmaliki, G. I.; Muhammad, A. M.; Shamsuddeen, A. A.; & Usman, B. J. Bioethanol Production from Banana Peels. IOSR Journal of Environmental Science Ver. II., 2015, 10(6), 56–62.
- Dean, J. A. Lange’s Handbook of Chemistry. (Robert Esposito, Ed.). R. R. Donnelley & Sons Company., 2008.
- E.Ophardt, C. Introduction to Carbonyl Compounds., 2003.
- Farrukh, R, A.; Habiba, K. Pretreatment methods of lignocellulosic biomass for anaerobic digestion., 2017.
- Gunawardena, G. Chemistry LibreTexts Library. 2017.
- Jönsson, L. J.; & Martín, C. Pretreatment of lignocellulose: Formation of inhibitory byproducts and strategies for minimizing their effects. Bioresource Technology., 2016, 199, 103–112.
- Kumar, A. K.; & Sharma, S. Recent updates on different methods of pretreatment of lignocellulosic feedstocks: a review. Bioresources and Bioprocessing., 2017, 4(1).
- Liana Jank, E. A. (2013). Potential of Panicum maximum as a source of energy. Tropical Grasslands – Forrajes Tropicales, 92-94
- Millati, R.; Edebo, L.; & Taherzadeh, M. J. Performance of Rhizopus, Rhizomucor, and Mucor in ethanol production from glucose, xylose, and wood hydrolyzates. Enzyme and Microbial Technology., 2005, 36(2–3), 294–300.
- Mustafa, V.; Jagdish, M.; Rahul, M.; Satish, P.; Sanjay, P. Bioethanol production: Feedstock and current technologies, Journal of Environmental Chemical Engineering 2., 2014, 573-584.
- S, N, Naik.; Vaibhav, V.; Prasant, K, R.; Ajay, K, D. Production of first and second generation biofuels: A comprehensive review. Renewable and Sustainable Energy Reviews., 2010, 578-597.

This work is licensed under a Creative Commons Attribution 4.0 International License.
![]()
A New Edition of Web of Science
Journal Impact Factor
2022: 0.5
Five Year: 0.8
Journal is Indexed in

Cabells Whitelist
![]()


