An Investigation of Ultrasonic Velocity and Allied Parameters of Terbium Octanoate in Binary Organic Solvent
Chitra Singh1, S. K. Upadhyaya2 and Kamal Kishore*3
1Department of Education Science and Mathematics, Regional Institute of Education,
Shyamla-Hills, Bhopal - 462013, India.
2Department of Chemistry, S.S.L. Jain College, VIDISHA-464001 (M.P.) India.
3Department of Chemistry, Akal college of Basic Sciences, Eternal University, Baru Sahib, Sirmaur, Himachal Pradesh-173101 India.
Corresponding Author E-mail: k_81kishore@yahoo.co.in
DOI : http://dx.doi.org/10.13005/ojc/350405
Article Received on : 11-12-2018
Article Accepted on : 03-07-2019
Article Published : 22 Jul 2019
Ultrasonic velocity technique has been employed to estimate the critical micellar concentration (CMC), solute-solvent interactions, compressibility behavior and ultrasonic allied parameters of terbium octanoate in mixed organic solvent at four different temperatures i.e. 25, 30, 35 and 40oC. The results have revealed that value of CMC increase with elevating temperature and there exist significant interactions between terbium octanoate and solvent molecules after micellization.
KEYWORDS:Acoustic Parameters; Compressibility; Critical Micellar Concentration; Ultrasonic Velocity
Download this article as:| Copy the following to cite this article: Singh C, Upadhyaya S. K, Kishore K. An Investigation of Ultrasonic Velocity and Allied Parameters of Terbium Octanoate in Binary Organic Solvent. Orient J Chem 2019;35(4). |
| Copy the following to cite this URL: Singh C, Upadhyaya S. K, Kishore K. An Investigation of Ultrasonic Velocity and Allied Parameters of Terbium Octanoate in Binary Organic Solvent. Orient J Chem 2019;35(4). Available from: https://bit.ly/2LyDT3R |
Introduction
Ultrasonic velocity technique was comprehensively used to approximate the thermodynamic behavior and predict the intermolecular interactions of soaps in different solvents systems.1,2 The ultrasound velocity is a very useful method, with which a number of physical properties of an electrolytic solution could be calculated.3 Many researchers4-8 reported ultrasonic velocity behavior of lanthanide soaps in non-aqueous solvent. Suleman et al9,10 estimated ultrasonic properties of transition metal based soaps by using liquor ammonia as solvent. Rawat and coworkers11 investigated alkaline-earth metal soaps- organic solvent interactions and compressibility behavior. However the ultrasonic behavior of terbium octanoate has not been investigated carefully. The present paper deals with the ultrasonic velocity behavior for the solutions of terbium octanoate in binary solvent mixture of benzene: methanol (60:40 %) of varying concentrations and temperatures (25° to 40°C), to calculate ultrasonic velocity based parameters.
Experimental
Anala R grade benzene, octanoic acid, ethanol, methanol and terbium acetate (99.9% purity, Indian Rare Earth Limited, Kerala) had used for study. Terbium octanoate was synthesized by double replacement of potassium octanoate by minor stoichiometric additional terbium acetate solution (aqueous) at elevated temperature with constant stirring. White precipitates were filtered and washed first with warm distilled water and then with acetone. Preliminary drying was completed in air oven at 50-60°C, then last drying was done in reduced pressure. The purified compound has the melting point 92°C. The solutions for the study were prepared, by dissolving a calculated amount of synthesized compound in binary mixture of benzene: methanol (60:40 %) and kept for two hours in thermostat at constant temperature. The reason for the choice of solvent system can be explained; as terbium octanoate exhibits amphiphilic structure; one non-polar tail (long chain) and another polar head (carboxylate end). It is little soluble in either benzene or methanol12 and insoluble in aqueous system. The hydrocarbon chain dissolves in non-polar benzene and carboxylate end in polar methanol. Here non-polar part is longer and bulkier than polar part; therefore needs extra benzene as 60 volumes and carboxylate end needs lower methanol as 40 volumes.
Measurement
Ultrasonic study was carried by ultrasonic interferometer (MX-3, Mittal Enterprises) in the temperature range from 25°C to 40°C (± 0.5°C) at a frequency of 1 MHz. The velocity values have an error of ±50 cms-1. Density of terbium octanoate solutions were measured by RD bottle (calibrated by benzene).
Calculation
Measured values of ultrasonic velocity (ν) and density (ρ) can be used to calculate various other acoustic parameters13 like adiabatic compressibility (ks), molar compressibility (W), intermolecular free length (Lf)14 specific acoustic impedance (Z),15 apparent molar compressibility (∅k),15 available volume (Va),16 molar sound velocity (R),17 relative association (RA),18 solvation number (Sn) and relaxation strength (r)19 by following equations.
Where,
Here,r, r0,n, n0, ks, ks0,
![]()
are density, ultrasonic velocity, adiabatic compressibility and molar volume of solutions and solvent, respectively. Here M, M0, n, and n0 are the molecular weight and number of moles of solute and solvent, respectively. K and
![]()
are the Jacobson’s constant and effective molecular weight of solution. ∅k is apparent molar compressibility. ηα is equal to 160000 cm s-1.
Results and Discussion
Ultrasonic velocity (n) and density (ρ) of terbium octanoate, were measured at 25°, 30°, 35° and 40°C in mixture of benzene and methanol. The relation between ultrasonic velocity, density and adiabatic compressibility is given by the following equation;
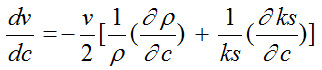
The derivative

is positive and

is negative. Hence, the value

dominates over

for different solutions.
![]()
would remain positive, i.e. ultrasonic velocity rises with increase in concentration. The results have shown that density and ultrasonic velocity increase as concentration increases. A relation between ultrasonic velocity and concentration is given by(for dilute solutions);
ν = νo + Gc
Here, νo stands for the ultrasonic velocity of solvent system and G for Garnsey’s constant.20
Table 1: Ultrasonic velocity, relaxation strength and compressibility and of terbium octanoate in mixture of V (benzene): V (methanol) = 60:40, at four temperatures.
| Concentration, C x 10-3 (molL-1) | Density, ρ (g ml-1) | Velocity, n x 105 (cm/sec) | Adiabatic compressibility, ks x 10-11 (cm2 dyne-1) | Molar compressibility, W x 102 | Apparent molar compressibility, -∅k x 10-6 (cm2dyne-1) | Relaxation strength, r |
| At 25°C ± 0.5°C | ||||||
| 1.0 | 0.8448 | 1.154 | 8.89 | 16.37 | 4.39 | 0.480 |
| 1.5 | 0.8455 | 1.168 | 8.67 | 16.42 | 4.41 | 0.467 |
| 2.0 | 0.8460 | 1.182 | 8.46 | 16.47 | 4.34 | 0.454 |
| 2.5 | 0.8467 | 1.195 | 8.27 | 16.52 | 4.27 | 0.442 |
| 3.0 | 0.8472 | 1.210 | 8.06 | 16.58 | 4.26 | 0.428 |
| 3.5 | 0.8478 | 1.223 | 7.89 | 16.62 | 4.16 | 0.416 |
| 4.0 | 0.8483 | 1.232 | 7.77 | 16.66 | 3.95 | 0.407 |
| 4.5 | 0.8487 | 1.240 | 7.66 | 16.68 | 3.74 | 0.399 |
| 5.0 | 0.8492 | 1.248 | 7.56 | 16.71 | 3.58 | 0.392 |
| At 30°C ± 0.5°C | ||||||
| 1.0 | 0.8447 | 1.150 | 8.95 | 16.36 | 4.33 | 0.483 |
| 1.5 | 0.8453 | 1.165 | 8.72 | 16.41 | 4.35 | 0.470 |
| 2.0 | 0.8458 | 1.178 | 8.52 | 16.46 | 4.25 | 0.458 |
| 2.5 | 0.8464 | 1.190 | 8.34 | 16.51 | 4.12 | 0.447 |
| 3.0 | 0.8470 | 1.205 | 8.13 | 16.56 | 4.14 | 0.433 |
| 3.5 | 0.8477 | 1.219 | 7.94 | 16.61 | 4.12 | 0.419 |
| 4.0 | 0.8480 | 1.228 | 7.82 | 16.64 | 3.90 | 0.411 |
| 4.5 | 0.8485 | 1.235 | 7.73 | 16.66 | 3.68 | 0.404 |
| 5.0 | 0.8488 | 1.245 | 7.60 | 16.71 | 3.56 | 0.394 |
| At 35°C ± 0.5°C | ||||||
| 1.0 | 0.8445 | 1.148 | 8.98 | 16.35 | 4.01 | 0.485 |
| 1.5 | 0.8450 | 1.160 | 8.79 | 16.40 | 3.95 | 0.474 |
| 2.0 | 0.8456 | 1.174 | 8.58 | 16.45 | 4.05 | 0.462 |
| 2.5 | 0.8462 | 1.187 | 8.39 | 16.50 | 4.03 | 0.450 |
| 3.0 | 0.8467 | 1.200 | 8.20 | 16.55 | 3.98 | 0.437 |
| 3.5 | 0.8473 | 1.213 | 8.02 | 16.59 | 3.94 | 0.425 |
| 4.0 | 0.8478 | 1.225 | 7.86 | 16.64 | 3.86 | 0.414 |
| 4.5 | 0.8482 | 1.232 | 7.77 | 16.66 | 3.64 | 0.407 |
| 5.0 | 0.8485 | 1.239 | 7.68 | 16.69 | 3.45 | 0.400 |
| At 40oC ± 0.5oC | ||||||
| 1.0 | 0.8443 | 1.144 | 9.05 | 16.34 | 3.58 | 0.489 |
| 1.5 | 0.8448 | 1.157 | 8.84 | 16.39 | 3.79 | 0.477 |
| 2.0 | 0.8453 | 1.170 | 8.64 | 16.44 | 3.85 | 0.465 |
| 2.5 | 0.8459 | 1.183 | 8.45 | 16.49 | 3.88 | 0.453 |
| 3.0 | 0.8465 | 1.195 | 8.27 | 16.53 | 3.83 | 0.442 |
| 3.5 | 0.8470 | 1.208 | 8.09 | 16.58 | 3.80 | 0.430 |
| 4.0 | 0.8475 | 1.221 | 7.91 | 16.63 | 3.77 | 0.418 |
| 4.5 | 0.8478 | 1.227 | 7.83 | 16.65 | 3.53 | 0.412 |
| 5.0 | 0.8481 | 1.233 | 7.76 | 16.67 | 3.34 | 0.406 |
Table 2: Ultrasonic velocity based parameters of terbium octanoate at four temperatures.
| Concentration, C x 10-3 (moll-1) | Intermolecular free length, Lf(Å) | Specific acoustic impedance, Z x 105 | Solvation number, Sn | Molar sound velocity, R | Available volume, Va | Relative association, RA |
| At 25°C ± 0.5°C | ||||||
| 1.0 | 0.6053 | 0.975 | 147.93 | 2922 | 16.73 | 0.994 |
| 1.5 | 0.5977 | 0.987 | 114.39 | 2932 | 16.20 | 0.991 |
| 2.0 | 0.5907 | 1.000 | 97.00 | 2943 | 15.66 | 0.988 |
| 2.5 | 0.5839 | 1.012 | 85.20 | 2952 | 15.17 | 0.985 |
| 3.0 | 0.5764 | 1.025 | 78.60 | 2964 | 14.61 | 0.981 |
| 3.5 | 0.5701 | 1.037 | 72.77 | 2973 | 14.11 | 0.978 |
| 4.0 | 0.5658 | 1.045 | 66.86 | 2980 | 13.77 | 0.977 |
| 4.5 | 0.5620 | 1.052 | 61.90 | 2985 | 13.47 | 0.975 |
| 5.0 | 0.5582 | 1.060 | 57.92 | 2991 | 13.17 | 0.973 |
| At 30°C ± 0.5°C | ||||||
| 1.0 | 0.6074 | 0.971 | 143.11 | 2919 | 16.88 | 0.995 |
| 1.5 | 0.5994 | 0.985 | 112.24 | 2930 | 16.31 | 0.991 |
| 2.0 | 0.5962 | 0.996 | 94.66 | 2940 | 15.82 | 0.988 |
| 2.5 | 0.5864 | 1.007 | 83.30 | 2949 | 15.36 | 0.985 |
| 3.0 | 0.5789 | 1.021 | 76.98 | 2961 | 14.80 | 0.982 |
| 3.5 | 0.5720 | 1.033 | 71.85 | 2970 | 14.26 | 0.979 |
| 4.0 | 0.5677 | 1.041 | 66.05 | 2978 | 13.93 | 0.977 |
| 4.5 | 0.5643 | 1.048 | 60.92 | 2982 | 13.66 | 0.976 |
| 5.0 | 0.5597 | 1.057 | 57.53 | 2990 | 13.29 | 0.973 |
| At 35°C ± 0.5°C | ||||||
| 1.0 | 0.6085 | 0.969 | 142.38 | 2918 | 16.96 | 0.995 |
| 1.5 | 0.6021 | 0.980 | 108.43 | 2927 | 16.50 | 0.992 |
| 2.0 | 0.5947 | 0.993 | 92.79 | 2938 | 15.97 | 0.989 |
| 2.5 | 0.5879 | 1.004 | 82.46 | 2947 | 15.40 | 0.986 |
| 3.0 | 0.5814 | 0.016 | 75.30 | 2958 | 14.99 | 0.983 |
| 3.5 | 0.5750 | 1.028 | 70.05 | 2967 | 14.49 | 0.980 |
| 4.0 | 0.5692 | 1.038 | 65.59 | 2976 | 14.04 | 0.978 |
| 4.5 | 0.5658 | 1.045 | 60.51 | 2981 | 13.78 | 0.976 |
| 5.0 | 0.5625 | 1.051 | 56.38 | 2986 | 13.51 | 0.975 |
| At 40°C ± 0.5°C | ||||||
| 1.0 | 0.6107 | 0.966 | 137.31 | 2915 | 17.11 | 0.996 |
| 1.5 | 0.6037 | 0.977 | 106.26 | 2925 | 16.62 | 0.993 |
| 2.0 | 0.5968 | 0.989 | 90.37 | 2935 | 16.13 | 0.990 |
| 2.5 | 0.5900 | 1.001 | 80.60 | 2945 | 15.63 | 0.987 |
| 3.0 | 0.5839 | 1.012 | 73.38 | 2954 | 15.18 | 0.984 |
| 3.5 | 0.5775 | 1.023 | 68.40 | 2964 | 14.69 | 0.981 |
| 4.0 | 0.5712 | 1.035 | 64.53 | 2974 | 14.20 | 0.979 |
| 4.5 | 0.5683 | 1.040 | 59.25 | 2978 | 13.97 | 0.977 |
| 5.0 | 0.5654 | 1.046 | 55.01 | 2983 | 13.75 | 0.976 |
Table 3: Various physical constants calculated from Ultrasonic velocity for terbium octanoate at different temperatures.
| Physical constants | 25°C | 30°C | 35°C | 40°C |
| CMC× 10-3(From the plots of nversus c) | 3.63 | 3.77 | 3.93 | 3.97 |
| G ×10-4(Garnsey’s constant) | 2.91 | 2.78 | 2.73 | 2.50 |
| -A ×109(From the plots ks-ks0/c versus c1/2) | 4.07 | 3.90 | 3.74 | 3.40 |
| B ×109(From the plots ks-ks0 /c versus c1/2) | 8.41 | 9.38 | 11.12 | 12.23 |
| -∅kox 106 (Guker-limiting law) | 5.05 | 5.00 | 3.10 | 3.00 |
| Sk ×106(From the plots ∅k versus √c) | 36.04 | 36.70 | 40.95 | 48.80 |
Ultrasonic velocity (ν) and adiabatic compressibility (ks) were plotted against terbium octanoate concentration c, (Figs.1 and 2). The graphs show a different behavior at a certain concentration; known as critical micelles concentration (CMC).
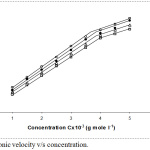 |
Figure 1: Ultrasonic velocity v/s concentration. |
The number of particles in a given region increase as density increases and leads to quick transfer of sound energy; thus ultrasonic velocity also increases. An increase in the values of ultrasonic velocity reveals the maximum association between the molecules within solution. On increasing temperature CMC value decrease. The values of G have been found from the slope of plot between ultrasonic velocities versus concentrations, G values decrease with growing temperature (Table 3).
Trend for the variation of adiabatic compressibility was opposite than the trend of ultrasonic velocity with concentration. The values of adiabatic compressibility were found decreasing with concentration at four temperatures. Higher concentration of electrolytes in solutions generally lowers the compressibility, due to greater interaction between the ions, increasing the internal pressure. However the adiabatic compressibility increases with the rise in temperature. The decrease in adiabatic compressibility after critical micellar concentration may be owing to closed packing of charged heads within the micelles; this causes increase in ionic repulsions and at last internal pressure. Adiabatic compressibility could be explained in the light of Bachem’s equation,21
Ks = kso +Ac + Bc3/2
A and B are constants. The plots between, ks-ks0 /c versus c1/2 exhibit a variation at CMC. The constants A and B had calculated from the intercepts and slopes of graph between ks-ks0/c versus c1/2, increase with rise in temperature (Table 3). The results showed that A and B values for terbium octanoate are greater than dysprosium soaps7.
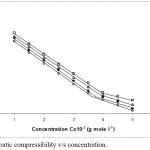 |
Figure 2: Adiabatic compressibility v/s concentration. |
The molar compressibility (W), increase by increasing concentration. However, by rising the temperature; there is decrease in molar compressibility (Table 1). The Gucker’s limiting law22 provides a relation between apparent molar compressibility (∅k)with concentration (c);
∅k = ∅k0 + Sk C1/2
Apparent molar compressibility (∅k) values vary linearly with c1/2 below the CMC at all four temperatures. The values for limiting apparent molar compressibility (∅k0) have calculated from intercepts and Sk (constant) from slopes of the graphs between ∅k versus c1/2 below CMC, and listed in Table 2. Positive values for Sk indicate that there are considerable terbium octanoate-solvent interactions below the CMC. The decline in ks and -∅k was due to fact that molecules of terbium octanoate in solutions are considerably ionized into anionic (fatty acid) and cationic parts(metal). These anions and cations are enclosed by a slight layer of solvent molecules, tightly bound and oriented towards these ions. Orientations of solvent molecules are accredited to the effect of electrostatic field of the ions and hence cause to rise in internal pressure, so decreases the compressibility of the solutions.23 Constant Sk and limiting partial molar compressibility (∅k0) found to increase by rise in temperature.
Intermolecular free length (Lf) decrease sand specific acoustic impedance (Z) increases with solute concentration. It could be explain with help of hydrophobic interactions among the solute and solvent, which enlarge the intermolecular space, leaving broader space between the molecules, then becoming the major reason of impediment to transmission of acoustic waves and ultimately affects structural arrangements. These values increase with increasing temperature (Table 2). Specific acoustic impedance, a product of density and ultrasonic velocity, had shown the opposite order than that of intermolecular free length. Thus, increasing trend of velocity, decrease in adiabatic compressibility, decrease in intermolecular free length and increasing trend of specific acoustic impedance are indicators of increasing intermolecular forces with adding of solute and developing groups of solvent nearby the solute ions.23 This supports a strong interactions between solvent and solute molecules, which cause the structural arrangement to be affected.24 The graphs between specific acoustic impedance versus concentration and intermolecular free length versus concentration indicate a break at CMC. The extrapolations of these graphs provide the values for pure solvent system and signifying that below the CMC terbium octanoate molecules do not aggregate appreciably.
Available volume (Va) decreases as concentration of terbium octanoate increases, and Va increases with rising temperature. The values of Va are in agreement with the values of Va obtained for other terbium carboxylates.25
Relative association (RA) decreases with increasing concentration. However, its values increase with the rise in temperature. The decrease in relative association could be attributed either to decrease in association among the molecules of solute and solvent at higher concentration or increase in ions solvation. The relative association increased with elevating temperature (25° to 40°C) due to decline in solvation. The number of solvent molecules around the ions in primary solvation sheaths is known as solvation number (Sn). Due to electrostriction effect, molecules in the primary sheath would be extremely compressed,but when external pressure is exerted, there would be less chances of compression in primary sheath as compare to bulk. The values of Sn show a noticeable change beyond the critical micelles concentration which could ascribe to the larger uptake of the molecules from solvent. The repulsive forces which acting among polar heads of anionic micelles decrease above critical micelles concentration.
Relaxation strength (r) declines with elevation in concentration of terbium octanoate. However, it increases with rising temperature. The graphs of relaxation strength versus concentration werecharacterized by a break at CMC. The decreasing trend of relaxation strength with concentration again supports the solute-solvent interactions.
The molar sound velocity (R) had found to rise with growing concentration. The ultrasonic parameters obtained are found to be in close harmony with the values of other literature data.25-30
Conclusion
The results obtained from ultrasonic velocity confirm that terbium octanoate behaves as weak electrolytes in binary solvent; benzene: methanol (60:40%) with considerable interaction between terbium octanoate and solvent molecules in micellization and post-micellization regions. There is no appreciable interaction between the molecules of terbium octanoate below the critical micellar concentration in mixed binary solvent system i.e. in pre-micellization region.
Acknowledgements
The authors are thankful to Principal, S. S. L. Jain College, Vidisha and Prof. H.S. Dhaliwal, Vice Chancellor, Eternal University, Himachal Pradesh, India for encouragements and necessary supports.
References
- Dijavanbakht, A.; Lang, J.; Zana, R.; Phys. Chem,1977, 81, 2630-2634.
- Gopal, K.; Rao, N.P.; Acoustic Letters, 1981, 4, 164.
- Synder, W.J.; Synder, J.R.; Chem. Eng. Data, 1974, 19, 270.
- Mehrotra, K.N.; Chauhan, M.; Shukla, R.K.; Monatshefte für Chemie, 1990, 121, 461.
- Upadhyaya, S.K.; Chem. Liq., 1993, 25, 185-199.
- Mishra,V.; Shukla, M.; Shukla, R.K.; Acta Acustica United with Acustica, 2007, 93, 738-741.
- Upadhyaya, S.K.; Chaturvedi, P.K.; Ind. Coun. Chem., 2007, 24(4), 74.
- Upadhyaya, S.K.; Kishore, K.; Walia, Y.; International J. Theoretical & Applied Sciences, 2009, 1(1), 32-37.
- Suleman, S.P.; Verghese; Prasad, F.M.; Kulshrestha, H.; Ind. Coun. Chem., 2007, 24(2), 21.
- Suleman, S.P.; Verghese; Prasad, F.M.; Indian Chem. Soc., 2008, 85, 852-856.
- Rawat, M.K.; Sharma, Y; Kumari, S.; Asian J. Chem., 2008, 20(2), 1464-1472.
- Dean, J.A.; Lange’s Handbook of Chemistry, 13th edit. McGraw Hill Book Co., 1985.
- Mehrotra, K.N.; Upadhyaya, S.K.; Colloid Polym. Sci., 1989, 267, 741-747.
- Jacobson, B.; Acta Chem. Scand., 1952, 6, 1485-1498.
- E’lpiner, I.E.; Consultant Bureau, 1964, 371.
- Schaaffs, W.; Zeitschrift für Physik, 1939, 114 (1), 110-115.
- Rao, M.R.; Indian J. Phys., 1940, 14, 109; 1941, 9, 682.
- Waissler, A.; Chem. Phys., 1947, 15, 210.
- Upadhyaya, S.K.; Nagar, R.; Acoustics Letters, 1994, 18(1), 9.
- Garnsey, R.; Boe, R. J.; Mohoney, R.; Litovitz, T.A.; Chem. Phys., 1969, 50, 5222.
- Bachem, C.; Zeitschrift für Physik, 1936, 101 (9), 541-577.
- Gucker, F.T.; Rev., 1933, 13, 111-130.
- Prakash, S.; Ichhaporia, F.M.; Pandey, J.D.; Phys. Chem., 1964, 68 (10), 3078-3080.
- Erying, H.; Kincaid, J. F.; Chem. Phys., 1932, 6, 620.
- Kishore, K.; Upadhyaya, S.K.; Tenside Surfactants Detergents, 2010, 47(3), 184-189.
- Kishore, K.; Upadhyaya, S.K.; pure & Applied Ultrasonics, 2011, 33(2), 39.
- Kishore, K.; Upadhyaya, S.K.; Portugaliae Electrochimica Acta, 2012, 30(1), 45-51.
- Kishore, K.; Upadhyaya, S.K.; Gupta, A.; Thakur, N.; Asian J. of Adv. Basic Sci., 2013, 1(1), 51-57.
- Kishore, K.; Singh, M.; Negi, S.; Pharmaceutical Sciences & Analytical Research Journal, 2018, 1 (1), 1-5.
- Sharma, K.; Negi, S.; and Kishore, K.; Journal of surface science and technology, 2019, 35(1–2), 17-25.

This work is licensed under a Creative Commons Attribution 4.0 International License.
![]()
A New Edition of Web of Science
Journal Impact Factor
2022: 0.5
Five Year: 0.8
Journal is Indexed in

Cabells Whitelist
![]()


