The Acid-Base Accounting (ABA) of Overburden Rock to Predict Acid Mine Water in Kasai Coal Mining, Indonesia
Ahmad Helman Hamdani* , Johanes Hutabaratand Agus Didit Haryanto
Faculty of Geology, University of Padjadjaran, Jalan Raya Bandung-Sumedang Km. 21 Bandung, Indonesia.
Corresponding Author E-mail: ahmad.helman@unpad.ac.id
DOI : http://dx.doi.org/10.13005/ojc/350325
Download this article as:
![]()
The Acid-Base Accounting (ABA) and TCLP methods from overburden samples collected from the coal mine in Kasai were undertaken to predict pre-mining acid mine water quality. Maximum potential acidity (MPA), acid neutralization capacity (ANC), net acid generation (NAG), net acid producing potential (NAPP) and ANC/MPA ratios were determined on the Acid-Base Accounting (ABA) protocol. Most of the samples from KS-10, KS-11 and KS-12 show the pH of NAG of overburden ranges from 5.53–7.86 negatively net acid neutralization potential (NAPP). The ANC/MPA ratio varied from 1.09–26.60 and is classified as non-acid-forming except at an interval depth of 7.00–9.00 m in KS-12, where it is classified as uncertainty. The potentially acid mine water detected in KS-39 at an interval depth of 16.00–36.00 m was classified as potential acid forming (PAF), indicated by a positive NAPP, a low ratio of ANC/MPA (below 1.0) and high dissolved metal iron.
KEYWORDS:Acid-Base Accounting; Acid Mine Water; Acid Neutralization Capacity; Net Acid Neutralization Potential
Introduction
Acid mine water (AMW) is an environmental concern for coal mining throughout the world. AMW occurs during mining processes when metal sulfides in coal and overburden rocks are exposed to oxygen and water, causing a rapid oxidizing reaction. Oxidation of metal sulfide, especially pyrite, has the potential to produce sulfate, which may turn into sulfuric acid.1 Subsequently, it may be dissolved by rain and leaching to acid mine water. AMW can also cause heavy metal leaching from coal or waste disposal. Consequently, some toxic metals (e.g., lead, zinc, copper, arsenic, selenium, mercury and cadmium) may contaminate runoff and groundwater. Other metals, like sulfide minerals (pyrite, pyrrhotite, marcasite, arsenopyrite and enargite), which are often found in coal deposits, can be a source of an acidic mine. The coal and overburden layers will release metals to contaminate the environment surrounding the coal mine.
The processes of acid formation and metal precipitation have taken place together during the formation of AMW, which is closely related to the oxidation of pyrite and precipitation of Fe hydroxides (Fe (OH)3). The acid mine water formation from pyrite can occur by three chemical reactions, as follows:
FeS2 + 3.75O2 + 3.5H2O ⇋ Fe(OH)3 + 2SO42- + 4H+ (1)
2 CaCO3 + 2H2SO4 ⇋ 2 Ca2+ + 2H2O + 2CO2(g) +2 SO4 2- (2)
FeS2 +2 CaCO3 + 3.75O2+ 1.5H2O ⇋ Fe(OH)3 + 2SO42- + 2Ca2+ + 2CO2 (3)
Reaction (1) is an acid-forming reaction which indicates how the important oxidant of pyrite is oxygen. This reaction is produced when ferrous iron and sulfur are oxidized into sulfates. Reaction (2) is an acid-neutralizing reaction by adding carbonate minerals such as CaCO3. Reaction (3) is a reaction where the acid-generating potential (reaction 1) is balanced by the acid-neutralizing potential (reaction 2).
One of the important processes when planning a mine is predicting of the potential acid mine water, which can have an impact on the economic value of the mine. The acid mine water can be predicted qualitatively and quantitatively by studying geological factors, such as mineral composition, stratigraphy and hydrogeology.1-5
There are two types of tests for determining the risk of acid water formation and metal mobility in mining activities: the static test and the kinetic test. In this paper, the static test is stressed as a subject of research. It consists of a single test or a set of chemistry tests performed on mining overburden at a single time. The static test can be divided into two types of tests: (1) ABA (Acid-Base Accounting) and (2) static leaching test.
Acid-Base Accounting (ABA)
The ABA is a method to predict the potential of mine acid formation of mine acid produced by various geological materials. This method was introduced by Dr Richard M. Smith and his colleagues from West Virginia University in the late 1960s. The ABA protocol was further enhanced and progressed into an internationally recognized standard method. This method identifies acid- and alkaline-producing materials in the overburden. The ABA is claimed as the first technology available to predict the quantity of acid-producing materials prior to mining. With the enactment of the Surface Mining Control and Reclamation Act of 1977 (SMCRA) in the USA, ABA in 1977 and the 8th International Conference on Acid Rock Drainage, International Network for Acid Prevention, June 2009, Skelleftea, Sweden, ABA has become widely adopted as a method to predict post-mining drainage quality through overburden chemistry analysis.6,7
ABA tests quantify the balance net acid producing potential (NAPP) between potentially acid-generating potential (MPA), particularly the oxidation of sulfide materials, and acid neutralizing capacity (ANC) in a sample, such as the dissolution of alkaline, carbonates, displacement of exchangeable bases and weathering of silicate.8,9 The ABA parameters are described below:
MPA (maximum potential acidity) is defined as the maximum amount of acid that can be produced from the oxidation of sulfur-containing minerals in a rock sample. The MPA was measured and calculated from the total sulfur content. According to the stoichiometry and molar mass of components in reaction 1, the maximum amount of acid that could be produced by a sample containing 1% S as pyrite would be 30.6 kilograms of H2SO4 per ton of material. The MPA is calculated from the total sulfur content as: wt% total sulphur x 30.6 (kg H2SO4/t).
ANC (acid neutralizing capacity) is calculated from the amount of acid neutralizes in the samples based on wet chemical titration.
ANC = [Y x MHCl /wt] C
Where: Y = (Vol of HCl added) – (Vol of NAOH titrated x B).
B = (Vol of HCl in Blank)/ (Vol of Na OH titrated in Blank).
MHCl = Molarity of HCl.
wt = sample weight in grams.
C = Conversion factor (C = 49.0 to calculate kg H2SO4/t).
NAPP (net acid producing potential); NAPP = MPA – ANC.
The net acid generation (NAG) test is a direct test to determine the ability of the samples to produce acid via sulfide oxidation.
The ANC/MPA ratio is a tool to assess the safety margin of overburden materials. A lower ANC/MPA suggests a high tendency of materials in acidic conditions (low pH). This can raise environmental problems caused by acid mine water.
Many scholars have predicted the quality of pre-mining and post-mining coal water drainage using overburden rock chemical data. The ABA parameter was found to be the best indicator of post-mining drainage quality.10-15 Overall, the ABA methods provide a plethora of data and more in-depth quantification of the acid generation potential and potential acidity components of the sample.
Metal Dissolution Test by TCLP
The presence of acid mine water can also dissolve harmful metal compounds and toxic substances such as mercury, lead, cadmium, arsenic and others contained in the overburden rock samples, thereby increasing the number of metal ions dissolved in water. The dissolution of these metal ions is dangerous for life in this water. To ascertain the potential for acidic water determined by the ABA method we also conducted hazardous metal dissolution concentration by TCLP analysis (Toxic Characteristic Leaching Procedures). The TCLP is designed to determine the mobility of both organic and non-organic analyses present in liquid, solid, and multiphasic waste.
Methods and Sampling
Site Description
The Kasai coal mine is situated 20 km southeast of Tanjung Redeb, the capital city of Berau Regency. Geologically it is situated in Berau Basin. Geologically, two coal-bearing formations can be identified in the basin: Middle to Late Miocene from the Lati Formation and Pliocene to Pleistocene from the Sajau Formation. The ABA analysis is only performed on the overburden rock of the Sajau Formation, which is dominated by claystone. The mine should commence operations in December 2018. Proposed mine production is for a 5-year mine life with a potential acid mining water influence area of approximately 50 ha.
Samples Sampling
The sampling for ABA evaluation of acid generation has been taken from three (3) coal drill holes in Kasai coal mine (drill holes KS-10, KS-11, KS-12 and KS-39) and were drilled in January 2017, prior to mining exploration. The number of samples for ABA evaluation is 49 (Table 1). The coal and carbonaceous clay were not analysed because of their potentially acid-producing rocks.
Table 1: List of Drill Hole samples for ABA Evaluation.
| Drill Hole | Depth | Coal | Overburden Rock | ||
| (m) | Depth (m) | Thickness (m) | Amount | Interval Depth (m) | |
| KS-10 | 30 | 20.00 – 26.00 | 6 | 13 | 1.00 – 19.50 |
| 26.10 -30.00 | |||||
| KS-11 | 30 | 21.00 – 26.00 | 5 | 10 | 4.00 – 21.00 |
| 25.80 – 29.00 | |||||
| KS-12 | 25 | 17.00 -23.20 | 6.2 | 13 | 1.20 – 16.70 |
| 23.40 – 24.9 | |||||
| KS-39 | 36 | 19.80 – 25.90 | 6.1 | 13 | 1.00 – 19.70 |
| 27.50– 25.80 | |||||
Experimental
Acid-Base Accounting (ABA) method
A, MPA (The Maximum Potential Acidity)
The total sulfur was determined by LECO Apparatus.
The sample is combusted in an O2 atmosphere at 1370° C (V2O5 catalyst) to oxidize sulfide and SO4 to SO2.
The S content is measured by a calibrated solid state infrared detector.
MPA is determined by multiplying the total sulfur content by 30.6.
ANC (Acid Neutralizing Capacity; Titration Method)
1 gram of pulverised sample was weighed, and two blanks were made.
Approximately 50 ml of deionised water and 25 ml of standardised 0.1 M HCl was added to all samples
The samples were placed in a hot steam bath to boil and heated to 80 to 90°C, swirling the beaker occasionally for 1 to 2 hours, or until the reaction was complete (indicated by no gas evolution and the particles have settled evenly over the bottom of the flask) and then cooled to room temperature.
pH was checked to see if the sample was acidic (pH<3). If the pH was equal or >3, a further 25 ml of 0.1 M HCl was added until the p<3.
Titrate against standardised sodium hydroxide (NaOH) solution. Samples were titrated to a pH of 7 using standardised 0.1 M NaOH.
NAG (Net Acid Generation)
The large sample was crushed to nominal 4 mm. Then a representative sub-sample was taken. The sub-sample should then be pulverised to approximately 200 mesh (<75μm).
Approximately 2.5 grams of pulverised sample is placed in a 500 ml conical beaker.
Add 250 ml 15 vol. H2O2 (30% H2O2 diluted 1:1 with deionised or distilled water) and put a watch glass on top of the beaker. Place the beaker in a fume hood or well-ventilated area.
Put the beaker on a hot plate and gently heat the sample until effervescence stops, or for a minimum of 2 hours. Place the beaker at room temperature to cool.
Use deionised water to rinse any sample that has been attached to the side of the flask and add deionised water until it reaches the final volume of 250 mL.
Measure the pH of the solution. This pH measurement is referred to as the NAGpH.
Measure NAG acidity in kgH2SO4/t by back titration of the NAG liquor only for pH <4.5 with 0.50 M NaOH.
Paste pH
To determine the paste pH, samples were prepared for mixing by adding the deionised water and measuring the pH after one hour.16
To make the slurry, mix the sample with the water at approximately 1:10 ((1g Sample : 10mℓ de-ionized water)) on the glass.
Allow the slurry to stand for at least 24 hours (or overnight).
Measure the pH directly on the slurry.
Based on the paste pH values, the overburden samples can be classified.17-20 Paste pH values of less than 4.0 are classified as acid producing, with high stored acid salt. Paste pH values of 4.0-6.0 are also acid producing, but with less acidic salt content than a sample with a paste pH less than 4.0. Samples with a paste pH of more than 6.0 are non-acid forming.
Total Sulfur (TS)
Measurements of total sulfur are done by burning at a high temperature (high-temperature combustion) in the LECO Furnace S-144 DR device. Total sulfur is stated as a percent of the total weight of the declared content of total sulfur in the samples. The total sulfur measurement is based on American Society for Testing and Materials (ASTM) D. 4239-14 & ISO 11722 Solid Mineral Fuels-Hard Coal Determination of Moisture in the general analysis test sample by drying in nitrogen.
Metal Dissolution Test by TLCP (toxic Characteristic Leaching Procedures)
The TCLP analysis begins by determining the number of solids in the sample. Total samples for the TLCP test is eight (8) samples. The solid phase sample will undergo treatment to make sure every particle is <10 mm. After that, an appropriate extraction fluid is determined by the pH testing procedures stated in USEPA method 1311 with revised USEPA 2004.21 The sample is then extracted with an amount of TCLP extraction fluid equal to 20 times the weight of the solid phase for 16-20 hours on an agitation tumbler. After extraction, the TCLP extract is separated from the solid phase by filtering through a 0.6-micron filter. Finally, the TCLP extract is combined with any liquid from the initial separation, and the sample is ready for analysis of TCLP metals using ICPMS.
Classification
The classifications used in the ABA evaluation based on the Indonesia National Standard ( SNI) 6597-201122 (Table 2). All the classification were based on NAPP and pH NAG data.
Table 2: The Indonesian National Standard (SNI 6597-2011) of Rock Type.
| Type | Rock Type | pH NAG | NAG | NAPP | pH Rock |
| Type 1 | NAF | > 4.5 | < 0 | ||
| Type 2 | Low Capacity PAF | < 4.5 | < 5 | 0 – 10 | |
| Type 3 | Moderately Capacity PAF | < 4.5 | > 5 | > 10 | |
| Type 4 | High Capacity PAF | < 4.5 | > 5 | > 10 | < 4,5 |
Result and Discussion
The Acid-Base Accounting (ABA) test results are presented in Table 3. Static test results in Table 1 are listed with minimum, average and maximum values for each overburden rock. In addition, minimum, average, and maximum values for all samples are summarized at the bottom of Table 1. The results of the static tests indicate a natural variability in the geochemical characteristics of overburden materials that will be encountered during open pit mining of the Kasai coal deposit.
Table 3: ABA Test Results for Overburden Rock.
| ID | Depth | Paste | NAG | NAG | Total | MPA | ANC kgH2SO4/t | NAPP | ANC/ |
Class/ |
|||||||||
| No | (M) | pH | pH | kgH2SO4/t | Sulfur (%) | kgH2SO4/t | kgH2SO4/t | MPA |
Type |
||||||||||
| Drill Hole KS-10 | |||||||||||||||||||
| KS-01 | 0.00-1.00 | 5.06 | 6.19 | ND | 0.015 | 0.47 | 4.11 | -3.64 | 8.74 | NAF/1 | |||||||||
| KS-02 | 1.00-2.00 | 4.96 | 6.19 | ND | 0.051 | 1.57 | 7.73 | -6.16 | 4.92 | NAF/1 | |||||||||
| KS-03 | 2.00-4.00 | 4.57 | 6.09 | ND | 0.007 | 0.2 | 5.32 | -5.12 | 26.6 | NAF/1 | |||||||||
| KS-04 | 4.00-6.00 | 4.45 | 6.14 | ND | 0.008 | 0.26 | 5.8 | -5.54 | 22.31 | NAF/1 | |||||||||
| KS-05 | 6.00-9.00 | 4.47 | 6.07 | ND | 0.011 | 0.33 | 6.04 | -5.71 | 18.3 | NAF/1 | |||||||||
| KS-06 | 9.00-12.00 | 4.18 | 6.01 | ND | 0.012 | 0.36 | 4.83 | -4.48 | 13.42 | NAF/1 | |||||||||
| KS-07 | 12.00-14.00 | 4.83 | 6.25 | ND | 0.019 | 0.58 | 4.35 | -3.77 | 7.5 | NAF/1 | |||||||||
| KS-08 | 14.00-16.00 | 4.68 | 6.48 | ND | 0.038 | 1.17 | 5.44 | -4.26 | 4.65 | NAF/1 | |||||||||
| KS-09 | 16.00-18-00 | 5.75 | 6.52 | ND | 0.014 | 0.44 | 4.47 | -4.03 | 10.16 | NAF/1 | |||||||||
| KS-10 | 18.00-20.00 | 4.97 | 6.62 | ND | 0.017 | 0.52 | 3.87 | -3.34 | 7.44 | NAF/1 | |||||||||
| KS-11 | 19.19-19.75 | 4.86 | 7.17 | ND | 0.011 | 0.34 | 3.87 | -3.53 | 11.38 | NAF/1 | |||||||||
| KS-12 | 26.20-27.70 | 4.99 | 7.17 | ND | 0.008 | 0.23 | 5.07 | -4.85 | 22.04 | NAF/1 | |||||||||
| KS-13 | 27.70-30.00 | 4.56 | 6.85 | ND | 0.011 | 0.32 | 5.2 | -4.87 | 16.25 | NAF/1 | |||||||||
| Minimum | 4.18 | 6,01 | 0,007 | 0,20 | 3,87 | -6,16 | 4,65 | ||||||||||||
| Average | 4.79 | 6,44 | 0,017 | 0,52 | 5,09 | -4,56 | 13,36 | ||||||||||||
| Maximum | 5,75 | 7,17 | 0,051 | 1,57 | 6,04 | -3,34 | 26,6 | ||||||||||||
| Drill Hole KS-11 | |||||||||||||||||||
| H-01 | 0.00-1.00 | 4.91 | 6.18 | ND | 0.009 | 0.3 | 4.59 | -4.29 | 15,30 | NAF/1 | |||||||||
| H-02 | 2.00-4.00 | 4.51 | 6.13 | ND | 0.006 | 0.19 | 4.35 | -4.16 | 22,89 | NAF/1 | |||||||||
| H-03 | 4.00-6.50 | 4.59 | 6.21 | ND | 0.013 | 0.39 | 6.04 | -5.65 | 15,49 | NAF/1 | |||||||||
| HS-04 | 6.50-9.00 | 4.58 | 6.15 | ND | 0.007 | 0.22 | 7.97 | -7.75 | 36,23 | NAF/1 | |||||||||
| HS-05 | 9.00-10.00 | 4.59 | 6.18 | ND | 0.007 | 0.22 | 7.49 | -7.27 | 34,05 | NAF/1 | |||||||||
| HS-06 | 10.00-12.00 | 4.43 | 6.18 | ND | 0.008 | 0.24 | 5.08 | -4.83 | 21,17 | NAF/1 | |||||||||
| HS-07 | 12.00-15.00 | 4.72 | 6.84 | ND | 0.011 | 0.32 | 4.35 | -4.02 | 13,59 | NAF/1 | |||||||||
| HS-08 | 15.00-18.00 | 4.59 | 6.04 | ND | 0.011 | 0.32 | 3.74 | -3.42 | 11,69 | NAF/1 | |||||||||
| HS-09 | 18.00-21.00 | 4.57 | 6.16 | ND | 0.075 | 0.23 | 4.83 | -4.6 | 21,00 | NAF/1 | |||||||||
| HS-10 | 25.80-29.00 | 4.82 | 7.86 | ND | 0.085 | 0.26 | 4,73 | -4.47 | 18.19 | NAF/1 | |||||||||
| Minimum | 4.43 | 5.84 | 0.006 | 0.19 | 3.74 | -7.75 | 11.69 | ||||||||||||
| Average | 4.53 | 6.29 | 0.009 | 0.27 | 5.32 | -5.06 | 20.99 | ||||||||||||
| Maximum | 4.91 | 7.86 | 0.013 | 0.39 | 7.97 | -3.42 | 36.23 | ||||||||||||
| Drill Hole KS-12 | |||||||||||||||||||
| AB-01 | 0.00-1.00 | 4.86 | 6.63 | ND | 0.01 | 0.31 | 3.26 | -2.95 | 10,52 | NAF/1 | |||||||||
| AB-02 | 1.00-3.00 | 4.68 | 6.12 | ND | 0.01 | 0.31 | 6.04 | -5.73 | 19,48 | NAF/1 | |||||||||
| AB-03 | 3.00-5.00 | 4.35 | 6.21 | ND | 0.015 | 0.47 | 6.04 | -5.57 | 12,85 | NAF/1 | |||||||||
| AB-04 | 5.00-7.00 | 4.56 | 6.78 | ND | 0.133 | 4.07 | 5.56 | -1.49 | 1,37 | NAF/1 | |||||||||
| AB-05 | 7.00-9.00 | 4.41 | 6.53 | ND | 0.152 | 4.65 | 6.28 | 1.63 | 1.35 | UC/1 | |||||||||
| AB-06 | 9.00-11.00 | 4.54 | 6.44 | ND | 0.069 | 2.11 | 2.3 | -0.19 | 1,09 | NAF/1 | |||||||||
| AB-07 | 11.00-13.00 | 5.75 | 6.48 | ND | 0.026 | 0.8 | 2.42 | -1.62 | 4,28 | NAF/1 | |||||||||
| AB-08 | 13.00-15.00 | 5.68 | 6.44 | ND | 0.018 | 0.56 | 2.42 | -1.86 | 4,32 | NAF/1 | |||||||||
| AB-09 | 15.00-17.00 | 5.58 | 7.07 | ND | 0.019 | 0.61 | 5.8 | -5.19 | 9,51 | NAF/1 | |||||||||
| AB-10 | 23.40-24.90 | 4.07 | 7.99 | ND | 0.008 | 0.25 | 6.53 | -6.82 | 26,12 | NAF/1 | |||||||||
| Minimum | 4.07 | 6.12 | 0.008 | 0.25 | 2.3 | -6.28 | 1.09 | ||||||||||||
| Average | 4.85 | 6.67 | 0.043 | 1.41 | 4.67 | -3.58 | 9.95 | ||||||||||||
| Maximum | 5.75 | 7.99 | 0.152 | 4.65 | 6.53 | -0.19 | 26.12 | ||||||||||||
| Drill Hole KS-39 | |||||||||||||||||||
| AA-01 | 0.00-1.00 | 4.28 | 6.97 | ND | 0.006 | 0.18 | 2.66 | -2.48 | 14.78 | NAF/1 | |||||||||
| AA-02 | 1.00-3.50 | 4.39 | 6.96 | ND | 0.012 | 0.36 | 5.56 | -5.21 | 15.44 | NAF/1 | |||||||||
| AA-03 | 3.50-6.00 | 4.55 | 6.4 | ND | 0.011 | 0.34 | 3.62 | -3.28 | 10.65 | NAF/1 | |||||||||
| AA-04 | 6.00-9.00 | 4.24 | 6.25 | ND | 0.238 | 7,27 | 3.86 | 3.41 | 0.53 | UC/1 | |||||||||
| AA-05 | 9.00-12.00 | 4.51 | 6.98 | ND | 0,235 | 7.18 | 3.39 | 3.8 | 0.46 | UC/1 | |||||||||
| AA-06 | 12.00-14.00 | 4.6 | 6.37 | ND | 0.072 | 2.2 | 3.26 | -1,06 | 1.48 | NAF/1 | |||||||||
| AA-07 | 14.00-16.00 | 4.81 | 6.69 | ND | 0.085 | 2.6 | 3.87 | -2,27 | 1.49 | NAF/1 | |||||||||
| AA-08 | 16.00-18.00 | 3.15 | 3.44 | 0.27 | 0.303 | 9.26 | 0.97 | 8.29 | 0.1 | LC-PAF/2 | |||||||||
| AA-09 | 18.00-19.70 | 3.14 | 3.2 | 0.67 | 0.368 | 11.25 | 3.63 | 7.62 | 0.32 | LC-PAF/2 | |||||||||
| AA-10 | 25.75-27.00 | 3.03 | 3.63 | 2.16 | 0.47 | 14.38 | 2.63 | 11.75 | 0,18 | MC-PAF/4 | |||||||||
| AA-11 | 27.00-30.00 | 3.02 | 3.07 | 3.46 | 0.631 | 19.3 | 7.91 | 11.33 | 0.41 | MC-PAF/4 | |||||||||
| AA-12 | 30.00-33.00 | 2.99 | 3.05 | 3.56 | 0.668 | 20.43 | 3.14 | 17.29 | 0.15 | MC-PAF/4 | |||||||||
| AA-13 | 33.00-36.00 | 3 | 3.15 | 2.97 | 0.655 | 20.03 | 5.56 | 14.48 | 0.28 | MC-PAF/4 | |||||||||
| Minimum | 2.99 | 3.05 | 0.27 | 0.006 | 0.18 | 0.97 | -2.27 | 0.1 | |||||||||||
| Average | 4.5 | 4.78 | 2.18 | 0.339 | 11.39 | 3.82 | -1.87 | 0.54 | |||||||||||
| Maximum | 5.75 | 6.98 | 3.56 | 0.668 | 20.43 | 7.91 | -1.06 | 15.44 | |||||||||||
|
All sample |
Minimum | 2.99 | 3.05 | 0.27 | 0.006 | 0.18 | 0.97 | -7.75 | 0.1 | ||||||||||
| Average | 3.82 | 6.12 | 2.18 | 0.098 | 3.01 | 4.7 | -4.16 | 11.55 | |||||||||||
| Maximum | 4.81 | 7.99 | 3.56 | 0.668 | 20.43 | 7.97 | -0.19 | 36.23 | |||||||||||
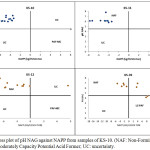 |
Figure 1: Cross plot of pH NAG against NAPP from samples of KS-10. (NAF: Non-Forming Acid; PAF-MC: Moderately Capacity Potential Acid Former; UC: uncertainty. |
Toxic Characteristic Leaching Procedures
Eight (8) overburden samples were measured for metal concentration from four drill holes (Table 4 and Figure 2); as follow:
Table 4: Metal Concentration in overburden samples.
| Drill Hole | Depth | Interval | Total Metal (mg/L) | |||||||
| (m) | Depth (m) | Cu | Zn | Mg | Ca | Fe | Mn | Pb | Ni | |
| KS-10 | 30 | 1.00 – 19.50 | < 0,01 | 0,11 | 0,47 | 0,23 | 0,60 | <0,05 | 0,04 | 0,01 |
| 26.10 -30.00 | 0,02 | 0,14 | 0,44 | 0,28 | 0,22 | 0,01 | 0,01 | 0,04 | ||
| KS-11 | 30 | 4.00 – 21.00 | 0,14 | 0,33 | 2,08 | 0,28 | 0,41 | 0,05 | 0,02 | 0,01 |
| 25.80 – 29.00 | 0,07 | 0,15 | 0,63 | 0,74 | 0,31 | 0,01 | 0,01 | <0,01 | ||
| KS-12 | 25 | 1.20 – 16.70 | 0.01 | 0.48 | 0,51 | 0.51 | 2.42 | 0.01 | 0.02 | 0.01 |
| 23.40 – 24.90 | <0.01 | 0.21 | 0.32 | 0.42 | 0.42 | <0.01 | 0.01 | <0.01 | ||
| KS-39 | 36 | 18.00 – 19.70 | 0.01 | 0.01 | 7.73 | 2.18 | 12.52 | <0.05 | 0.03 | 0.04 |
| 33.00 – 36.00 | <0.01 | 0.47 | 2.7 | 1.37 | 7.34 | 0.01 | 0.01 | 0.01 | ||
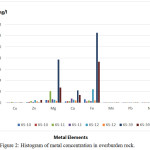 |
Figure 2: Histogram of metal concentration in overburden rock. |
Discussion
Drill Hole KS-10
Based on the SNI standard of rock classification, all the overburden rocks in KSD-10 were classified as Type 1. Type 1 is a rock type that will not form acid mine when exposed to water and air (oxygen). It is also supported by the ratio of ANC/MPA in all samples with a much larger value than 2 (Table 4). A large ANC/MPA ratio indicates that the material has the high potential to neutralize the acid, whereas the rock has a pH close to neutral and acid mine water problems will not occur. In addition, it is supported by the results of the metal dissolution analysis (samples from the location of KS-10 by the TCLP method showed low dissolved iron metal (0.6 g/L), while the calcium and magnesium metal content were 0.23 g/L and 0.47 g/L respectively (Figure 2). When calculated, the total equivalent mole of calcium and magnesium is greater than the dissolved iron, so the acid formed will be neutralized. Thus, this rock will be safe during the mining process and does not need special handling for the prevention of acid formation.
Drill Hole KS-11
No different from the ABA data from KS-10 wells, ABA measurements in KS-11 show that all samples can be categorized as NAF (Figure 1), or by SNI classification categorized as type 1. The ratio of ANC/MPA is a high value (> 2.00), indicating that overburden rocks have no potential to produce acid mine.
Drill Hole KS-12
The results of the ABA analysis by determining pH paste, pH NAG, MPA, ANC and PPAN at drill hole KS-12 is listed in Table 4. The rock classification based on the relationship between pH NAG and NAPP is shown in Figure 1. Based on the rock classification referring to SNI-6597-2011, mostly rock samples were classified as NAF/Type 1, except the sample AB-05, which was classified as UC (uncertainty). The rock samples (AB-05) with NAPP value 8.99 kg/t H2SO4 and the low ANC/MPA value (0.43) and have a pH value of NAG more than 5.00. Therefore, the sample has a tendency to generate acidic water problems. Three samples of AB-04, AB-05 and AB-06 have an ANC/MPA ratio between 1.00 and 2.00, which means that the samples can generate either alkaline or acidic water. Thus, for three samples (AB-04, AB-05 and AB-07) with a total thickness of 6 m, special handling is required in the coal mining process so that the environmental conditions are well preserved to prevent the formation of acid mine.
D. Drill Hole KS-39
The results of ABA analysis through the determination of pH paste, pH NAG, MPA, ANC, and NAPP is listed in Table 2. In general, the geochemical classification based on the plotting pH NAG and NAPP at the location of KS-39 (Figure 1) shows the presence of uncertainty (UC) in 2 samples, PAF in 6 samples, and the rest, including the NAF group (5 samples). The rock classification refers to SNI-6597-2011 and indicates the presence of Type 1, Type 2 and Type 4.
As described above, the overburden rocks were categorized as Type 1, Type 2 and Type 4. The upper part of the rock samples were classified as Type 1, which is a rock type that cannot form mine acid when exposed to water and air (oxygen) and is also supported by an ANC/MPA ratio greater than 2, as shown in the sample of AA-01 to AA03 and AA-06 to AA-07. Two samples of AA-04 and AA-05 were classified as type 1 with an ANC/MPA ratio less than 2 (Table 4) and categorized as UC (uncertainty). The samples of AA-09 to AA-13 have a pH NAG value of less than 4.5 and a positive NAPP and are classified as PAF. These samples also have a lower ANC/MPA ratio (below 1.00), which indicates that their rock has a potential to produce highly acidic mine water. Therefore, special handling is needed to prevent the formation of acid mine. The results of metal dissolution analysis (samples from the location of KS-39 at interval 18.00-19.30 and 30.00-33.10 by TCLP method as seen in Table 4) showed high dissolved iron metal at 12.52 g/L and 7.34 g/L respectively (Figure 2). The high content of iron metal should be a source of the mine acid water.
Conclusion
The overburden rocks in drill holes KS-10, KS-11 and KS-12 generally indicated no potential for acid mine (NAF, Type 1) and are safe during mining and overburden removal, even though at KS-12 sites there is a UC layer with a high potential to generate acid mine water. Around the location of KS-39, overburden rocks are PAF (potentially producing acidic mine water), so special handling is required both at the mine and post-mine. The presence of high-capacity PAF material layers in the top layer will cause the puddle water to be very acidic, so at the mine-closed stages the pit should be backfilled again.
Acknowledgements
The authors acknowledge and are grateful for financial support from Academic Leadership Grant No. 855/UN6.3.1/PL/2017, Universitas Padjadjaran, Bandung, Indonesia. We extend our gratitude to anonymous reviewers for their thoughtful reviews of this manuscript.
References
- Weisener C; Weber P. Preferential oxidation of pyrite as a function of morphology and relict texture. New Zealand Journal of Geology and Geophysics. 2010, 53, 167-177.
- Craw D; Mulliner T; Haffert L; Paulsen HK; Peake B; Pope J. Stratigraphic controls on water quality at coal mines in Southern New Zealand, New Zealand Journal of Geology and Geophysics, 2008, 51, 59-72
- Parbhakar F; Edraki A. K; Walters M. S; and Bradswa, D. 2011. Development of a Textural Index for the Prediction of Acid Rock Drainage. Minerals Engineering, 2011. 24 (10), 1277-1287.
- Brough, C. P; Warrender, R; Bowell, R.J; Barnes, A. and Parbhakar F. The process mineralogy of mine wastes, Minerals Engineering, 2013, 52, 125 – 135.
- Pope J, Weber P, Mackenzie A, Newman N and Rait R. Correlation of acid base accounting characteristics with the Geology of commonly mined coal measures, West Coast and Southland, New Zealand. New Zealand Journal of Geology and Geophysics, 2010. 53, 153-166
- Kaartinen T; Wahlstrom M; Development of a European standard for the determination of acid potential and neutralization potential of sulfide waste. 8th International Conference on Acid Rock Drainage. 2009, 6.
- Bucknam C. H; White W; Lapakko K. Standardisation of mine waste characterization methods by ADTI-MMS. 8th International Conference on Acid Rock Drainage. 2009, 12.
- Louis de Wet. Acid Base Accounting of Mining Ore and Waste. Test and Measurement Conference. 2012, 42.
- Changul C.; Sutthirat C.; Padmanahban G. and Tongcumpou C. Assessing the acidic potential of waste rock in the Akara gold mining, Thailand, Journal of Environmental Earth Science, 2010, 60, 1065-1071.
- Philip, L. H; Robert, R. S; Sharon, F. D; Nadine M. P; Heather, A. L. Evaluation of selected static methods used to estimate element mobility, acid-generating and acid-neutralizing potentials associated with geologically diverse mining wastes. Applied Geochemistry. 2015, 57, 125–139
- Paul,. A. W; Olds, W. E; Crombie, F. H; Thomas, D. G; Pope, J; and Pizey, M. H, Acid mine drainage investigations at the Reddale Coal Mine, Reefton, New Zealand. AusIMM New Zealand Branch Annual Conference. 2013. 535-545
- Suthirat C. Geochemical application for environment monitoring and metal mining management. Environmental Monitoring. 2015, 91-108.
- Price W. A. Acid base accounting criteria used in prediction of drainage chemistry. Mine Water and Innovative Thinking. 2010, 55-58.
- Cravotta III CA. Dissolved metals and associated constituents in abandoned coal-mine discharges, Pensnsylvania. USA. Part I; Constituent quantities and correlation. Applied Geochemistry, 2008, 23, 166-202.
- Bester M. and Vermeulen P. D. Investigation of potential water quality and quantity impacts associated with mining of the shallow Water berg coal reserves, west of the Daarby Fault, Limpopo Province. South Africa. Water SA. 2010. 36, 531-542.
- Louis de Wet. Acid Nase Accounting of Mining Ore and Waste. Test & Measurement Conference. 2012. 44 p
- Chotpantarat S. A Review of Static Tests and Recent Studies. American Journal of Applied Sciences. 2011. 8: 400-406.
- Nugraha C, Shimada H, Sasaoka T, Ichinose M and Matsui K. Waste rock characteristics at tropical coal mine area: A case study of PT. Kaltim Prima Coal, Indonesia. Int. J. JCRM. 2009, 5, 77-82.
- Philip L. H, Robert R. S, Sharon F. D, Nadine M. P, Heather A. L. Evaluation of selected static methods used to estimate element mobility, acid-generating and acid-neutralizing potentials associated with geologically diverse mining wastes. Applied Geochemistry. 2015, 57, 125–139.
- Weber P. A, Olds W. E, Crombie F. H, Thomas D. G, Pope J and Pizey M. H. Acid mine drainage investigations at the Reddale Coal Mine, Reefton, New Zealand. AusIMM New Zealand Branch Annual Conference. 2013, 535-545.
- U.S. Environmental Protection Agency (USEPA), 2004. Test Methods for Evaluating Solid Wastes, Physical/Chemical Methods, (SW-846), revision 6, November, 2004.
- SNI 6597: Uji Static Pengidentifikasian Sumber Air Asam Tambang. 2011.
Accepted on: 10-05-2019


![]()


