Synthesis and Evaluation of Cytotoxicity Effect of New Ligand (LBe) and it's Complexes on a Cervical Cancer
Reham Faek Hameed, Areej Ali Jarullah* and Fadhil Lafta Faraj
Department of Chemistry, Faculty of Sciences, University of Diyala, Diyala Governorate, Iraq.
Corresponding Author E-mail: Aroo977@gmail.com
DOI : http://dx.doi.org/10.13005/ojc/350342
Article Received on : 27-05-2019
Article Accepted on : 15-06-2019
Article Published : 29 Jun 2019
In this research, new ligand (LBe) 2-(1,1-dimethyl-1,3-dihydro-2H-benzo[e] indol-2-ylidene) propane-1,3-diylidene) bis(azanylylidene) diphenol was synthesized by the condensation reaction of 2-hydoxy aniline with 2-(1,1-dimethyl-1,3-dihydro-2H-benzo[e]indol-2-ylidene) malonaldehyde (Be) in ratio 2:1. (LBe) was used as ligand to synthesis a series of metal complexes by its reaction with different metal chlorides in a molar ratio 1:1 and 1:2 of M:L in ethanol such as (NiCl2.6H2O, CuCl2.2H2O, CoCl2.6H2O, MnCl2.4H2O and ZnCl2). The chemical structures of the ligand and its complexes were characterized by 1H-NMR spectroscopy, infrared spectroscopy, ultra violet-visible spectroscopy, magnetic susceptibility, and molar conductivity measurements. According to the results obtained the suggested structures of the complexes, Square planar geometry for [Co(LBe)], [Ni(LBe)], [Cu(LBe)], octahedral geometry for [Mn(LBe)] and tetrahedral geometry for [Zn(LBe)2]. Cytotoxicity effect of ligand LBe and its complexes have been evaluated against Hella cell line (cervical cancer) in two exposure times 24 and 48 hrs.
KEYWORDS:Hella Cell Line; 2-Hydoxy Aniline; LBe Ligand, Metal Complexes
Download this article as:| Copy the following to cite this article: Hameed R. F, Jarullah A. A, Faraj F. L. Synthesis and Evaluation of Cytotoxicity Effect of New Ligand (LBe) and it's Complexes on a Cervical Cancer. Orient J Chem 2019;35(3). |
| Copy the following to cite this URL: Hameed R. F, Jarullah A. A, Faraj F. L. Synthesis and Evaluation of Cytotoxicity Effect of New Ligand (LBe) and it's Complexes on a Cervical Cancer. Orient J Chem 2019;35(3). Available from: https://bit.ly/2Ly7CZV |
Introduction
Indole ring is an aromatic heterocyclic compound.1 A heterocyclic compound is one which possesses a cyclic structure with at least two various kinds of hetro atoms in the ring. Oxygen, nitrogenand sulfur are the most widespread hetrocyclic compounds are very vastly distributed in nature and are essential to life in different ways.2 and3 In general, Schiff bases form through the reaction of a primary amine and ketone or aldehyde with removal of water molecule in convenient solvent.4-6 Schiff bases have been known by various names such as azomethines, imines, and anils. Broadly, the Schiff bases that have been derived from aldehydes are named aldimine and from ketones are ketamine.7 and8 In Schiff base azomethane nitrogen and other donor atoms like oxygen play a major role in coordination chemistry.9 Schiff bases are beneficial chelates because of their ease of preparation, structural varieties, assorted densities and subtle steric and electronic control on their framework.10 In industry, Schiff bases were used as corrosion inhibitors, rubber accelerators, and antioxidants, also used as plasticizers, and stabilizers for polymers, polymerization, initiators, antioxidants… etc.11 and.12 The transition metal one of the more interesting aspects to form coordination compounds.13 The coordination compound are of huge interest, because metal ions found in the active sites of a large number of metalloproteins such as, hemocyanin, and in metalloenzymes like in tyrosinase, ureases, lactase and ascorbateoxidase. These proteins are contributory in the various biological processes such as biological electron-transfer reaction, oxygen atom insertion into substrates, dioxygen reduction to hydrogen peroxide or water and hydrolytic reactions.14 Study of coordination chemistry of transition metal ions with unlike types of ligands has been enhanced by the current evolutions in the fields of medicine and bioinorganic chemistry.15 Through the years, Schiff bases have played a particular role as chelating ligands in coordination chemistry, due to their stabilization under a variety of oxidative and reductive conditions, and to the actuality that imine ligands are borderline between soft and hard Lewis bases.16 This research include synthesis and characterization of LBe compound and used as ligand to synthesize a new complexes by its reaction with different salts of metal chlorides in a molar ratio 1:1 and 1:2 of M: L, as shown in scheme 1.
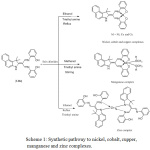 |
Scheme 1: Synthetic pathway to nickel, cobalt, cupper, manganese and zinc complexes. |
Experimental Part
Materials and Measurements
All chemical compounds used in this work were purchased form Merck, BDH, Sigma Aldrich, Alpha, GCC and Fulka Chemical Company. The starting material (Be) was synthesized with modification of a procedure defined by Ali W. B.17 The purity of the synthesized compounds and ending of reaction was checked by TLC sheet and the spots were detected by using (florescence analysis cabinet model CM-10). Melting points were determined by using (Melting point SMP10). FT-IR spectra were registered in the range (400-4000 cm-1) using KBr disk by using (Per Kin Elmer Spectrum 65 FT-IR Spectrophotometer). Molar conductivity measurements for metal complexes in DMSO at room temperature. Magnetic susceptibility measurements for the complexes were carried out using (Johnson Matthey catalytic systems Division Engineered products). Electronic spectra were recorded on the (UV-Visible double beam spectrophotometer equipped with 10mm quartz cell, JASCO V-650, Japan). NMR-spectra using DMSO-d6 were registered on a Bruker 400 MHz spectrometer.
Synthesis Methods
Synthesis of (Be) Compound
(2g, 0.01mol) of 1,1,2-Tri methyl-1H-benzo [e] indole was dissolved in10 ml of DMF and cooled in to ice bath. The solution of (4.6ml, 0.03mol) of phosphoryl chloride in 10 ml of dimethylformamide was cooled in an ice bath also and then was added dropwise to first solution with stirring for 1 h at below 5°C. After that, the reaction mixture was reflux for 3h. The mixture of reaction was poured on ice water, the pH was mend to 8.0 by added aqueous solution of (NaOH 25%), the solid product was precipitated and the product was filtered, washed with water and then dried to afford solid product of yellow crystals of (Be). Yield (91%), m.p.199-200°C.
Synthesis of (LBe)
A mixture of (1g, 0.008mol) of (Be) and (1.74g, 0.016mol) of 2-hydoxy aniline was dissolved in toluene 40ml, then added glacial acetic acid 2ml to the solution. The mixture was refluxed for 5hs. The solvent was reduced to one quarter; orange precipitate was formed, filtered off, washed with toluene and dried in oven. Recrystallization was done by using hexane. The purity of compound was determined by using TLC (3:1) hexane – ethyl acetate which gave one spot. Yield (75%), m.p.168-170°C.
Synthesis of [Ni (LBe)]
Solution of (0.2 g, 0.0004mol) of ligand was dissolved in 20ml hot ethanol, then a few drops of triethylamine (5drops) was added into the solution followed by addition (0.095 g, 0.0004) of NiCl2.6H2O was dissolved in 10 ml of distilled ethanol. The solution was refluxed for 4h where upon the deep red solid of the product precipitated. Then the mixture was cooled and the precipitate was filtered off, washed with ethanol and dried, m.p decomposition above 300°C. Yield 81%.
Synthesis of [Cu (LBe)]
Solution of (0.2 g, 0.0004) of (LBe) ligand was dissolved in 20 ml hot ethanol, then 5 drops of triethylamine was added into the solution followed by addition (0.068 g, 0.0004) of CuCl2.2H2O was dissolved inm8 ml of distilled ethanol. The solution was refluxed for 4h whereupon the dark brown solid of the product precipitated. Then the mishmash was cooled and the solid precipitate was filtered off, washed with ethanol and dried, m.p decomposition above 300°C. Yield 70%.
Synthesis of [Co ((LBe)]
(0.15 g, 0.00034) of (LBe) ligand was dissolved in 20 ml hot ethanol then a few drops of triethylamine was added into the solution and then addition (0.067g, 0.00034 mol) of CoCl2.6H2O was dissolved in 8 ml of distilled ethanol. The solution was refluxed for 5h where upon the brown solid of the product precipitated. Then the mixture was cooled and the brown precipitate was filtered off, washed with ethanol and dried, m.p decomposition above 300°C, yield 93%.
Synthesis of [Mn (LBe)]
Solution of (0.2g, 0.0004) of ligand was dissolved in 20 ml methanol then trimethylamine was added into the solution followed by the addition(0.079 g, 0.0004) of MnCl2.4H2O was dissolved in 10 ml of methanol. The solution was refluxed in air for 4h where upon the solid of the product precipitated. Then the mixture was cooled and the maroon precipitate was filtered off, washed with ethanol and dried, m.p decomposition above 300°C. Yield 85%.
Synthesis of [Zn (LBe)2]
(0.25 g, 0.0006) of ligand was dissolved in 20 ml ethanol then 5 drops of triethylamine was added into the solution followed by the addition (0.041 g, 0.0003) of ZnCl2 was dissolved in 8 ml of distilled ethanol. The solution was refluxed for 4h where upon the orange solid of the product precipitated. Then the mixture was cooled to room temperature and the orange precipitate was filtered off, washed with ethanol and dried, m.p decomposition above 300°C.,yield 75%.
Cellular Toxicity Test for Raw Extracts in The Growth of Hella Cell Line, A Cervical Cancer Cell Line
Prepare the cell suspension by adding trypsin-fersin solution to the tissue culture pot size (50 cm2) and add 20 ml of the irrigated medium with the serum. The cell suspension was mixed well and 0.2 ml was taken after each mixture. Each hole of the (96-microtiter plates) was applied using a precise automatic pipette, each hole contained 105 x 1 (cell / hole). The surface of the dish was covered with a transparent adhesive paper and gently stirred the dish to smooth the distribution Cells in the pits. Leave the dishes in the incubator warm 37°C for a period ranging from 12-18 hs. Until adhesion of the cells in the hole. Then remove the old plant medium in the drilling, and added 0.2 ml of the concentrations prepared for each vessel by using the Serum Free Media (SFM) for control with DMSO and four replicates of control, add phosphate buffer saline (PBS) which was added to it 0.2 ml of serum free medium, incubate the dishes at 37°C. After the expiry time, remove the dish from the incubator and add 50 mL of violet dye to each hole. Return the dish to the incubator for 20 minutes. Remove the dish, remove the contents and wash with PBS until the dye is gone. The results were read using the optical spectroscopy device of the fine calibration dishes with a wavelength of 492 nm. The growth inhibition rate of the cancer cells was determined according to the equation by converting the toxic effect values of the water extract and alkaloids for long-term plant in cellular lines to cancerous proportions.
Results and Discussion
FT-IR of Ligand (LBe) and its Complexes
The FT-IR spectra of ligand was displayed new absorption bands of new functional group on spectrum, as well as disappearance some absorption bands of starting materials from spectrum like Be, this is a good an evidence for designated and approved formation the new ligand. For example appearance a new broad absorption band at the 3372 which belonged to new functional group of (O-H), absorption band at the 3181 was assigned to (N-H) group and new functional group at 1644 for azomethine.18-21 In addition, the absorption band at 1608 and 1580 cm-1 was belonged to (C=C) group. Finely a sharp peak at 750 was attributed to (C-H) bending out of plain.22
FT-IR spectra, for new synthesized complexes, (nickel, copper, cobalt and manganese) were showed shift to lower frequency of absorption bands of (CH=N) from 1644 to (1589, 1606, 1589 and 1592) cm-1 respectively. In addition, disappearance absorption bands of hydroxyl group from complexes spectrums in comparison with that of free ligand that supported coordination ligand with central metal ion and formation complexes.23
FT-IR spectra for new zinc complex shown shift to lower frequency of absorption bands of (C=N) from 1644 cm-1 to 1606 cm-1, and disappearance absorption bands of NH group from complex spectrum in comparison with that of free ligand which supported coordination ligand with central metal ion and formation complexes.24 The IR spectra result of ligand and their complexes were listed in Table 1.
Table 1: IR spectra data cm-1 of free ligand (LBe) and its complexes.
|
Comp. |
O-H | N-H | C-H arom. | C-H aliph. | CH=N | C-N | C-O | C-H |
|
(LBe) |
3372 | 3181 | 3049 | 2993 | 1644 | 1207 | 1149 | 750 |
|
[Ni(LBe)] |
– | 3208 | 3055 | 2978 | 1589 | 1207 | 1005 | 731 |
| [Cu(LBe)] | – | 3191 | 3062 | 2978 | 1606 | 1203 | 1151 |
752 |
| [Co(LBe)] | – | 3252 | 3069 | 2971 | 1589 | 1207 | 1103 |
745 |
|
[Mn(LBe)] |
– | 3269 | 3063 | 2976 | 1592 | 1208 | 1051 |
747 |
| [Zn(LBe)2] | 3432 | – | 3063 | 2983 | 1606 | 1208 | 1116 |
747 |
Nuclear Magnetic Resonance Spectroscopy Study (NMR)
The 1H-NMR results for compound (Be) Figure 1 displayed a single signal at 13.79 ppm was belonged to proton of (NH) of indole ring. A singlet signal at 9.71 ppm was referred to two proton atoms of carbonyl group and signal were appeared between (8.02-7.19) ppm were belonged to protons of aromatic ring. Finally, singlet signal at 1.96 ppm was belonged to six protons of two methyl groups17,25 and.26
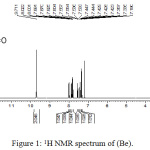 |
Figure 1: 1H NMR spectrum of (Be). |
The H-NMR outcomes for ligand, Figure 2 displayed single signal at 13.65 ppm were belonged to proton of (NH) of in dole ring. A signal at 11.95 ppm was referred to two protons of hydroxyl group and single signal at 9.06 ppm was attributed to protons of Schiff base (CH=N). In addition, signals were appeared in the region between (8.70-6.90) ppm were belonged to fourteen protons of aromatic ring. Finally, singlet signal at 1.89 ppm was belonged to six protons of two methyl groups24,27 and.28
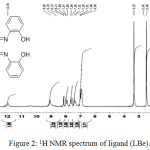 |
Figure 2: 1H NMR spectrum of ligand (LBe). |
Magnetic Susceptibility and Molar Conductance
The effective magnetic moment calculated from the following equation29:
![]()
Where, μs (magnetic moment for spin only), S (Spin quantum number, S= n / 2, n= no. of unpaired electrons).
The experimental values corrected for diamagnetic effects using the following relationship30:
![]()
XA = X m – D
Xm = X g * M. Wt
Where, μeff (effective magnetic moment), T (absolute temperature in K), XA (atomic susceptibility), Χm (molar susceptibility), D (correction factor) and Χg (mass susceptibility).
According to the magnetic moment values, the complexes of the LBe ligand were paramagnetic except complexes [Ni(LBe)] and [Zn(LBe)2] were diamagnetic.
The molar conductance of complexes measured at room temperature. The values obtained lie in the range (0-0.2 S. cm2. mol-1), this indicates that all these complexes are nonelectrolyte and satisfied the oxidation state of the central ion (+2).31 The molar conductance values and the (μeff.) of all complexes are summarized in Table 2.
Electronic Spectra
The electronic spectrum of ligand showed three absorption bands attributed to(π-π*) and (n- π*) transition.32 The Ni(II) complex showed two bands in visible region assigned to (d-d)transition, refer to 1A1g → 1A2g and 1A1g→ 1B1g in a square planar geometry.33 The Co(II) complex show two prominent (d-d) absorption bands attributed to the transitions 2A1g→ 2A2g and 2A1g→ 2B1g, for a low spin square planner. Low spin manganese (II) has the electronic configuration d5. The ground term in which octahedral stereochemistry is 2T2g. The electronic spectra of the complex Mn(II) showed three bands assigned to (d-d) electronic transition 2T2g→ 2A2g, 2T2g→ 2Eg and 2T2g→ 2A1g.34 The electronic spectrum of Cu(II) complex show two bands assigned to transitions 2B1g→2B2g and 2B1g→2Eg for a low spin square planner.35 The Zinc complex showed no absorption band for (d-d) transition because the d orbital is field. The spectra of Zn complex, show change in the bands position compared to that of the free ligand due to charge transfer between Zn(II) and ligand, that is a good result for zinc(II) tetrahedral complex36 and.37 Table 2 explain Uv-Vis bands of the ligand and all complexes with their assigned transition.
Table 2: The conductivity measurements, magnetic susceptibility and electronic spectral data of ligand (LBe) and its complexes.
| Comp. | Wave λ(nm) length | Wave no. ῡ(cm-1) | Assignment | μeff (BM) | Conductivity (S.cm2.mol-1) | Suggested Geometry |
| LBe | 283.6 | 35260 | π → π* | —– | —– | —– |
| 331.8 | 30138 | π → π* | ||||
| 393.8 | 25393 | n → π* | ||||
| [Cu(LBe)] | 488.8 | 20458.26 | 2B1g→2Eg | 1.83 | 0.1 | Square planner |
| 741.2 | 13491.63 | 2B1g→2B2g | ||||
| [Co(LBe)] | 500.1 | 19996 | 2A1g→ 2B1g 2A1g→ 2A2g | 1.91 | 0 | Square planner |
| 740.2 | 13509.86 | |||||
| [Ni( LBe)] | 476.6 | 20981.95 | 1A1g→1B1g 1A1g→ 1A2g | 0.2 | 0.2 | Square planner |
| 740 | 13513.51 | |||||
| [Mn(LBe)] | 506 | 19747.2 | 2T2g→ 2A1g | 2 | 0 | Octahedral |
| 540 | 18491.12 | 2T2g→ 2Eg | ||||
| 736 | 13586.95 | 2T2g→ 2A2g | ||||
| [Zn(LBe)2] | 268.2 | 37285.6 | C.T | 0.3 | 0 | Tetrahedral |
| 297.2 | 33647.37 | |||||
| 454.2 | 22016.73 |
Biological Activity
Cytotoxicity effect of ligand (LBe) Figure 4, and its complexes have evaluated against Hella cell line, a cervical cancer after exposure to (125) µg/ml for (24 and 48 hrs.) as shown in Table 3. The results revealed that the [Zn (LBe)2] complex Figure 5, had greater inhibition rate on Hella cell line at time of exposure 24 and 48 hrs respectively. In time of exposure 48 hrs the results recorded high inhibition rates for the ligands and its complexes.
Table 3: Show the hella cell line for ligands LBe and complexes.
| Concentration 125 µg/ml | 24 hoursstandard error ± Inhibition ratio | 48 hoursstandard error ± Inhibition ratio |
| The control | h 0.00±1.15 | h 0.00± 1.17 |
| LBe | f 0.81±7.86 | f 0.81± 18.61 |
| [Mn( LBe)] | e 0.30± 13.16 | e 0.30±20.95 |
| [Co (LBe)] | d 0.23±24.89 | d 0.23±34.90 |
| [Cu (LBe)] | c 0.33± 31.28 | c 0.33±47.73 |
| [Ni (LBe)] | b 1.12± 36.21 | b 1.12± 61.62 |
| [Zn (LBe)2] | a 0.37± 41.28 | a 0.37± 70.46 |
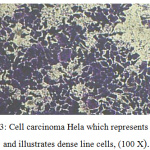 |
Figure 3: Cell carcinoma Hela which represents control and illustrates dense line cells, (100 X). |
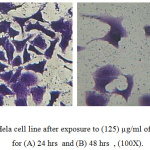 |
Figure 4: Hela cell line after exposure to (125) µg/ml of LBe ligand for (A) 24 hrs and (B) 48 hrs, (100X). |
![Figure 5: Hela cell line after exposure to( 125 ) µg/ml of [Zn (LBe)2] complex for (A) 24 hrs. and (B) 48 hrs, (100X).](http://www.orientjchem.org/wp-content/uploads/2019/07/Vol35No3_Syn_Reh_fig5-150x150.jpg) |
Figure 5: Hela cell line after exposure to( 125 ) µg/ml of [Zn (LBe)2] complex for (A) 24 hrs. and (B) 48 hrs, (100X). |
Conclusion
The ligand (LBe) was successfully synthesized by condensation reaction. The new ligand behave as tetradentate ligands through coordination with two nitrogen atoms of azomethane group and two oxygen atoms of hydroxyl group with Ni(II), Co(II), Cu(II) and Mn (II) ions and behave as bidentate ligands through coordination with nitrogen atom of azomethane group and nitrogen atom of indole ring with Zn (II) ion. Conductivity measurements showed that all the synthesized complexes to be non-ionic. The results of biological activity of the ligand and its metal complexes at time of exposure 48 hrs and 24 hrs for cancer cell line Hella exhibited decrease in inhibition rate according to[Zn (LBe)2] > [Ni(LBe)] > [Cu(LBe)] > [Co(LBe)] > [Mn(LBe)] > LBe. In addition the highest inhibition rate in time of exposure 48 hrs. than 24 hrs. for the ligands and their complexes.
Conflict of Interests
There is no conflict of interests.
Acknowledgements
The authors thank Department of Chemistry in College of Science, University of Diyala, for supporting this work.
References
- Faraj, F.L. D. Thesis 2015, Faculty of Sciences-University of Malaya, Malaysia.
- Yadav, P.S.; Prakash, D. and Senthikumar, G.P. Intrenational Journal of Pharmaceutical Sciences and Drug Research 2011, 3(1), 01-07.
- Alias, M.F. and Seewan, A.N. Diyala Journal for Pure Sciences 2013, 9(4), 93-103.
- Qin, W.; Long, S.; Panunzio, M. and Biondi, S. Molecules 2013, 18(10), 12264-12289.
- Tobriya, S.K. International Journal of Science and Research 2014, 3(9), 1254-1256.
- Arulmurugan, S.; Kkavitha, H.P. and Venkaraman, B.R. Rasayan Journal of chemistry 2010, 3(3), 385-410.
- Al-mahdawy, A. S. A.; Mohammed, M. Y. and Abd A. N. Sc. Thesis 2016, College of Science – University of Tikrit, Iraq.
- Islam, S.; Siddiki, K. M. N. A.; Begum, S. and Salam, M. A. Open Journal of Inorganic Chemistry 2018, 8, 55-69
- Xavier, A. and srividhya, N. IOSR Journal of Applied Chemistry 2014, 7(11), 6-15.
- Rai, B.K. and Rachana, K. Oriental Journal of Chemistry 2013, 29(3), 1163-1167.
- Ahmed, N. K. Sc. Thesis 2016, College of Science -University of Baghdad, Iraq.
- Lakshmi, B.; Shivananda, K. N.; Prakash, G. A.; Isloor, A.M. and Mahendra, K.N. Bulletin Korean Chemical Society 2012, 33(2), 473-482.
- Govindaraj, V.; Ramanathan, S. and Murgasen, S. Der Chemica Sinica 2018, 9(3),736-745.
- Abass, H. H.; Salih, R. A. and Salih, A. A. Global Journal of Pure and Applied Chemistry Research 2016, 4(2), 19-
- Hossain, M. S.; Camellia, F. K.; Uddin, N.; Banu, L. A.; E-Zahan, M. K. and Haque, M. M. International Journal of Applied Science – Research and Review 2019, 6(1:2) ,1-7.
- Anacona, and Santaella, J.Spectrochimica Acta Part A: Molecular and Biomolecular Spectroscopy 2013, 115, 800–804.
- Ali, W. B. Diyala Journal for Pure Sciences 2018, 14(3), 206-219.
- Matela, G.; Aman, R.; Sharma, C. and Chaudhary, S. Indian Journal of Advances in Chemical Science 2013, 1(3), 157-163.
- Ameram, N. and Othman, U. IOSR Journal of Engineering 2013, 3(8), 38-50.
- Kumar, S.; Niranjan, M.S.; Chaluvaraju, K. C.; Jamakhandi, C. and Kadadevar, D. Journal of Current Pharmaceutical Research 2010, 1, 39-42.
- Saleem, L.M.N. and Sultan, R.H. International Journal of Enhanced Research in Science Technology and Engineering 2014, 3(4), 167-172.
- Silverstein, R. M.; Webster, F. X. and Kiemle, D.J. Spectrometric Identification of Organic Compounds 2005, 7th ed., John wiley and Sons Inc., New York.
- Niseaf, A. N. Ibn Al-Haitham Journal for Pure and Applied Science 2017, 30(1), 131-142.
- Faraj, F. L.; Ali, W. B.; Jassim, S. A. and Ali, T. R. Diyala Journal for Pure Sciences (2017), 13(2), 262-277.
- Faraj, F.L.; Khaledi, H.; Morimoto, Y. A.; Itoh, S.; Olmstead, M. M. and Ali, H. M. European Journal of Inorganic Chemistry 2014, 2014(33), 5752-5759.
- Matar, S. A.; Talib, W. H.; Mustafa, M. S.; Mubarak, M. S. and Al-Damen, M. A. Arabian Journal of Chemistry 2015, 8, 850-857.
- Zahedifard, M.; Faraj, F. L.; Paydar, M. J.; Looi, C. Y.; Hajrezaei, M., Hasanpourghadi, M.; Kamalidehghan, B.; Abdul Majid, N.; Ali, H. M. and Abdulla, M. A. Scientific reports 2015, 5, 1-17.
- Singh, ; Lakhan, R. and Singh, G. S. Arabian Journal of Chemistry 2017, 10, S2778-S2781.
- Housecroft, C.E. and Sharpe, A.G. Inorganic Chemistry 2008, 3rd ed., Printic Hall, Printed and bound by Rotolito Lombarda, Italy.
- Hashim, C. S. and. Alias, M. F. Sc. Thesis 2012, College of Science for Women-University of Baghdad, Iraq.
- AL-Hashime, S. ; Sarhan, B. M. and Alazawi, S. A.S. Journal of Al-Nahrain University 2007 , 10(2), 82-88
- Al-Shaalan, N. H. Molecules 2011, 16,8629-
- Yaseen, A. K. and Al-Karkhi, I. H. T. Baghdad Science Journal 2013, 10(1), 198-206.
- Lever, A. B. P. Inorganic Electronic spectroscopy 1968, Elsevier publishing Company, New York, London.
- Mishra, A. P. and Jain, R. K. Journal of Chemical and Pharmaceutical Research 2010, 2(6), 51-61.
- Saraireh, I. A. M.; Altarawneh, M.; Alhawarin, J.; Salman, M.; Abu-Yamin, A. and Alasad, R. Journal of Chemistry 2019, Volume 2019.
- Dhabab, J.M.; Aljoobori, M. N. and Albajlan, H. H. Ibn Al-Haitham Journal for Pure and Applied Science 2012, 25(1), 1-17.

This work is licensed under a Creative Commons Attribution 4.0 International License.
![]()
A New Edition of Web of Science
Journal Impact Factor
2022: 0.5
Five Year: 0.8
Journal is Indexed in

Cabells Whitelist
![]()


