Study of the Alternative Renewable Energy Resources for Industrialization of Advanced Oxidation Wastewater Treatment Processes: Feasibility Cost Estimation
Azadeh Shamsi Kasmaei1, Mohammad Kazem Rofouei*1 , Mohammad Ebrahim Olya2 and Mohamed Ziaulla3
1Faculty of chemistry, Kharazmi University, P. O. Box: 15719-14911, Tehran, Iran.
2Department of Environmental Research, Institute for Color Science and Technology, P.O. Box: 16765-654, Tehran, Iran.
3Department of Chemistry, Impact College of Engineering and Applied Sciences, Bangalore-560 092, Karnataka, India.
Corresponding Author E-mail: rofouei@khu.ac.ir
DOI : http://dx.doi.org/10.13005/ojc/350307
Article Received on : 15-04-2019
Article Accepted on : 08-06-2019
Article Published : 21 Jun 2019
Technical feasibility and economical feasibility are needed for wastewater treatment technologies to be suitable for use in the industry. In this regards, the application of an electrical power source to produce active radicals is one of the most important restrictions of application of advanced oxidation processes (AOPs) method for wastewater treatment. But there are hardly any exhaustive reports which address the issue of economical feasibility of these techniques on industrial scale. In this study, we estimated the expenses of dye removal from wastewaters using two established AOPs technologies (photocatalytic and non-photocatalytic). The impact of using alternative renewable energy sources on the cost was examined and compared in different regions of the world. This approach acts in favor of helping them to employ different economical energy sources for improving the performance of application of AOPs which would be more effective for helping to decrease the expenses of wastewater treatment in future.
KEYWORDS:AOPs; Cost Estimation; EEO; Renewable Sources; Wastewater Treatment
Download this article as:| Copy the following to cite this article: Kasmaei A. S, Rofouei M. K, Olya M. E, Ziaulla M. Study of the Alternative Renewable Energy Resources for Industrialization of Advanced Oxidation Wastewater Treatment Processes: Feasibility Cost Estimation. Orient J Chem 2019;35(3). |
| Copy the following to cite this URL: Kasmaei A. S, Rofouei M. K, Olya M. E, Ziaulla M. Study of the Alternative Renewable Energy Resources for Industrialization of Advanced Oxidation Wastewater Treatment Processes: Feasibility Cost Estimation. Orient J Chem 2019;35(3). Available from: https://bit.ly/31LY1o5 |
Introduction
The continuous development in science and technology that makes attraction for greater demand on using novel techniques can be exploited for human in order to live safer. Actually, one of the most important problems for human health is the hazardous wastewaters containing the industrial and chemical products. In other words, the negative effects of special industrial wastewaters that are produced by a wide range of industrial manufactories; fabric, woven, leather, textile, paper, cosmetic, pharmaceuticals, paint, food processing, agricultural production, etc.1,2 Similar to energy, there is an enhancing trend for water use as supplies of traditional resources power become diminishing because of overuse, waste, cost, and pollution. The extensive water consumption in different industries led to the generation of high amounts of wastewater. Wastewaters containing chemical compounds can potentially be carcinogenic or mutagenic which detrimental impacts on the survival of microorganisms, aquatic life and environmental health.3 Indeed, application of traditional techniques as the physicochemical treatments, are expensive and consume lots of energy.4 Other treatments methods cannot completely mineralize pollutants and only transfer from one phase to another. Recently, advanced oxidation processes (AOPs) have been employed as alternative techniques to the conventional methods which are highly effective, but are not economical in industrial scale. AOPs, based on the generation of non-selective and highly reactive species like ˚OH can work as initiators of the oxidative degradation process.5-7 In order to tackle the problem of drinking water contamination, development of advanced, cost-effectiveness and promising water treatment technique to treat wastewater in some countries with arid climate conditions and sunlight ubiquitous, few precipitation and long-lasting drought can be considered as a critical necessity. In AOPs, many techniques have been used, which in all techniques the energy source is required to generate the free radicals like °OH.8-10 The present study is focused on investigation and comparison between different techniques with regards to both economical and fuel consuming aspects in order to remove existing contaminants in the wastewater in different regions of the world. One of the most toxic contamination in wastewater is dye family. There are more than 100,000 commercially available components in dye structure which produce around 1 million ton of dye products per annum.11 Regarding the chemical structures, dyes are resistant towards decomposition by contact to various chemical treatments. Despite the high efficiency of AOPs in removal of contaminants in the aquatic environment, no industrial wastewater treatment plants have ever been reported in the literature, due to the application of power sources in this method. The most significant of challenges in industries are energy costs, greenhouse gas emissions.12 However, there are a large capability of using renewable energy resources to gain access to new water treatment technologies. The proper application of an available renewable energy resource makes this AOPs method accessible which was not paid attention before.
Materials and Method
Literature Review
There are two sections namely energy consumption and radical generation in application of AOPs for degradation of organic matters in industrial wastewater. In this process the source of the energy like UV and visible light is required to generate the free radicals from the chemical generators. Researchers have used different methods for radical production in AOPs.13 An important disadvantage of AOPs for industrialization is the energy consumption, especially in some countries where energy consumption is so expensive, as presented in Table 1. To reduce energy consumption in AOPs, some methods have been used to optimize the process efficiency such as reactors optimization, application of the photocatalysts, O3, H2O2, and etc.13 Despite the use of different procedures to reduce energy consumption, this process will be very costly in industrial scales. The cost of electricity is very high in some regions like European Union and Oceania which made owner of industries to look for a cheap alternative energy source. Azo dyes are one of the most common organic pollutant groups in wastewaters which was selected as a model pollutant to calculate the expenses because of widely used in previous research. Fig. 1 represents a schematic diagram of a wastewater detoxification system.
Table 1: Electricity price comparison.
| Regions | Average Price ( US $/kwh) |
| USA | 0.1-0.2 |
| North USA | 0.07-0.15 |
| European Union | 0.12-0.37 |
| Asia | 0.04-0.1 |
| Middle East | 0.008-0.015 |
| South Africa | 0.07-0.15 |
| Oceania | 0.2-0.4 |
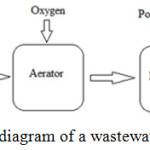 |
Figure 1: A schematic diagram of a wastewater detoxification system. |
Cost Estimation Methodology for AOPs
A simple method was applied for obtaining the expenses of treatment of two studied AOPs methods. First, the published research data were applied for some AOPs, as a case study.14,15 The work of Fung et al.14, and Taicheng et al.15 were used as a treatment study for reactive azo dye. Table 2 shows the collected operational conditions and kinetic data from these studies. From the obtained data, the degradation kinetics of contaminant was obtained. By kinetics, the degradation order and the rate constant (k) could be calculated which is suitable for evaluation of the required time for degradation of 90 % of pollutant. The estimation of expenses was carried out for the supposed flow rate of 1000 L/min. According to the literature data, the first-order degradation rate constant for reactive azo dye decolorization by UV/H2O2 and photocatalytic processes were 0.0124 and 0.0207 min-1 respectively.
Table 2: Operating conditions and kinetic data in AOPs.
| Process | C0 (mg/L) | Pelec | k | Energy (Watt/ml) |
References |
|
Catalytic |
100 |
0.186 |
0.0124 min-1 |
0.0147 |
14 |
|
Non Catalytic |
393.75 |
0.5 |
0.0207 min-1 |
0.7143 |
15 |
Researchers have reported various findings on remediation of wastewater via AOPs techniques.14,15,18 According to the obtained results, the reported rates of the reactive dye degradation are in the same range as considered in the present study.14,15,18
Electrical energy per order (EEO) is the energy in kilowatt hours [kWh] needed for degradation of a pollutant by one order of magnitude in a unit volume [e.g., 1 m3 (1000 L)] of either the contaminated water or air.16,17 EEO is defined as:
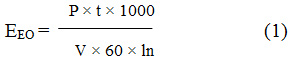
where, P (kW) is the power rate of the AOP system, t (min) is the irradiation time, V (L) is the volume of water in reactor. Also, C0 and C represent the initial and residual concentrations of contaminant, respectively.
The principal aim of present research is on the cost of wastewater treatment using AOPs techniques by levelized cost of electricity (LCOE) (Fig. 2) of renewable and traditional power resources in different regions in the world.19 The final comparison of cost is analyzed by LCOE of various energy resource technologies.
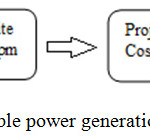 |
Figure 2: Renewable power generation cost indicators. |
Energy Resources
In the last 15 years, there has been a lot of changes in the consumption of energy resources. Fig. 3 shows the comparative primary energy consumption over the last 15 years in the world. Accordingly, a demand for energy sources such as oil has fallen from 2005 to 2015, but an increase in the demand for new energies has been observed. In 2015, clean energy investment was increased in some regions such China, Africa, the USA, Latin America and India, driving the world total to its highest ever figure, of US$328.9 bn, up 4% from 2014’s revised US$315.9 bn and beating the previous record, set in 2011 by 3%.19
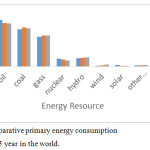 |
Figure 3: Comparative primary energy consumption over the past 15 year in the world. |
Renewable Energy Resources
Renewable energy sources consider solar thermal and photovoltaic energy, hydro (including tide, wave and ocean energy), wind, geothermal energy and different types of biomass (including biological waste and liquid biofuels). Within the renewable energy resource technologies, the costs of system were distinguished based on power plant size and configuration.
Solar Energy
In recent years, solar generation source has considered as a most welcome source in worldwide, especially in some countries with average sunlight over the course of a year, so which is a particular problem in some regions such as high northern and southern latitude countries. In some areas with cloudy weather conditions, there is less available energy from the sun to convert into electricity. 89 PW of solar power falls on the planet’s surface.19 Capturing of less than 0.02 % of this energy is enough for the present required energy.19 Although much efforts have been made for solar generation, several problems such as high cost of solar cells production and dependence on weather patterns have restricted the application of this method. PV systems are examined at respective locations with global irradiance (GHI) of 1800 kWh/ (m²a) and 2000 kWh / (m²a). The feasibility of sunlight application in conjunction with the photocatalytic process for dye removal in wastewater was demonstrated in the mid-1980s. Later, the U.S. DOE, through NREL tried for development of the solar detoxification approach in an economical way in 1990s. This approach has illustrated the efficiency against organic chemical contaminants, such as reactive azo dyes. Results of previous studies (Cooper et al 1997 and Zhang et al 1994) have demonstrated that AOPs with a solar energy source could be an efficient process for bacterial removal from water media. The Fig. 4 shows solar global capacity in 2016.20
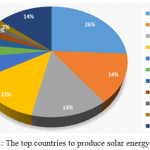 |
Figure 4: The top countries to produce solar energy in 2016. |
Wind Power
Wind power is a principal source of supplying energy which has a significant effect on de-carbonization. Technical and financial innovations should be proposed to decrease the cost of energy for making it a suitable source for industrial applications. The most of wind energy could be reached in over the open oceans which cover 71 % of the planet. According to the literature, the range of available wind energy is between 300 and 870 TW.21,22 The cost of generation of energy by wind power has decreased by about 40 % over the last 25 years.23,24 10 cumulative capacity countries in 2016 are shown is Fig. 5.25 Around 75-80 % of overall expenses of power production in a wind turbine would be attributed to the expenses of the turbine, foundations, electrical tools and grid connection.25
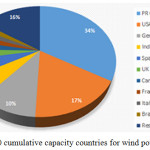 |
Figure 5: 10 cumulative capacity countries for wind power in 2016. |
Hydropower
Hydropower resource is the leading renewable source of electricity which shares over 16 % of the electrical source in the world and 80% of the renewable electricity of worldwide. Hydropower is a significant source of renewable energy, according to the natural water cycle which is the most mature, authentic and cheap renewable available power generation technology.26,27 Undeveloped potential for generating electricity by hydropower technique is approximately 10000 TWh/y worldwide. Fig. 6 shows hydropower global capacity, shares of top 6 countries in 2016.28
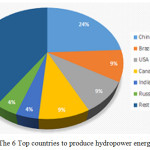 |
Figure 6: The 6 Top countries to produce hydropower energy in 2016. |
Geothermal
Geothermal energy is clean and sustainable with the Earth heat. The geothermal energy sources are in the domain of the shallow ground to hot water and hot rock found a few miles beneath the earth surface, and down even deeper to the extremely high temperatures of molten rock called magma. The steam from a reservoir could be used in geothermal plants as a power in turbine/generator instead of hot water which is normally used in other methods. Hot water near the surface of Earth may be applied directly for heating. Using a geothermal resource in active geothermal areas has been expanded and reached a total installed capacity of 12.7 GW, globally, at the end of 2016 which is 26 % up to the 2010 level.27 Fig. 7 shows geothermal global capacity, shares of top 6 countries in 2016.27
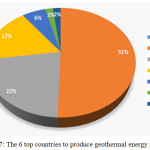 |
Figure 7: The 6 top countries to produce geothermal energy in 2016. |
Biomass
As a cheap, economic and environmental-friendly process, biomass contributes as one of the largest consumed energy sources in the world. It is the response of 14% of the world’s primary energy demand and 35 % of it, in developing countries. In these processes, a large number of the wastes could be used as a feed of reactors accompanying the microorganisms and application of a large number of combustion techniques. Perhaps, the produced power of these reactors is not comparable with the gas turbines, but it is sufficient for domestic application and could be used as a source of energy for AOPs, due to the quantity of required energy for these processes. The techniques of production of power which are abundant with a long track record are included: combustion in stoker boilers, low-percentage co-firing, anaerobic digestion, municipal solid waste incineration, landfill gas and combined heat and power. Other less effective techniques are included atmospheric biomass gasification and pyrolysis.28 Fig. 8 shows biomass global capacity in 2016.19
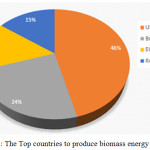 |
Figure 8: The Top countries to produce biomass energy in 2016.Click here to view figure |
Results and Discussion
According to the above-mentioned information, renewable energies could be the sources of energy for AOPs in wastewater treatment processes. Hence, in this section, the cost of energy using renewable sources in each region is investigated for two AOPs case studies. For this purpose, according to the kinetic constants of reactions that are presented in Table 2, the cost of energies has been presented in Table 3. By replacing renewable energy sources instead of the current energy sources, AOPs can be used less than the cost of this technique to remove wastewater pollutions. Table 3 illustrates the brief description of the cost estimation of two AOPs techniques (e.g., catalytic and non-catalytic) along with EEO values for removal of one kind of Reactive Azo dye in different regions in the world.
It is clear that the cost of wastewater dye removal using AOPs by current resource are highest. But the cost of AOPs wastewater treatment decreases by combination with renewable power sources. The lowest cost are achieved in European Union (US $ 22-78) and North USA (US $ 16.7-55.9) when wind power is used such a power resource in combination of UV and H2O2 for pollution degradation.19 Table 4 as a complementary result presents the cheapest renewable source of the energy for AOPs in each region.
Table 3: Summary of the cost estimation of two techniques of AOPs for reactive azo dye in different regions.19
|
Regions |
Cost of energy by different sources of renewable energy for AOPs (US $) |
|||||||||||
|
Solar (PV) |
Wind |
Hydropower |
Geothermal |
Biomass |
Current Source |
|||||||
|
Catalytic |
Non Catalytic |
Catalytic |
Non Catalytic |
Catalytic |
Non Catalytic |
Catalytic |
Non Catalytic |
Catalytic |
Non Catalytic |
Catalytic |
Non Catalytic |
|
|
Central USA |
255.7-438.4 |
39-67 |
219.2-365 |
33.5-55.9 |
292.3438.4 |
44.7-67 |
365-430 |
55.9-65 |
292.3-548 |
44.7-83.8 |
365-730 |
60-110 |
|
North USA |
402-475 |
61-72.6 |
109.6-365 |
16.7-55.9 |
182.7-255 |
27.9-39.1 |
365-438.4 |
55.9 – 67 |
401.9-475 |
42.6-61.4 |
250-550 |
40-84 |
|
European Union |
438-621 |
67-95 |
146-365 |
22.3-60 |
401.9-548 |
61.4-83.8 |
255.7-328.8 |
39.10-50.3 |
219.2-292.3 |
33.5-44.7 |
450-1350 |
100-150 |
|
Africa |
584.6-657.7 |
89.4-100.6 |
255.7-511.5 |
39-78 |
182.7-255.7 |
27.95-39 |
511.5-548 |
78-83.8 |
# |
# |
250-500 |
35-85 |
|
Asia |
328.8-365.4 |
50.3-55.9 |
219.2-511.5 |
33.5-78.2 |
146-182.7 |
22.3-28 |
219.2-255.7 |
33.5-39 |
182.7-255.7 |
28-39.1 |
200-370 |
30-55 |
|
Oceania |
328.8-402 |
50.3-61.4 |
292.3-438.4 |
44.7-67 |
219-292 |
33.5-44.7 |
# |
# |
# |
# |
900-1450 |
140-220 |
|
Middle east |
584.6-621 |
89.4-95 |
255.7-328.8 |
39-50.3 |
219.2-255.7 |
33.5-39 |
511.5-548 |
78.2-83.8 |
621-694.2 |
95-106.2 |
30-55 |
4.5-8.5 |
# Not available
Table 4: Cheapest renewable source of the energy for AOPs.
|
AOPs |
Central USA |
North USA |
European Union |
Africa |
Asia |
Oceania |
Middle east |
|
Catalytic |
Geothermal-Wind |
Wind-Hydropower |
Biomass-Wind |
Hydropower |
Hydropower |
Hydropower |
Hydropower |
|
Non Catalytic |
Geothermal-Wind |
Wind-Hydropower |
Biomass-Wind |
Hydropower |
Hydropower |
Hydropower |
Hydropower |
The results clarified the best source of renewable energies which could be evaluated in different regions. In the other words, it explained the best alternative of current electricity energy for colored wastewater treatment by AOPs.
Conclusion
The following are the main conclusions of this study.
AOPs is a photochemical technology which can be used for a wide range of wastewaters treatment that uses a source of energy to initiate the redox reactions which degrade the structure of pollutants.
Regarding the requirement of energy source for this process and cost of electricity consumption, this technique was not applicable in industrial scales. Using renewable resources to reduce costs and pollution in the world is much considered, so AOPs techniques combining the application of different renewable energy sources are very efficient. By replacing renewable and low-cost energy in each region, instead of the classical electricity sources, AOPs can be used to remove contaminants from wastewaters in industrial scale.
The suitable market designs are required for promotion of flexible electricity systems accustomed to the vast contributions of renewable energy production in various industries. Photochemical technology is able to destroy a wide range of pollutants. So, with economization of AOPs, they could be industrialized as a high performance and clean technology for wastewater treatment processes in various parts of the universe.
Acknowledgements
The authors are very grateful to Dr. Sajjad Ahmed for valuable discussions and his helpful comments and suggestions.
Conflict of Interests
The author(s) declared no potential conflicts of interest with respect to the research, authorship, and/or publication of this article.
References
- Lam, S. M.; Sin, J. C.; Abdullah, A. Z.; Mohamed, A. R. Desalin Water Treat. 2012, 41, 131-169.
- Iovino, P.; Chianese, S.; Prisciandaro, M.; Musmarra, D. Chemical Engineering Journal. 2019, DOI: 10.1016/j.cej.2019.02.132.
- Khataee, A. R.; Zarei, M.; Moradkhannejhad, L. Desalination. 2010, 258, 112-119.
- Stylidi, M.; Kondarides, D. I.; Verykios, X. E. Appl Catal B: Environ. 2003, 40, 271-286.
- Foo, K. Y.; Hameed, B. H. Adv Colloid Interface Sci. 2010, 159, 130-143.
- Malato, S.; Ferna´ndez-Iba´n˜ez, P.; Maldonado, M. I.; Blanco, J.; Gernjak, W. Catal Today. 2009, 147, 1-59.
- Chong, M. N.; Jin, B.; Chow, C. W. K.; Saint, C. Water Res. 2010, 44, 2997-3027.
- Mohamed, R. M.; McKinney, D. L.; Sigmund, W. M. Mater Sci Eng. R, 2012, 73, 1-13.
- Chianese, S.; Iovino, P.; Leone, V.; Musmarra, D., Prisciandaro, M. Water, Air, and Soil Pollution. 2017, 228 (8), Article number 270.
- Bertagna Silva, D.; Cruz-Alcalde, A.; Sans, C.; Giménez, J.; Esplugas, S. Applied Catalysis B: Environmental. 2019, 249, 211-217.
- Christie, R. M. CRC Press. Woodhead Publishing Limited. Cambridge, 2007.
- Ahmed, S.; Elsholkami, M.; Elkamel, A.; Du, J.; Ydstie, E. B.; Douglas, P. L. Energy Conversion and Management. 2015, 95, 170-180.
- Hisaindee, S.; Meetani, M. A.; Rauf, M. A. Trends Anal. Chem. 2013, 49, 31-44.
- Fung, P. C.; Sin, K. M.; Tsui, S. M. Color Technol. 2000, 116, 170-173.
- Taicheng, A.; Haofei, G.; Ya, X.; Weiguo, C.; Xihai, Z.; Guoying, S.; Jiamo, F. J Chem Technol Biotechnol. 2003, 78, 1142-1148.
- Cater, S. R.; Stefan, M. I.; Bolton, J. R.; Safarzadeh Amiri, A. Environ Sci. Technol. 2000, 34, 659-662.
- Mohammadzadeh, S.; Olya, M. E.; Arabi, A. M.; Shariati, A.; Khosravi Nikou, M. R. J Environ Sci. 2015, 35, 194-207.
- Mahamuni, N. N.; Adewuyi, Y. G. Ultrason Sonochem. 2010,17, 990-1003.
- Renewables 2017 Global Status Report (Paris: REN21 Secretariat), Abu Dhabi, 2017. ISBN 978-3-9818107-6-9B NEF http://about.bnef.com/content/uploads/sites/4/2016/01/BNEF-2015-Annual-Investment-Numbers-FINAL.pdf, 2017.
- Snapshot of Global Photovoltaic Markets, International Energy Agency, 2017.
- Global Wind Atlas. Technical University of Denmark (DTU), https://globalwindatlas.info.
- What is wind? Renewable UK: Education and careers, Renewable UK , 2010.
- McCrone, A.; Moslener, U.; Usher, E.; Grüning, C.; Sonntag-O’Brien, V. 2015. Global trends in renewable energy investment 2015. http://fs-unep centre.org/publications/global-trends-renewable-energyinvestment.
- Lantz, E.; Hand, M.; Wiser, R. 2012, the Past and Future Cost of Wind Energy. National Renewable Energy Laboratory, http://www.nrel.gov/docs/fy12osti/54526.
- Global Wind Report: Annual Market. 2017, www.gwec.net. Global Wind Energy Council, Brussels.
- World energy council. 2016, World Energy Resources. www.worldenergy.org.
- Brown, A.; Müller, S.; Dobrotková, Z. 2011, Renewable energy markets and prospects by technology. International Energy Agency (IEA)/OECD, Paris.
- IRENA Chapter 8, Renewable Power Generation Costs in 2017. 2018, International Renewable Energy Agency, Abu Dhabi.

This work is licensed under a Creative Commons Attribution 4.0 International License.
![]()
A New Edition of Web of Science
Journal Impact Factor
2022: 0.5
Five Year: 0.8
Journal is Indexed in

Cabells Whitelist
![]()


