Rhodamine-Triazole Functionalized Fe3O4@SiO2 Nanoparticles as Fluorescent Sensors for Heavy Metal Ions
Kanokorn Wechakorn*1 , Pairsunan Chanpanich2, Pimfa Kamkalong2 and Suranan Anantachisilp2
1Department of Chemistry, Faculty of Science and Technology, Rajamangala University of Technology Thanyaburi, Pathum Thani 12110, Thailand.
2Kamnoetvidya Science Academy, Rayong 21210, Thailand.
Corresponding Author E-mail: kanokorn_w@rmutt.ac.th
DOI : http://dx.doi.org/10.13005/ojc/350318
Article Received on : 30-04-2019
Article Accepted on : 06-06-2019
Article Published : 21 Jun 2019
Rhodamine-triazole sensor functionalized Fe3O4@SiO2 nanoparticles were developed for the detection of heavy metal ions, namely Cu2+, Ni2+, Hg2+, Co2+, Fe3+, and Pb2+. Rhodamine conjugated with a triazole moiety (RBT) was utilized as the metal ion binding site. The RBT-Fe3O4@SiO2 nanoparticles were fully characterized by XRD, FTIR, TGA, SEM and TEM techniques. Additionally, RBT-functionalized Fe3O4@SiO2 nanoparticles can be separated from the aqueous phase by application of an external magnet, leading to clear naked-eye observation of the color changes and fluorescence enhancement. From UV-Vis absorption spectra, aqueous solutions of RBT-Fe3O4@SiO2 in the presence of heavy metal ions show an absorption peak at 554 nm. Fluorescence titration experiments reveal that the intensity of the fluorescence emission band at 574 nm is linearly dependent on Cu2+ concentration, over a 100-800 µM range. Furthermore, complexation of Cu2+ by RBT-Fe3O4@SiO2 nanoparticles can induce ring-opening of the rhodamine spirolactam ring followed by hydrolysis, confirmed by mass spectrometry.
KEYWORDS:Fluorescent Sensor; Heavy Metal Ions; Magnetic Nanoparticles; Rhodamine; Triazole
Download this article as:| Copy the following to cite this article: Wechakorn K, Chanpanich P, Kamkalong P, Anantachisilp S. Rhodamine-Triazole Functionalized Fe3O4@SiO2 Nanoparticles as Fluorescent Sensors for Heavy Metal Ions. Orient J Chem 2019;35(3). |
| Copy the following to cite this URL: Wechakorn K, Chanpanich P, Kamkalong P, Anantachisilp S. Rhodamine-Triazole Functionalized Fe3O4@SiO2 Nanoparticles as Fluorescent Sensors for Heavy Metal Ions. Orient J Chem 2019;35(3). Available from: https://bit.ly/2Xul3Ao |
Introduction
Contamination of water sources by heavy metal ions (e.g. Co2+, Cu2+, Fe3+, Hg2+, Ni2+ and Pb2+)is a major environmental concern. In addition to their toxicity, accumulation of these in living organisms can have profound impacts on the overall ecology of environmental systems. Accordingly, great effort is being extended into devising ways of removing such pollutants, and in the development of new analytical tools for their detection. Although conventional analytical techniques such as atomic absorption spectrometry (AAS),1 flame atomic absorption spectroscopy (FAAS),2 inductively coupled plasma mass spectrometry (ICP-MS)3 and voltammetry4 are typically used in metal ion detection, these have drawbacks in requiring expensive and sophisticated hardware, long analysis time, and a high level of technical expertise. Fluorescence spectroscopy, on the other hand, is an emerging technique for metal ion detection in environmental science due to its high selectivity, rapid response allowing real-time detection for potential field use, and low cost.5
Magnetic nanoparticles, which exhibit large surface area to volume ratios, and are readily separated from liquid phases by application of an external magnetic field, have been extensively studied over the last decade. Conjugation of organic groups on the nanoparticle surface allows these systems to be utilized in analytical applications, such as metal ion detection. For example, amino-functionalized Fe3O4@SiO2 magnetic nanomaterials were developed as sorbents for the toxic metal ions including Cu2+, Pb2+, and Cd2+ ions.6–9 In addition, thiol-functionalized Fe3O4@SiO2 nanoparticles were synthesized for Pb2+ and Hg2+ sequestration from water samples.10–13 Appending fluorescent groups (dansyl, naphthalimide, Nile red, or Bodipy) to the nanoparticle surface allows the potential of fluorescence as a detection method to be built into the nanoparticle system. As an example, Ma’s group developed reusable dansyl-functionalized Fe3O4@SiO2 nanoparticles for Hg detection, and subsequent removal from water samples.14 In this case, the fluorescence intensity of nanoparticles was quenched in the presence of Hg2+, with the limit of detection being 10 mM in HEPES buffer containing 50% (v/v) CH3CN/H2O. In 2013, “Turn-off” naphthalimide functionalized Fe3O4@SiO2 nanoparticles were observed to aggregate in the presence of Hg2+, forming imide-Hg-imide complexes in aqueous solution.15 In another development, Zhu’s group designed thioether-crown conjugated naphthalimide modified Fe3O4@SiO2 nanoparticles via click chemistry for Hg2+ sensing.16 Recently, magnetic nanoparticles appended with 4-acetamidobenzaldehyde functionalities were able to detect Hg2+ at the nanomolar leve.l17 Meanwhile, dipicolylamine-naphthalimide conjugated magnetic nanoparticles exhibited fluorescence emission allowing feasible Zn2+ detection in environmental water samples.18 In the case of Co2+ ion, chelation by Nile red-functionalities on the surface of Fe3O4@SiO2 nanoparticles leads to fluorescence emission, through the inhibition of photoinduced electron transfer (PET).14
Rhodamine derivatives have been widely reported as fluorescent entities due to their long absorption and emission wavelengths, large molar extinction coefficients, high fluorescence quantum yields and appreciable photostability.19 In these systems, rhodamine having the closed-form of the spirolactam ring is colorless and shows no fluorescence emission, while the solutions of the open-form of rhodamine exhibit a pink color and fluorescence emission. As a consequence, rhodamine has been appended to the surface of magnetic nanoparticles to form sensors for Fe3+ and Hg2+. In 2010, rhodamine 6G-ethylenediamine was conjugated to the surface of Fe3O4@SiO2 nanoparticles via a polyethylene linker, and they exhibited fluorescence emissions in the presence of Fe3+ ion.20 Substituting the polyethylene linker in the previous system by an isocyanate resulted in the selectivity of the sensor with the binding of Hg2+, Cr3+ and Fe3+ ions.21,22 In the context of Hg2+ removal, rhodamine hydrazide was grafting onto the magnetic nanoparticle surface via 3-glycidyloxy moiety,23 or chloroacetyl aminopropane linkers.24 From the previous literatures, rhodamine-based fluorescent sensor immobilized magnetic nanoparticles have not been widely developed for heavy metal ion detection.
This work reports the synthesis of a rhodamine-triazole sensor appended Fe3O4@SiO2 nanoparticles for the detection of heavy metal ions (Cu2+, Ni2+, Hg2+, Co2+, Fe3+ and Pb2+). These functionalized nanoparticles could be easily removed from the solution by applying an external magnetic field. Additionally, the 1,2,3-triazole moiety plays several important roles, being both the metal chelator and the linker between the fluorescence reporter and the metal ion binding site.25 The selectivity and sensitivity of the sensor system, and a rationale for the sensing mechanism, are also reported herein.
Materials and Method
Materials and Instruments
All chemicals and reagents of standard analytical grade were purchased from commercial suppliers and used without further purification. All solvents for column chromatography were distilled before use. Acetate salts of the following metal ions: Co2+, Cu2+, Fe2+, Fe3+, Hg2+, Ni2+ and Pb2+ were prepared in deionized water as stock solutions (10 mM).
1H and 13C NMR spectra were recorded using an Advance Bruker-600AV spectrometer in CDCl3, with tetramethylsilane (TMS) as an internal reference. Fourier transform infrared (FT-IR) spectra were collected on a Perkin Elemer Spectrum two spectrometer using KBr pellets in the 4000-370 cm–1 region. High resolution mass spectra (HRMS) were obtained using a Bruker Micr OTOF mass spectrometer. Scanning electron microscope (SEM) images were obtained using a Jeol JAM-7610F with normal mode and EDS mode. Transmission electron microscopy (TEM) images were obtained using a Jeol JEM-2100Plus Electron Microscope. X-ray diffraction studies (XRD) were performed on a Bruker d8 Venture powder diffractometer (2theta 20 to 80°) with Cu Kα radiation. Thermogravimetric analysis (TGA) utilized a Linseis STA PT1600 instrument. UV-Vis absorption spectra were measured on a Hitachi U-2900/2910 UV-Visible spectrophotometer. Fluorescence spectra were performed on an Edinburgh Fluorescence Lifetime Spectrometer (FLS).
Synthesis of Silica–Coated Magnetic Nanoparticles (Fe3O4@SiO2)
The magnetic nanoparticles were synthesized according to a previously reported procedure.26 Briefly, a solution of Fe(acac)3 (5.648 g, 0.016 mol), benzyl ether (80 mL) and oleylamine (80 mL) was heated to 110°C and allowed to reflux for 1 hour with vigorous stirring. The temperature was raised to 210°C and then refluxed for 2 hours under an argon atmosphere. After cooling to room temperature, the reaction mixture was centrifuged at 10,000 rpm for 20 min, affording the magnetic nanoparticles (Fe3O4) as a black solid. The magnetic nanoparticles were then dispersed in a mixture of 1-propanol (180 mL), conc. NH4OH (25 mL) and deionized water (18 mL) in a 500 mL round-bottom flask by ultra-sonication for 30 min under an argon atmosphere. Following this tetraethylorthosilicate (TEOS) (6 mL, 0.027 mol) was added dropwise for 30 min with vigorous stirring. After stirring at room temperature for 6 hours, the silica-coated magnetic nanoparticles (Fe3O4@SiO2) were separated from the solution using an external magnet, and then washed twice successively with 1-propanol and deionized water, respectively. The Fe3O4@SiO2nanoparticles (brown solid) were then dried under vacuum at 60°C for 6 hours, prior to use.
Synthesis of 3–azidopropyl triethoxysilane
3-Chloropropyl triethoxysilane (5 mL, 0.021 mol) and sodium azide (NaN3) (2.6998 g, 0.042 mol, 2 equiv.) were dissolved in DMF (40 mL), and the mixture heated at 90°C for 6 hours. After that, the mixture was filtered, and the filtrate was evaporated under reduced pressure to provide the product as a colorless liquid in 90% yield. 1H NMR (600 MHz, CDCl3) δ(ppm): 3.80 (d, J = 6 Hz, 6H), 3.24 (d, J = 6 Hz, 2H), 1.70 (d, J = 6 Hz, 2H), 1.21 (t, J = 6 Hz, 9H), 0.66 (t, J = 6 Hz, 2H); 13C NMR (150 MHz, CDCl3) d: 58.5, 53.9, 22.8, 18.3, 7.7.
Synthesis of Rhodamine–n–Propargyl Alkyne
Rhodamine-N-propargyl alkyne was prepared according to a previously reported procedure.27 The crude product was purified by silica column chromatography with 1% CH3OH/CH2Cl2 system as a mobile phase to obtain a light brown solid in 75% yield. 1H NMR (600 MHz, CDCl3) δ(ppm): 7.91 (d, J = 6 Hz, 1H), 7.45 (s, 2H), 7.1 (d, J = 6 Hz, 1H), 6.41-6.46 (m, 4H), 6.27 (d, J = 8.4 Hz, 4H), 4.57 (s, 1H), 3.32 (t, J = 6.9 Hz, 10H), 2.10 (s, 1H), 1.16 (t, J = 6.6 Hz, 12H); 13C NMR (150 MHz, CDCl3) d: 166.64, 153.70, 151.78, 149.52, 148.84, 132.75, 129.83, 128.54, 128.51, 128.10, 123.98, 122.89, 122.86, 109.74, 107.86, 105.65, 100.07, 98.46, 80.10, 72.42, 65.43, 45.53, 44.44, 44.34, 40.42, 12.63.
Synthesis of Chemosensor–Functionalized Magnetic Nanoparticles (RBT-Fe3O4@SiO2)
The Fe3O4@SiO2nanoparticles (1.5 g) were suspended in toluene (80 mL) under an argon atmosphere, and then sonicated for 30 min. 3-Azidopropyl triethoxysilane (1.5 g, 6.064 mmol) was slowly added dropwise into the mixture for 15 min, and the mixture was then heated at reflux for 12 hours. The Fe3O4@SiO2-N3nanoparticles were then separated by applying an external magnet, and then washed three times successively with toluene, 1-propanol and deionized water (30 mL), respectively. The Fe3O4@SiO2-N3nanoparticles were then dispersed in acetonitrile (50 mL) with the sonication for 30 min, while maintaining an argon atmosphere. In a separate flask, a solution of rhodamine-N-propargyl alkyne derivative (500 mg, 1 mmol) and CuBr(PPh3)3 (50 mg, 0.05 mmol) in acetonitrile (50 mL) was prepared and after being stirred for 30 min, it was added into the Fe3O4@SiO2-N3nanoparticle dispersion with vigorous stirring under an argon atmosphere. After 24 hours, the RBT–Fe3O4@SiO2 nanoparticles were separated using an external magnet and washed twice successively with acetonitrile, methanol and dichloromethane (15 mL), respectively.
Results and Discussion
RBT-functionalized Fe3O4@SiO2 nanoparticles were synthesized by the click chemistry protocol (copper (I)-catalyzed azide alkyne cycloaddition CuAAC, which involved grafting rhodamine-N-propargyl alkyne moieties on the surface of Fe3O4@SiO2 nanoparticles.27 Rhodamine-N-propargyl alkyne was synthesized in good yield from the condensation of rhodamine B with hydrazine to obtain rhodamine hydrazide, followed by nucleophilic substitution with electrophilic propargyl bromide, as shown in Scheme 1. Magnetic nanoparticles (Fe3O4) were prepared from a thermal decomposition process, and the surface of the Fe3O4 nanoparticles were coated with silica via a sol-gel process. Subsequent appending of azide groups to the silica surface, followed by application of the click chemistry protocol (CuAAC) with rhodamine-N-propargyl alkyne afforded RBT-Fe3O4@SiO2 nanoparticles.
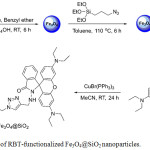 |
Scheme 1: Synthesis of RBT–functionalized Fe3O4@SiO2 nanoparticles. |
The presence of RBT on the surface of the Fe3O4@SiO2 nanoparticles was confirmed by FT-IR spectroscopy, as highlighted in Fig.1. Both Fe3O4@SiO2and RBT -Fe3O4@SiO2 nanoparticles exhibit characteristic Fe-O stretching frequencies at 592 cm-1 and 586 cm-1, respectively. Absorption peaks at 797 cm-1,963 cm-1 and 1104 cm-1 in RBT-Fe3O4@SiO2 nanoparticles are assigned to Si–O stretching vibrations, which are also observed in Fe3O4@SiO2 nanoparticles (797 cm-1, 956 cm-1 and 1101 cm-1). Strong intensity bands at 468 cm-1 and 464 cm-1, ascribed to Si–O–Si bending, are presented in Fe3O4@SiO2 and RBT-Fe3O4@SiO2 nanoparticles, respectively. The absorption bands around 1634 cm-1 in Fe3O4@SiO2, and 1628 cm-1 in RBT-Fe3O4@SiO2 nanoparticles can be attributed to O-H bonds in silanol groups. Furthermore, the FT-IR spectrum of RBT-Fe3O4@SiO2 nanoparticles shows absorption peaks at 635 cm-1, 1397 cm-1, 1490 cm-1 and 1573 cm-1 which can be assigned to C-H bending in aromatic groups, alkyl (C-H) bending, aromatic C=C stretching, and aromatic C=C bending, respectively, consistent with surface functionalization of nanoparticles with rhodamine-triazole entities. TGA analysis of RBT-Fe3O4@SiO2 nanoparticles further confirmed the presence of surface organic functional groups. From the TGA curves in Fig. 2, initial weight loss occurred below 200°C, consistent with removal of adsorbed water. Thermal decomposition of RBT-Fe3O4@SiO2 occurs at 450-560°C with a total weight loss of 10.2%, in contrast to < 1% for both Fe3O4@SiO2 and azide-Fe3O4@SiO2 nanoparticles.
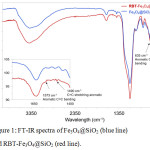 |
Figure 1: FT-IR spectra of Fe3O4@SiO2 (blue line) and RBT-Fe3O4@SiO2 (red line). |
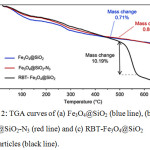 |
Figure 2: TGA curves of (a) Fe3O4@SiO2 (blue line), (b) Fe3O4@SiO2-N3 (red line) and (c) RBT-Fe3O4@SiO2 nanoparticles (black line). |
The magnetic property of Fe3O4@SiO2 nanoparticles was proved by XRD analysis. XRD pattern in Fig. 3 shows the characteristic diffraction peaks of magnetite Fe3O4 nanoparticles at (220), (311), (400), (511), (440) and (533), corresponding to previous reports.28,29 Silica shows a broad peak around 20-28°C suggesting that Fe3O4 nanoparticles were coated with silica.
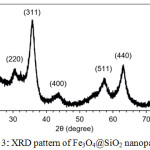 |
Figure 3: XRD pattern of Fe3O4@SiO2 nanoparticles. |
The morphologies of the RBT-functionalized Fe3O4@SiO2 nanoparticles were observed using SEM imaging (Fig.4). Magnetic Fe3O4 nanoparticles are spherical with the diameter approximately 67 nm (Fig. 4a). After the modification, silica-coated Fe3O4 nanoparticles (Fig. 4b) and RBT-functionalized Fe3O4@SiO2 nanoparticles (Fig.4c) also remain spherical, but they have larger sizes as expected from the addition of surface coatings, respectively. The size of RBT-Fe3O4@SiO2 nanoparticles was elucidated by TEM image. Fig. 4d showed that the average diameter of the RBT-Fe3O4@SiO2 nanoparticles was about 155 nm. EDX analysis and elemental mapping of the Fe3O4@SiO2 nanoparticles provides a further insight into their composition (Fig. 5), with the elemental distribution of iron (Fe) and silica (Si) highlighted in Fig. 5b. The atomic percentages of carbon (C, 62.73%), oxygen (O, 30.06%), silica (Si, 4.33%), and iron (Fe, 2.87%) for RBT-Fe3O4@SiO2 nanoparticles are indicative of the existence of organic and silica surface layers, as shown in Fig. 5c.
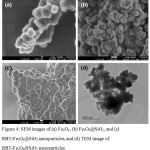 |
Figure 4: SEM images of (a) Fe3O4, (b) Fe3O4@SiO2, and (c) RBT-Fe3O4@SiO2 nanoparticles, and (d) TEM image of RBT-Fe3O4@SiO2 nanoparticles.Click here to view figure |
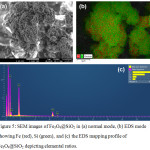 |
Figure 5: SEM images of Fe3O4@SiO2 in (a) normal mode, (b) EDS mode showing Fe (red), Si (green), and (c) the EDS mapping profile of Fe3O4@SiO2 depicting elemental ratios. |
The selectivity of RBT-Fe3O4@SiO2 nanoparticles towards sensing of heavy metal ions (Cu2+, Ni2+, Hg2+, Co2+, Fe2+, Fe3+ and Pb2+) in MeOH/H2O (9:1, v/v) was investigated by UV absorption and fluorescence measurements. While initially exhibiting colorless, the RBT-Fe3O4@SiO2 solutions exhibit a visible color change on the addition of metal ions, becoming pink in the presence of Cu2+, Co2+, Ni2+ ions, and pink-orange when challenged with Hg2+, Pb2+ and Fe3+ ions (Fig. 7b). However, no changes result from the presence of Fe2+ ion. From Fig. 7a, the RBT-Fe3O4@SiO2 solutions exhibit an absorption maximum at 554 nm when exposed to all of the above metal ions, with Fe3+ ion resulting in the highest absorption intensities. Fluorescence spectra in Fig. 8a indicate that the RBT-Fe3O4@SiO2(control) solution are only weakly fluorescent on excitation at 530 nm. Nevertheless, the addition of metal ions, with the exception of Fe2+, results in significant fluorescence enhancements, with maximum emission wavelengths at 572 nm on addition of Co2+, 574 nm for Cu2+ and Hg2+, 576 nm for Ni2+, 578 nm for Fe3+, and 580 nm for Pb2+ ions. Furthermore, fluorescence enhancement of the RBT-Fe3O4@SiO2solution displayed 1.5-fold upon the addition of Cu2+ in MeOH/H2O (9:1, v/v) by excitation at 530 nm, as shown in Fig. 8b. In case of Fe3+ ion, fluorescence emission revealed 0.8-fold compared to the absence of metal ions because of fluorescence quenching effect of Fe3+ ion. From these results, the RBT-Fe3O4@SiO2nanoparticles can act as a “naked-eye” colorimetric and fluorescent sensor for certain heavy metal ions (Cu2+, Hg2+, Co2+, Fe3+ and Pb2+).
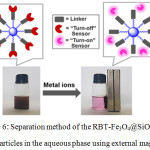 |
Figure 6: Separation method of the RBT–Fe3O4@SiO2 nanoparticles in the aqueous phase using external magnet. |
 |
Figure 7: (a) UV-absorption spectra of a dispersion of RBT-Fe3O4@SiO2 (20 mg) in MeOH/H2O (9:1, v/v) in the presence of various metal ions (1 mM), and (b) |
a bar graph showing the relative absorbance (554 nm) of RBT-Fe3O4@SiO2 (20 mg) in the presence of these metal ions (1 mM), in MeOH/H2O (9:1, v/v); Inset: Color changes of RBT-Fe3O4@SiO2 (20 mg) dispersions on the addition of metal ions (1 mM), in MeOH/H2O (9:1, v/v).
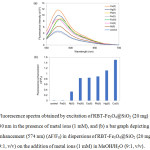 |
Figure 8: (a) Fluorescence spectra obtained by excitation of RBT-Fe3O4@SiO2 (20 mg) in MeOH/H2O (9:1, v/v) at 530 nm in the presence of metal ions (1 mM), and (b) |
a bar graph depicting the relative fluorescence enhancement (574 nm) (DF/F0) in dispersions of RBT-Fe3O4@SiO2 (20 mg) in MeOH/H2O (9:1, v/v) on the addition of metal ions (1 mM) in MeOH/H2O (9:1, v/v).
Due to the fluorescence enhancement being greatest in the case of Cu2+, the fluorescence response of the RBT-Fe3O4@SiO2 nanoparticles to this metal ion was investigated in more detail using titration experiments (Fig. 9). From the fluorescence spectra in Fig. 9a, increasing the Cu2+ concentration results in fluorescence enhancements, with the maximum intensity being reached at 800 mM. Excitation at 530 nm results in a linear relationship (Fig. 8b) (y = 82.986X + 8677.2, R2 = 0.9909) at 574 nm between fluorescence intensity and Cu2+ concentration (range 100-800 mM). The detection limit was determined to be 9.8 mM based on 3s/S, where s is the standard deviation of the fluorescence intensity of the RBT-Fe3O4@SiO2 solutionand S is the slope of the calibration curve. Moreover, naked eye color changes in the RBT-Fe3O4@SiO2dispersion were observable for Cu2+ ion concentrations > 50 mM, as shown in Fig. 9c.
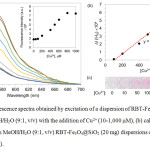 |
Figure 9: (a) Fluorescence spectra obtained by excitation of a dispersion of RBT-Fe3O4@SiO2 |
(20 mg) at 530 nm in MeOH/H2O (9:1, v/v) with the addition of Cu2+ (10-1,000 mM), (b) calibration curve and (c) color changes in MeOH/H2O (9:1, v/v) RBT-Fe3O4@SiO2 (20 mg) dispersions on the addition of Cu2+ (10-1,000 mM).
The binding mechanism of Cu2+ to RBT-Fe3O4@SiO2 nanoparticles in MeOH was further investigated by ESI–MS analysis, with the results shown in Fig. 10. As indicated above, the addition of these ions results in color changes fluorescence emission, both of which are the result of metal ion promoted ring-opening of the spirolactam ring in rhodamine.19 The mass spectrum of the RBT-Fe3O4@SiO2 solution in the presence of Cu2+ (in MeOH) displayed a new molecular ion peak at m/z 457.2615, which is suggestive of formation of a rhodamine methyl ester (calcd for C29H33N2O3457.2486). This outcome is consistent with rhodamine ring–opening followed by hydrolysis, as postulated previously.27
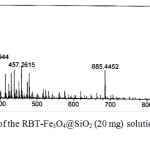 |
Figure 10: Mass spectrum of the RBT–Fe3O4@SiO2 (20 mg) solution upon the addition of Cu2+ in MeOH. |
Conclusion
We have successfully synthesized rhodamine-triazole functionalized Fe3O4@SiO2 nanoparticles, based on the click chemistry approach. Upon addition of heavy metal ions (Cu2+, Co2+, Ni2+, Hg2+, Fe3+, and Pb2+), the solutions of these nanoparticles exhibit distinct naked eye color changes (maximum absorption wavelength 552 nm), and intense fluorescence emissions at 574 nm. For Cu2+, the ion displaying optimum binding behavior, the limit of detection was found to be 9.8 mM with fluorescence responses showing a linear correlation with Cu2+ concentration (range 100-800 µM).
Conflict of Interest
There is no conflict of interest.
Acknowledgements
This work was financially supported by the Institute of Research and Development, Rajamangala University of Technology Thanyaburi (Project No. NRF62D0602). We wish to thank Assoc. Prof. Dr. Palangpon Kongsaeree (Department of Chemistry, Mahidol University) for experimental supports and Assoc. Prof. Dr. Christopher Smith (Kamnoetvidya Science Academy) for any suggestion. We would also like to thank the Kamnoetvidya Science Academy (KVIS) and Vidyasirimedhi Institute of Science and Technology (VISTEC) for use of equipment for characterization purposes.
References
- Soylak, M.; Divrikli, U.; Saracoglu, S.; Elci, L. Environ. Monit. Assess. 2007, 127, 169-176.
- Giokas, D. L.; Tsogas, G. Z.; Vlessidis, A. G.; Karayannis, M. I. Anal. Chem. 2004, 76, 1302-1309.
- Dressler, V. L.; Pozebon, D.; Curtius, A. J. Spectrochim. Acta B. 1998, 53, 1527-1539.
- Lu, Y.; Liang, X.; Niyungeko, C.; Zhou, J.; Xu, J.; Tian, G. Talanta 2018, 178, 324-338.
- Formica, M.; Fusi, V.; Giorgi, L.; Micheloni, M. Coord. Chem. Rev. 2012, 256, 170-192.
- Zhang, J.; Zhai, S.; Li, S.; Xiao, Z.; Song, Y.; An, Q.; Tian, G. Chem. Eng. J. 2013, 215–216, 461-471.
- Bao, S.; Tang, L.; Li, K.; Ning, P.; Peng, J.; Guo, H.; Zhu, T.; Liu, Y. J. Colloid Interface Sci. 2016, 462, 235-242.
- Meng, C.; Zhikun, W.; Qiang, L.; Chunling, L.; Shuangqing, S.; Songqing, H. J. Hazard Mater. 2018, 341, 198-206.
- Wang, J.; Zheng, S.; Shao, Y.; Liu, J.; Xu, Z.; Zhu, D. J. Colloid Interface Sci. 2010, 349, 293-299.
- Zhang, S.; Zhang, Y.; Liu, J.; Xu, Q.; Xiao, H.; Wang, X.; Xu, H.; Zhou, J. Chem. Eng. J. 2013, 226, 30-38.
- Wang, Z.; Xu, J.; Hu, Y.; Zhao, H.; Zhou, J.; Liu, Y.; Lou, Z.; Xu, X. J. Taiwan Inst. Chem. Eng. 2016, 60, 394-402.
- Villa, S.; Riani, P.; Soggia, F.; Magi, E.; Canepa, F. J. Nanoparticle Res. 2019, 21, 44.
- Hakami, O.; Zhang, Y.; Banks, C. J. Water Res. 2012, 46, 3913-3922.
- Ma, T.; Lv, Y.; Liu, H.; Lv, Y.; Tian, Z. J. Nanoparticle Res. 2013, 15, 1933.
- Zhu, B.; Zhao, J.; Yu, H.; Yan, L.; Wei, Q.; Du, B. Chem. Eng. J. 2013, 219, 411-418.
- Tang, Y.; Liu, Y.; Qin, Y.; Xu, Y.; Qian, X.; Zhu, W. J. Colloid Interface Sci. 2016, 479, 7-14.
- Heidari, A.; Mir, N. J. Fluores. 2017, 27, 659-667.
- Kim, K. T.; Yoon, S. A.; Ahn, J.; Choi, Y.; Lee, M. H.; Jung, J. H.; Park, J. Sensors Actuat. B– Chem. 2017, 243, 1034-1041.
- Chen, X.; Pradhan, T.; Wang, F.; Kim, J. S.; Yoon, J. Chem. Rev. 2012, 112, 1910-1956.
- Wang, B.; Hai, J.; Liu, Z.; Wang, Q.; Yang, Z.; Sun, S. Angew. Chem. Int. Ed. 2010, 49, 4576-4579.
- Peng, X.; Wang, Y.; Tang, X.; Liu, W. Dyes Pigm. 2011, 91, 26-32.
- Xu, Y.; Zhou, Y.; Ma, W.; Wang, S.; Li, S. J. Nanoparticle Res. 2013, 15, 1716.
- Tan, J.; Wei, X.; Chen, J.; Sun, P.; Ouyang, Y.; Fan, J.; Liu R. Spectrochim. Acta A. 2014, 133, 403-410.
- Sun, Z. B.; Guo, D.; Li, H. Z.; Zhang, L.; Yang, B.; Yan, S. Q. Rsc Adv. 2015, 5, 11000-11008.
- Lau, Y. H.; Rutledge, P. J.; Watkinson, M.; Todd, M. H. Chem. Soc. Rev. 2011, 40, 2848-2866.
- Xu, Z.; Shen, C.; Hou, Y.; Gao, H.; Sun, S. Chem. Mater. 2009, 21, 1778-1780.
- Wechakorn, K.; Prabpai, S.; Suksen, K.; Kanjanasirirat, P.; Pewkliang, Y.; Borwornpinyo, S.; Kongsaeree, P. Luminescene 2018, 33, 64-70.
- Lei, W.; Liu, Y.; Si, X.; Xu, J.; Du, W.; Yang, J.; Zhou, T.; Lin, J. Phys. Lett. A 2017, 381, 314-318.
- Xu, J.; Yang, H.; Fu, W.; Du, K.; Sui, Y.; Chen, J.; Zeng, Y.; Li, M.; Zou, G. J. Magn. Magn. Mater. 2007, 309, 307-311.

This work is licensed under a Creative Commons Attribution 4.0 International License.
![]()
A New Edition of Web of Science
Journal Impact Factor
2022: 0.5
Five Year: 0.8
Journal is Indexed in

Cabells Whitelist
![]()


