Investigation of Water Quality Index of River Noyyal and Its Connected Ponds Coimbatore Tamilnadu India
M. Jeyaraj*1 , A. Indhuleka1 and C. Arunpaul2
1Department of Chemistry Sri Krishna College of Engineering and Technology, Coimbatore, Tamilnadu, India 641 008, India.
2Department of Physics Sri Krishna College of Engineering and Technology, Coimbatore, Tamilnadu, 641 008, India.
Corresponding Author E-mail: jeyaraja100@gmail.com
DOI : http://dx.doi.org/10.13005/ojc/350328
Article Received on : 19-03-2019
Article Accepted on : 01-05-2019
Article Published : 03 May 2019
This investigation deals with the determination of various physico-chemical and biological parameters of surface water quality of river Noyyal and its connected ponds at Coimbatore, India. Based on their significance, the sampling locations were selected. There are five sampling locations were selected like river Noyyal at sorce (S1), Perur Lake, (S2), Ukkadam Pond (S3), Singanallur Lake (S4) and Sulur Pond (S5), and samples were collected from each locations at river Noyyal basin in and around Coimbatore district. The surface water quality index determination is prerequisite and essential. In this present work, from different methods of water quality determination, the most commonly used index of National Sanitation Foundation water quality index (NSF-WQI) has been followed. The physico-chemical and biological parameters such as dissolved oxygen, faecal coliforms counts, pH, biochemical oxygen demand, phosphate, nitrates, turbidity, and total dissolved solids were investigated. Except in Noyyal river at source (S1) all the measured parameters are showed to be very high compared to limits suggested by WHO particularly during summer season and thereby it is not suitable for public use.
KEYWORDS:Anthropogenic Activities; Physico-Chemical Characteristics; River Noyyal in Coimbatore District; WQI
Download this article as:| Copy the following to cite this article: Jeyaraj M, Indhuleka A, Arunpaul C. Investigation of Water Quality Index of River Noyyal and Its Connected Ponds Coimbatore Tamilnadu India. Orient J Chem 2019;35(3). |
| Copy the following to cite this URL: Jeyaraj M, Indhuleka A, Arunpaul C. Investigation of Water Quality Index of River Noyyal and Its Connected Ponds Coimbatore Tamilnadu India. Orient J Chem 2019;35(3). Available from: https://bit.ly/2UZoYQy |
Introduction
The adverse effect of water pollution is a major environmental concern on both nature and the human beings. The industrial, domestic, agricultural and hospital waste water are directly discharged without any treatment of effluents on the surface water.1 Water chemistry is controlled by several anthropogenic and natural factors. Nowadays, along the river basins the largest cities with highly developed industry are constructed. As a result of industrial production huge amounts of hazardous wastes are regularly come out and spread to the environment due to improper storage and discharged activities. The availability of fresh water is vital for drinking, cultivation, and ensures the sustainable increase of crop yield. Surface water quality degradation is a critical worldwide environmental problem.2,3
Water qualities play a significant role in determining both the biological environment and public health.4-5 Fresh water is a key resource for economic, social and human development.6 The degradation of water quality resulting from point and nonpoint sources pollution is a global environmental issue.2,7 Agricultural activities such as deforestation, irrigation, pesticide use, drainage, enrichment of soil and animal waste from cattle populations will have consequences for the quantity and quality of water in the lakes, ponds, rivers and in the catchment.8,9 This investigation throws light on the present status of the surface water quality of river Noyyal and its connected ponds around Coimbatore district India using National sanitation Foundation Water Quality Index (NSF-WQI) along with modified NSF-WQI method.
Study Area
The river Noyyal originates in the Vellingiri hills and passes through Coimbatore, Tirupur, Erode and Karur districts of western Tamilnadu before its convergence with River Cauvery at Noyyal hamlet in Karur district. The latitude and longitudes of the Noyyal River basin are covered within the range of 100°C 56’- 110°C 19’ North and 760°C 41’- 770°C 56’ East respectively. The width of the basin is averagely 25 km. But the river has 35 km width in the central part of the basin. The total area covered by the basin is 3510 square km. The Noyyal is a seasonal river having a good flow during the South-West and North-East monsoons that bring rains to the catchment area. Due to this, flash floods occur often. Except these short rainy seasons, most of the time, the flow is meager throughout the year.10,11
Perur Lake, sampling station 2 is situated 25 km from station 1 and 5 km above Coimbatore city. In the stretch between station 1 and 2, the agricultural run-off and animal waste from the livestock sheds are the only contaminants that are discharged to the station 2 during rainy season due to surface runoff.12
Sampling station 3, Ukkadam pond also known as Coimbatore big lake is situated 5 km below Perur Lake and 6 km above Singanallur Lake. This Lake is located North of the Noyyal River and is fed by the channels originating from Coimbatore anicut on the river.
It is situated near a fish market, taxi stand and a bus-stand, and is a recipient of different industrial chemicals, municipal solid waste and urban sewage. Approximate area under encroachment as per PWD is around 4.047 hectares. The adequate quantity of water is swamped into the lake from Noyyal River during monsoon season and thereby fishing activities are carried out by fisherman.13
Sampling station 4, Singanallur Lake is located 14 km above the Sulur Lake. It has three major inlets one from River Noyyal, and two sewage drains from Sanganur and Kallimadai, one weir dam and two sluices act as outlets for the lake. A railway track connecting Podanur and Irugur passes through this lake. It has a depth of 13.95 feet with capacity of the lake is 52.27 mc.ft.14 Drainages from sanganur sewage, municipal solid waste and industrial effluents are the major sources of pollutants for this lake.
Sampling station 5, Sulur pond also known as Sulur Lake is situated 14 km below Singanallur Lake and 25 km East of Coimbatore city. During rainfall season the lake receives flooded water from the catchment areas of Noyyal River. The maximum depth of the pond is 13.05 feet and the area is about 0.480 sq.km. The total water holding capacity of the pond is 32.21 mcft. Nearly 750 acres of Sulur village gets irrigation facilities from this pond.15 The major cause of pollution is due to domestic solid waste, agricultural activity and construction debris.
Material and Methods
Collection of Samples
The sampling points were selected in both urban and rural areas. The samples were collected from five stations in and around Coimbatore district viz., river Noyyal at source (S1), Perur Lake (S2), Ukkadam pond (S3), Singanallur Lake (S4) and Sulur pond (S5) with meticulous care in double stoppered polythene containers, which are used for physico-chemical analysis. The sampling was carried out in the study area, from five open wells in the rainy and summer seasons for the year 2018.
Chemicals and Reagents
Analytical grade (AR) chemicals and reagents were used in the study. Double distilled or deionised water was used for the preparation of stock solutions. For cleaning and rinsing of apparatus, double distilled water was used. The permissible limits as per IS were followed.
Methods of Analysis
Following are the methods used for the determination of the parameters under study.16-18
Table 1: Analysed Parameters and Analytical Methods Employed.
|
S.No |
Parameter |
Units |
International Standards |
Analytical Methods |
|
1 |
Water Sampling |
– |
– |
VON DORN water sampling method16, 17 |
|
2 |
Colour |
Hazen |
Colourless |
Jintometer |
|
3 |
Odour |
– |
Odourless |
– |
|
4 |
pH |
– |
6-5-8.5 |
Digital pH meter (Systronics 361) |
|
5 |
DO |
mg/L |
4.-0-6.0 |
Winkler’s Titrimetric method |
|
6 |
BOD |
mg/L |
< 4.0 |
Winkler modified titration method |
|
7 |
Phosphate |
mg/L |
0.10 |
Digestion method (H2SO4+ HNO3) |
|
8 |
Nitrate |
mg/L |
< 10.0 |
Brucine method |
|
9 |
Turbidity |
NTU |
< 5.0 |
Nephelometer (Systronics, 132) |
|
10 |
TDS |
mg/L |
< 500 |
Electronic method (Systronics, 308) |
|
11 |
Faecal Coliform Counts |
MPN/100 ml |
10MPN/100 ml |
Multiple tube fermentation method |
|
12 |
Temperature |
°C |
– |
Direct, Mercury thermometer |
Results and Discussion
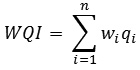
The eight water quality parameters are used to calculate overall water quality index of river Noyyal and its connected ponds using NSF-WQI and MNSF-WQI during rainy and summer season of 2018 are given in Tables 2 and 3. The eight resulting values were then added to an overall water quality index.12,19
WQI = 0.19 DO + 0.18 FC + 0.12 pH + 0.12 BOD + 0.11 Total phosphate + 0.11 Nitrates + 0.09 Turbidity + 0.08 Total solids.
Modified NSF Water Quality Index Formula (MNSF)
Modified water quality index based on six water quality parameters, which are suitable to surface waters in the western districts of Tamil Nadu. In this method, the weighing factor of temperature, biological oxygen demand (BOD) and total phosphates were distributed over other parameters. In the NSF formula, the contributing factor of BOD (0.11), total phosphates (0.10) and temperature (0.10), were distributed to the other parameters such as dissolved oxygen (DO), faecal coliforms (FC), pH, total nitrates (TN), turbidity (TUR) and total solids (TS) by using the mathematical principle of proportion and summation as follows.
WQI={[(0.17+0.31/0.69 ×0.17)] DO +[(0.16+0.31/0.69×0.16) FC +[(0.11+0.31/0.69×0.11)pH +[(0.10+0.31/0.69 ×0.10)]TN +[(0.08+0.31/0.69 ×0.08)] TUR+[(0.07 +0.31/ 0.69 ×0.07)] TDS}.
WQI=0.24 DO + 0.23 FC + 0.16 pH +0.14 TN +0.13 TUR +0.10 TDS.
The above equation is obtained by adding the resulting water quality characteristics.
Water quality index was calculated for the pond water connected with River Noyyal using NSF-WQI formula without modification and the same after redistributing the weighing factors of BOD, temperature and total phosphates to other parameters according to their weightage.20
Table 2: Values of Water Quality Parameter and Water Quality Index of River Noyyal Connected Ponds during Summer Season (2018).
|
S. No. |
Test Parameters |
Unit |
S1 |
S2 |
S3 |
S4 |
S5 |
|
1 |
DO |
% Saturation |
94.00 |
87.00 |
86.00 |
84.00 |
81.00 |
|
2 |
Faecal Coliforms |
MPN/100 ml |
4.00 |
24.00 |
85.00 |
119.00 |
128.00 |
|
3 |
pH |
pH units |
7.80 |
8.00 |
8.14 |
9.20 |
10.90 |
|
4 |
BOD |
mg/L |
0.90 |
3.50 |
4.20 |
5.50 |
8.60 |
|
5 |
Total Phosphates |
mg/L |
0.30 |
1.40 |
1.65 |
1.80 |
2.10 |
|
6 |
Nitrates |
mg/L |
0.50 |
4.00 |
4.80 |
5.10 |
7.50 |
|
7 |
Turbidity |
NTU |
2.00 |
18.00 |
22.00 |
32.00 |
43.00 |
|
8 |
TDS |
mg/L |
97.00 |
437 |
680 |
1250 |
1800 |
|
Overall WQI |
NSF |
91.00 |
68.00 |
62.00 |
61.50 |
56.00 |
|
|
MNSF |
91.50 |
74.00 |
67.00 |
65.00 |
61.00 |
||
Table 3: Values of Water Quality Parameter and Water Quality Index of River Noyyal Connected Ponds during Rainy Season (2018).
|
S. No. |
Test Parameters |
Unit |
S1 |
S2 |
S3 |
S4 |
S5 |
|
1 |
DO |
% Saturation |
95.00 |
87.50 |
86.00 |
84.50 |
83.00 |
|
2 |
Faecal Coliforms |
MPN/100 ml |
2.50 |
28.00 |
45.00 |
54.00 |
82.00 |
|
3 |
pH |
pH units |
7.50 |
7.70 |
7.80 |
9.10 |
9.50 |
|
4 |
BOD |
mg/L |
0.60 |
2.40 |
3.55 |
4.50 |
6.50 |
|
5 |
Total Phosphates |
mg/L |
0.20 |
1.20 |
1.50 |
1.72 |
1.90 |
|
6 |
Nitrates |
mg/L |
0.40 |
3.00 |
4.50 |
4.80 |
6.50 |
|
7 |
Turbidity |
NTU |
1.50 |
16.00 |
20.00 |
28.50 |
34.00 |
|
8 |
TDS |
mg/L |
88.00 |
476 |
780 |
800 |
1200 |
|
Overall WQI |
NSF |
92.20 |
72.70 |
65.00 |
62.50 |
60.50 |
|
|
MNSF |
93.00 |
78.00 |
70.50 |
68.50 |
64.50 |
||
NSF = National Sanitation Foundation.
MNSF = Modified National Sanitation Foundation.
The following points were observed when comparing the values of various water quality parameters from S1 to S5. The average values of eight water quality parameters using NSF-WQI and Modified NSF-WQI during summer and rainy seasons for the year of 2018 were presented in Tables 2 and 3. The graphical representation of water quality parameters (WQP) and overall water quality index (WQI) of river Noyyal and its connected ponds during summer and rainy season of 2018 are also given in figures 1-4.
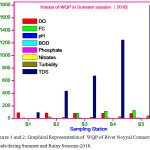 |
Figures 1 and 2: Graphical Representation of WQP of River Noyyal Connected Ponds during Summer and Rainy Seasons-2018. |
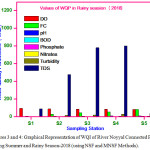 |
Figures 3 and 4: Graphical Representation of WQI of River Noyyal Connected Ponds during Summer and Rainy Season-2018 (using NSF and MNSF Methods). |
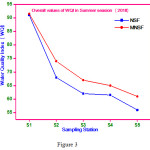 |
Figure 3 |
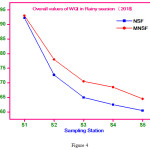 |
Figure 4 |
The dissolved oxygen plays a chief role for sustaining the life of aquatic organisms.21 The value of dissolved oxygen (% saturation) decreased significantly from station 1 to station 5. The value of DO decreased 13 units for summer season and 12 units for rainy season during the year of 2018. The reason for decrease in dissolved oxygen 94 % to 81 % during summer season and 95 to 83 % during rainy season is owing to the discharge of domestic sewage and spinning mill wastes into the Sulur Lake (S5). Iqbal et al.22 also reported that the content of dissolved oxygen was found to be high during rainy season than summer in Rawal Lake, Pakistan. In station 5, it is found that agricultural run-off and the population of livestock wastes are also discharged in the river Noyyal and its connected ponds. The aquatic communities especially fish populations are affected on the whole, due to low percentage of dissolved oxygen particularly during spawning period because the respiratory system requires dissolved oxygen to breath.23,24
The presence of faecal coliform bacteria is an indication of presence of disease producing microorganisms in the water bodies. The faecal coliforms count has increased from S1 to station S5 during both the seasons. The faecal matter of animals and humans are the major contaminants in water supplies. In this study, the counts of faecal coliform has increased from 4 to 128 MPN/100 ml (124 numbers) and 2.50 to 82 MPN/100 ml (80 numbers) during summer and rainy seasons respectively, from station 1 to station 5. The most significant variation of faecal coliform counts in station 5 during summer seasons are majorly due to the free flow of domestic and industrial sewage into the river. In this stretch, seasonal fluctuation was observed on the counts of faecal coliform during summer and rainy seasons, as reported by Tupe et al.25 and Sharma et al.26 in their works. The high count of faecal coliforms in water shows pollution either by faecal substance of sewage or warm-blooded animals.27
In potable water, the value of pH measures the hydrogen ions concentration present in the water and indicates the intensity of alkalinity and acidity. The range of pH values from station 1 to station 5 shows significant change. In all these samples, pH value ranged between 7.50 and 10.90. So the waters in stations S2, S3, S4 and S5 are more alkaline in both the seasons due to alkalinity of effluents. The results obtained from analysis of water samples of river Noyyal at various stations in the study areas are shown in Tables 2 and 3. Generally, the value of pH in upstream would be less alkaline than downstream. Rhythm Aggarwal et al.28 also reported the increased alkalinity of water in Kaushalya River due to agricultural run-off and domestic sewage containing ammoniacal complexes.
Similarly, the concentration of biochemical oxygen demand has increased from station 1 to station 5 during both summer (0.90 to 8.60 mg/L) and rainy (0.60 to 6.50 mg/L) seasons. The lowest BOD in river Noyyal at station 1 (S1) 0.90 mg/L and 0.60 mg/L was observed during summer and rainy season, respectively and the highest value of BOD was observed in station 5 (S5) 8.60 mg/L and 6.50 mg/L during summer and rainy season, respectively. The much variation of the biochemical oxygen demand values in station 5 during both the seasons may be due to release of domestic sewage, agricultural waste and industrial effluents into the river Noyyal connected Sulur pond. From this observation, we can say that the value of BOD increases to a definite extent only.
The increased amount of nitrate and phosphate in station 5 indicates the mixing of inorganic fertilizers such as N, P, K used for agricultural activities. In this investigation, the amount of phosphate in river Noyyal and its connected was found to be ranging from 0.20 to 2.10 mg/L. When compared to other stations, the station 5 showed high concentration of phosphate content during both summer and rainy season. The high concentration of phosphate in S2, S3, S4 and S5 may be due to animal and human waste that are blushed into water ways, either from surface runoff and poorly treated industrial waste that carries phosphate into the river which eventually has a significant effect on the water quality of river.29 This variable phosphate values were also reported by Mishra et al.30 at different sites of River Ganga connected tanks based on seasonal variations. The nitrate concentration in surface water samples ranged between 0.50 to 7.50 mg/L during rainy and summer season, respectively. The amount of nitrate found to be high at Sulur pond (S5) 6.50 to 7.50 mg/L compared to Singanallur Lake (S4) 4.80 to 5.10 mg/L and Ukkadam pond (S3) 4.50 to 4.80 mg/L Perur Lake (S2) 3.00 to 4.00 mg/L and source (S1) 0.40 to 0.50 mg/L during rainy and summer season, respectively.
There is also considerable increase in water turbidity from station 1 to station 5. Turbidity is an optical property causing scattering of light rather than transmission with no change in direction. When more turbidity is present in water, it is unsuitable for water supplies like drinking and it affects various industrial products.
High turbidity can hinder the effects of sterilization against microbes and support bacteriological growth31. The microbiological quality of water is significantly affected by the turbidity present in the water32. In this study, the water from river Noyyal at source (S1) has acceptable turbidity 1.50 NTU and 2.00 NTU during rainy and summer season, respectively. While other samples at S2, S3, S4 and S5 shows 16.00 NTU and 18.00 NTU, 20.00 NTU and 22.00 NTU, 28.00 NTU and 32.00 NTU and 34.00 NTU, 43.00 NTU during rainy and summer season are shown in Tables 2 and 3. The increased value of turbidity in station 5 indicates the presence of colloidal and suspended matters like silt, sediment, clay, finely divided organic and inorganic substances. In this stretch, the variations of all these measured parameters are found to be more pronounced in summer than in rainy season.
The water containing more dissolved solids has lower palatability and may cause on adverse biological reaction in humans. High concentrations of minerals present in water make water unfit for many applications.33,34 As per the suggestion given by WHO the permissible limits of TDS in drinking water is < 500 mg/L.35 In this study, the lowest value of TDS was observed in a range of 88.00 to 97.00 mg/L at station 1 during rainy and summer season, respectively. The highest value was observed in a range 1200 to 1800 mg/L at S5 during rainy and summer season, respectively (Tables 2 & 3). The TDS content in station 5 during summer season compared to other stations significantly increased due to the increased rate of evaporation leaving behind high concentrations of dissolved salts in water. In station 5, the scenario of the human activity shows the presence of small scale industries, which would liberate hazardous pollutants. The pond is also polluted due the discharge of sewage from one of the temple (Lord Muragan Temple) situated on the bank of the river closely to Sulur Pond. The fishing activities in the lake and agricultural practices by farmers nearby water body is also responsible for increasing the pollutant levels in Sulur lake and subsequently decrease the overall water quality index in this station. The overall water quality index value decreased from S1 to S5 as 91.00 to 56.00 (36 units) and 92.20 to 60.50 (32 units) during summer and rainy seasons respectively using NSF-WQI.
Water Quality Parameters using Modified NSF-WQI
A modified water quality index was also calculated using only six water quality parameters excluding temperature, biological oxygen demand (BOD) and total phosphates. The overall WQI values thus obtained are also given in the same Tables 2 to 3 along with NSF-WQI method. From this, we find that the difference in the water quality index values are in the order of 4 to 5 units only, which is very minimal. To know the change in temperature, standardized temperature should be used. Standardized temperature is the average of monthly temperature taken at a particular point at a particular time. It is a time consuming one. Similarly 5 days BOD value has to be calculated after incubation for 5 days. So the new WQI formula worked out (without temperature, BOD and phosphate) can be used to calculate WQI without any time delay and without any serious error.
Conclusion
The physico-chemical and biological parameters of surface water samples of river Noyyal and its connected ponds reveals that most of the parameters are exceed the recommended limits for potable water. In conclusion, surface water quality of River Noyyal and its connected ponds in and around Coimbatore district except station 1 during both summer and rainy seasons is not fit for domestic and agriculture purposes as per drinking water standards described by WHO and BIS guidelines. Form the result of water quality investigation it is obvious that most of the water quality parameters are significantly higher during the summer season than in the monsoon season. The present investigation together recommended that there will be proper execution or implementation of new waste water management systems to provide good quality of water in the urban regions and to ensure availability of safe drinking water from natural water bodies to users. Also, to enhance the water quality of river Noyyal and its connected ponds comprises of complete prohibition on the activities that cause contamination. This will prevent and control the depletion of surface water quality of river Noyyal and its connected ponds from pollution.
Conflict of Interest
There is no conflict of interest.
Acknowledgements
Author M. Jeyaraj is greatly thankful to Mrs. S. Malarvizhi, Chair Person and Managing Trustee, Sri Krishna Group of Institutions, Coimbatore for irrecoverable support and providing the research facilities.
References
- Pastrana Martínez, L.M.; Faria J.L.; Doña Rodríguez, J.M.; Rodríguez, C. F.; Silva, A.M.T. Appl. Catal. B Environ. 2012, 113, 221–227.
- Zielinski, M.; Dopieralska, J.; Belka, Z.; Walczak, A.; Siepak, M.; Jakubowicz, M. Sci. Total Environ. 2016, 548, 307–316.
- Roebeling, P.C.; Cunha, M.C.; Arroja, L.; van Grieken, M.E. Water Sci. Technol. 2015, 72, 730–737.
- Lu, Y.; Song, S.; Wang, R.; Liu, Z.; Meng, J.; Sweetman, A.J.; Jenkins, A.; Ferrier, R.C.; Li, H.; Luo, W.; Wang, T. Environ. Int. 2015, 77, 5–15.
- Shi, P.; Zhang, Y.; Li, Z.B.; Li, P.; Xu, G.C. Catena, 2017, 151, 182–190.
- Pérez-Gutiérrez, J.D.; Paz, J.O.; Tagert, M.L.M. Agric. Water Manag. 2017, 187, 131–139.
- Shoemaker, C.M.; Ervin, G.N.; Diorio, E.W. Ecol. Eng. 2017, 108, 255–262.
- Moss, B. Ecology of Fresh Waters: man and medium, past to future, 3rd ed. Blackwell Science, Oxford, UK, 1998.
- Elliott, S.; Sorrell, B. Lake Managers’ handbook, land–water interactions. Ministry for the Environment, Wellington, New Zealand, 2002.
- Profile of Noyyal River BASIN (www.verypdf.com to remove this watermark).
- Palanivel, M.; Rajaguru, P. Proceedings of the workshop on environmental status of the river Tamil Nadu, 1999, 53, 26-27.
- Jeyaraj, M.; Ramakrishnan, K.; Jaianadhi, A.; Arunachalam, S.; Magudeswaran, P.N. Oriental J. Chem. 2016, 32, 2087-2094.
- Jeyaraj, M.; Ramakrishnan, K.; Arunachalam, S.; Magudeswaran, P.N. Asian J. Chem. 2016, 28, 1469-1479.
- Jeyaraj, M.; Nirmaladevi, G.: Magudeswaran, P.N. Int. J. Res. Develop. Technol. 2014, 2, 2349-3585
- Umavathi, S.; Logankumar, K.; Subhashini, S.; Logaswamy, S. Nat. Environ. Pollut. Technol. 2007, 6, 491-494.
- APHA, APHA- AWWA- WPCE, “Standard method for examination of water and waste water, APHA INC, New York 20th edition, 1998.
- ISI “Methods of sampling and test (physical and chemical) for water and waste water” IS: 3025, India, 1991.
- Charles, R. C. “Operation and control of water treatment process”, World Health organisation monograph series, 49, Geneva, 1969.
- Magudeswaran, P.N. Water Quality Assessment of Noyyal River, Ph.D Thesis Bharathiyar University, Coimbatore, Tamil Nadu, India, 2004.
- Jeyaraj, M. Effect of polluted Noyyal River on its Connected Ponds, Ph.D Thesis Bharathiyar University, Coimbatore, Tamil Nadu, India, 2018.
- Gupta A.K.; Mishra, K.; Kumar, P.; Singh, C.; Srivastava, S. Plant Arch. 2011, 11, 297-300.
- Iqbal, J.; Shah, H. M.; Akhter, G. J. Geochemi. Explor. 2013, 125, 94-101.
- Jammel, A. A. Pollut. Res. 1998, 17, 111-114.
- E. Huge, J. Water Resour. Res. 1987, 123, 2227-2238.
- Tube S. G.; Jegadev R. S.; Zinzarde S. S.; Gunale V. R.; Patwardhan B. K. J. Environ. Poll. 2001, 8, 1-6.
- Sharma C.; Deka D. K.; Bhattacharya K. G. Indian J. Environ. Prot. 1995, 15, 850-852.
- Blume K. K.; Macedo J. C.; Meneguzzi, A.; Silva L. B.; Quevedo D. M.; Rodrigues M. A. S. Braz. J. Biol. 2010, 7, 1185-1193.
- Aggarwal, R.; Aroraet, S. Int. J. Sci. Tech. Res. 2012, 8, 52-68.
- Indian standards tolerance limits for Inland surface water subjected to pollution, 1982.
- Mishra, A.; Tripathi, B. D. Cuur. World Environ. 2007, 2, 149-154.
- Manivannan, A.; Jerald M.; Rashmi, C.; Narendhirakannan R. T. Int. Res. J. Environ. Sci. 2013, 2, 68-71.
- Kateria, H. C.; Jain O. P. Indian J. Environ. Prot. 1995, 15, 539-571.
- Trivedi, R. K.; Goel P. K. “Chemical and biological methods for water pollution studies”, Environment publication, Karad, Maharashtra, India, 1984.
- APNA, AWWA, CPF, “Standard methods for water and waste water analysis” INC, New York, 14th edition, 1985.
- WHO, Guidelines for drinking Water Quality, Geneva, Switzerland, 2017.

This work is licensed under a Creative Commons Attribution 4.0 International License.
![]()
A New Edition of Web of Science
Journal Impact Factor
2022: 0.5
Five Year: 0.8
Journal is Indexed in

Cabells Whitelist
![]()


