Geochemical Characteristics of Oil and Gas Source of Cenozoic Age of the Western Ciscaucasia
R. N. Mustaev , K. I. Dantsova and V. Yu. Kerimov
Russian State Geological Prospecting University, Mikluho-Maklaya, 23, 117997, Moscow, Russian Federation.
Corresponding Author E-mail: r.mustaev@mail.ru
DOI : http://dx.doi.org/10.13005/ojc/350301
Article Received on : 08-11-2018
Article Accepted on : 06-05-2019
Article Published : 11 May 2019
The article shows the results of geochemical studies of oil and gas source of the Cenozoic age of the western Ciscaucasia. The geochemical characteristics of the organic matter of the Kumsky rocks show a high oil source potential. Qualitative and quantitative changes reflect not only the new formation of hydrocarbons, but also their emigration. A comprehensive study of the organic matter of Khadum rocks using the methods of bituminology, pyrolysis, and chromatography showed that all types of kerogen are developed in them, but organic matter dominates with moderate source potential. The maximum concentrations of TOC and genetic potential are noted within the West Kuban downwarp, as well as in the outcrops in the area of the Adygei protrusion. The improvement of geochemical parameters in these areas is explained by a decrease in the same direction of the terrigenous component in the original organic matter.
KEYWORDS:Bituminology; Geochemical Characteristics; Organic Matter; Pyrolys; Source Potential; Western Ciscaucasia
Download this article as:| Copy the following to cite this article: Mustaev R. N, Dantsova K. I, Kerimov V. Y. Geochemical Characteristics of Oil and Gas Source of Cenozoic Age of the Western Ciscaucasia. Orient J Chem 2019;35(3). |
| Copy the following to cite this URL: Mustaev R. N, Dantsova K. I, Kerimov V. Y. Geochemical Characteristics of Oil and Gas Source of Cenozoic Age of the Western Ciscaucasia. Orient J Chem 2019;35(3). Available from: https://bit.ly/2Ymz4wS |
Introduction
Sedimentary basins of the Crimean-Caucasian region, as well as all basins of folded areas, are characterized by a number of common features of oil and gas formation, associated both with the formation and realization of oil and gas source potential, due to the history of geological development. High tectonic activity ensured the contrast of the relief and the relatively close position of the sources of demolition, a high rate of accumulation of sediments, as well as an intensive supply of nutrients, including from deep subsoil. All this caused a number of features of the formation of oil and gas source sedimentary rocks: a sharp predominance of aleurite-clay rocks and a relatively small proportion of carbonates; the large capacities of the main oil and gas source strata and the huge masses of the initial bioproduction; ubiquitous presence of terrigenous organic matter (OM). The effect of higher vegetation is evident even in relatively deep-sea sediments. Hence the absence of the actual Domanikites, although the Domanikite concentrations of OM are noted in a number of horizons.
The presence of type III kerogen also results in an increased gas generation potential; the considerable depths of the sedimentation basin, which caused a prolonged presence of organic matter in the water column, contributed to its biological and physicochemical degradation, as well as to the formation of organomineral aggregates that retained the labile components of organic matter; The dynamics of water and the complex morphology of the bottom of the basin led to the formation of unstable redox conditions in the sediment and, as a result, large diagenetic OM losses and the extremely uneven (spotty) nature of the distribution of OM and values of oil and gas potential within the age horizons.
The peculiarities of the geological development of the region determined the specificity of the geothermal regime in sedimentary basins, which predetermined a number of features in the realization of the oil and gas source potential, the main of which are as follows: stretched katagenic zonality; a sharp differentiation in the position of the oil window is the deep position of the oil window. Thus, the roof of the oil window is located in the districts at the following depths: Kerch-Taman district – from 4,200 to 4,300 m; Dzhiginsk-Varenikovsk district – from 4,200 to 4,250 m; Levkinsk district – from 3200 to 4000 m; Khadyzhensk district – from 2600 to 3000 m. At the same time, the maximum depth of the roof of the oil window from 4,200 to 4,300 m is noted in areas characterized by the development of mud volcanism and cryptodiapir folds, i.e., where heat is removed from the deep part of the section; high sediment thickness in the center of oil and gas formation; the predominance of montmorillonite in the composition of clay minerals and, as a consequence, a large matrix effect — partial return of generated hydrocarbons; “Fast” subsidence, compensated mainly by clay sedimentation, provoked incomplete return of sedimentation waters, which contributed to the occurrence of abnormally high reservoir pressure and the formation of “closed” oil systems (Maikop series), and also caused a wider range of liquid hydrocarbons than oil window; formation of authigenic oil systems with primary (granular) and secondary (clay) reservoir horizons.
Research Methodology
The complex of research included: determination of the quantity, quality and degree of maturity of OM of rocks using the Rock-Eval pyrolysis method; determination of organic carbon in rocks (TOC,%) by dry burning on an AN-7529 express analyzer after pre-treating the rock with 10% hydrochloric acid, extraction of bitumoids from dispersed organic matter (extraction in Soxhlet apparatus with chloroform for 72 hours); calculation of bitumen ratio (%); coal-carbon research (in the presence of representative vitrinite inclusions). Representative samples of vitrinite were not found in the rock samples studied.
In the geochemistry laboratory of the Russian State University of Oil and Gas As a result of the conducted research, 11 samples of Khadum deposits from 8 fields (areas) of the Western Ciscaucasia were studied.
The Rock-Eval-6 instrument for samples prepared by the standard method (Lopatin and Yemets, 1987) measured TOC, S1, S2, Tmax, Cmin; and calculated the genetic potential of the rock (S1 + S2), HI hydrogen index and oil productivity index PI.
The studied samples are characterized by significant variations in the concentrations of organic matter (TOC) – from 0.85% (South Andreevsk-5) to 3.22% (White River) with an average value of 1.8% TOC.
According to the recommendations of the geologists of the French Institute of Petroleum, the source oil suites can be divided into the following grades in S2 – the number of newly formed micro-petroleum molecules that were formed during catagenesis to a state that ensures cleavage from kerogen during pyrolysis and release into the free phase. Before thermolysis, these molecules were part of kerogen, that is, they were chemically bound to the carbon skeleton of kerogen: S2 <2 mg HC / g of rock – poor, 2 <S2 <5 – medium, 5 <S2 <20 – rich, S2> 20 – very rich.
Pyrolytic studies were performed for samples from outcrops, emissions of mud volcanoes, as well as core samples from wells.
Study Results and Discussion
Interpretation of the pyrolytic studies results of Cenozoic sediments in the Indo-Kuban trough allowed to determine the geochemical characteristics of the oil and gas source of the Cenozoic age of the Western Ciscaucasia.
On the modified Van Krevelen diagram, the samples are very “heap” in the field of the “transition zone” of type II / III kerogen (Fig. 1 a, b), which characterizes the substance as mixed. Dominated III and IV types of kerogen, mainly generating gas and a small part of the dry gas. For emissions of mud volcanoes (Fig. 1c, d) at relatively equal pyrolysis temperatures, the quality of kerogen varies widely from type III to type II. Oxygen indices are high, reaching 300 mg of CO2 / g of rock, indicate active oxidation of organic matter at the fossilization stage.
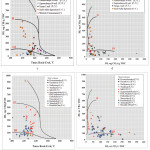 |
Figure 1: Modified Van-Crevelein diagrams of dependences: a) HI from Tmax; b) HI from OI for Cenozoic sediments; c) HI from Tmax; d) HI from OI for the mud volcanoes of the Indolo-Kuban trough. |
The degree of catagenetic transformation of organic matter, according to the values of the pyrolytic parameter Tmax – 410-450°С corresponds to the beginning and the final stage of the oil window MK1-MK3. The P3 sediments of the Western Ciscaucasia fall into the oil window (Fig. 2a). For mud volcanoes, the main part of the Tmax values lies within 405-441°C (Fig. 2b), which is traditionally correlated with the beginning of the oil window, but due to the low degree of conversion OM (PI varies from 0.02 to 0.31) falls into the immature zone.
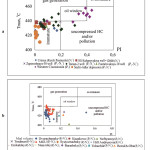 |
Figure 2: Diagram of the ratio of PI productivity index from the maximum pyrolysis temperature Tmax: a) for Cenozoic sediments, b) incl. for mud volcano samples. |
Samples of organic matter from source rocks for Cenozoic deposits have a wide range of hydrocarbon generation potential from satisfactory to excellent. The source rocks of high and very high (excellent) quality are predominant (Fig. 3). The almost direct dependence of TOC and S1 + S2 indicates the syngenetic nature of hydrocarbons. For the reliability of determining the type of kerogen, we used recalculated pyrolytic parameters in atomic ratios and plotted the results of pyrolytic analyzes directly on the Van Crevelen diagram. H/C=0.0014*HI+0.5753, O/C= 0.004*OI+0.0392.
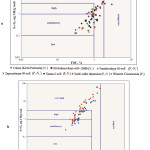 |
Figure 3: Diagram of changes in the total generation potential (S1 + S2) of the total organic carbon TOC: a) for Cenozoic sediments; b) for mud volcanoes. |
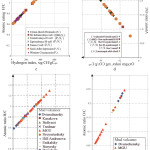 |
Figure 4: Correlation of hydrogen and oxygen indices with atomic ratios: a) – H / C and b) – O / C for Cenozoic sediments, c) – H / C and d) – O / C for mud volcanoes. |
On the graphs of the hydrogen and oxygen indices with atomic ratios H / C and O / C (Fig. 4), a direct relationship is observed. After recalculation to the Van Krevelen diagram, all the samples lay on the evolution curve of types II and III. On the cross-diagram, the samples can also be attributed to the second and third types of kerogen (Fig. 5).
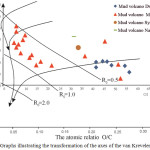 |
Figure 5: Graphs illustrating the transformation of the axes of the van Krevelen diagram. |
On the cross-diagram of a mud volcano of Moscow State University (Fig.5) clearly falls into the oil window.
According to the HI / Tmax diagram, the sediment samples of the Indolo-Kuban deflection are attributed to kerogen of the second and third types, since almost all samples fall into the evolution area of this type of kerogen, after using conversion factors to construct the original Van Crevelin diagram (Fig. 6a), large some of the points are also grouped on the second and third types of kerogen evolution curve, which characterizes the organic matter as mixed. Initially, according to the HI / Tmax diagram, the samples of the Moscow State University mud volcano are attributed to kerogen of the second and third types, since almost all measurement points fall into the evolution region of this type of kerogen, but after using conversion factors to build the original Van Crewelein diagram (Fig. 6b), it is large Some of the points are grouped on the evolution curve of kerogen of the second type.
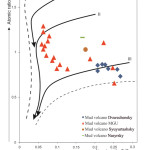 |
Figure 6: Original Van Krevelen diagram illustrating the main types and evolution curves of kerogen types I, II and III. |
Conducted research allowed to distinguish the Cenozoic Age – Kum Formation (Eocene) and the Maikop series (Oligocene – Lower Miocene) as well as local oil source mass: Khadyzhensk, Beloglinsk, Diatomic, Chokrak, and regional oil fields in the Western Ciscaucasus.
Deposits of the Kumsk suite, the formation of which proceeded in a reducing and sharply reducing environment, are represented by sediments differing in the western and eastern parts of the board of the West-Kuban trough. From the west to the station, the Kholmsk section of the Kumsky suite is composed of gray clays with aleurite, less often calcareous impurities and argillite interlayers. Further east, argillites are observed less frequently in the section, to the east of the Psekups Kumsk suite composed of brown and dark brown bituminous marls with admixture of silt material.
The content of TOC, according to N.P. Fadeeva (1973), varies from 0.6 to 11.3% per breed (average 3.3%). The content of TOC in a number of rocks increases from clayey mudstones (2%) to carbonate clays (2.6) and marls (4.6%). Organic matter is enriched with bitumoids (4-16%). On the Utash square (southern side of the trough), the TOC content determined at a depth of 1907m in a sample of the Qumsk suite is 6.44%. The content of bitumoid low – 0.21%. In the elemental composition of the bitumoid carbon (C) is 79.02%, hydrogen (H) is 10.4%, and hetero elements (S + O + N) are 10.6%. The proportion of hydrocarbons, according to component analysis, is on average 0.45 kg / ton. The deposits of the Kumsk suite in the Khadyzhensk region, which occupies the eastern part of the Western trough, are characterized by high TOC contents. on the whole area under consideration – 1.7– 6.3% in the depth interval of 2375-3556 m, the average TOC value is 3.12% maintained over the area of the entire block for depths of 2475-3075 m. The content of bitumoid varies within 0.05 -0.71% per breed (average value – 0.38%). The bitumoid coefficient varies widely – 2.9 – 26.3%, increasing with depth, (average – 11.7%. The carbon (C) in the composition of the bitumoid varies little, being within – 83.5 – 86.4% , the average value is 84.7%, which is more than in the Levkinsk block. The average hydrogen content (H) is 11.3%. The average content of the bitumoid component is 48.7% of oil fractions, 49% asphalt – asphaltenic, 6%. In clays and mudstones, HC varies from 0.1 to 0.7 kg / ton of rock (Novodmitriyevsk area), and in marls the amount of HC reaches 4 kg / ton of rock (area Novodmitrievsk, the North – Kutaisi).
According to the complex geochemical studies, the Khadum deposits of the Maikop series of the Western Ciscaucasia are characterized by relatively high TOC contents and values of the generation potential.
Within the area of the West Kuban deflection in terms of area, the highest concentrations of TOC in the Khadum sediments are observed in the central part of the deflection (Seversk, North-Crimean, Black Sea, etc.), where the average concentrations of TOC are 1.77%. In the western, Taman part of the trough, Corg concentrations decrease and the average TOC content is 1.25% (Taman). In the eastern part of the deflection, the average value of Corg is 1.39% (Martanskaya, Baku, Dysh, Ilych). The highest average values (S1 + S2) are also fixed in the central part of the deflection – 2.02 mg HC / g of rock; in the taman part of the trough, they decrease to 0.95 mg of hydrocarbons / g of rock. Most of the samples studied by the Rock-Eval method are characterized by Tmax values in the range of 410–430 ° C and HI values of about 200 mg HC / g TOC, which suggests the immaturity and “low” quality of the original organic matter (type III-II kerogen) ( Fig. 7a).
On the northern platform board of the West Kuban trough, clay deposits of the Khadum suite were studied in the Cheburgolsk and South Andreevsk areas. Khadum deposits here occur at depths of 3-4 km. The studied clay samples are characterized by TOC values in the range of 0.46-0.89% per rock, an average of 0.73%, i.e. below the clarke values. The content of bitumoid is generally increased (0.5%), the bitumoid ratio is 8.4%.
According to the pyrolysis data on the Cheburgol area, the generation potential at a depth of 2930 m is 1.1 mg of hydrocarbons / g of rock, the peak value of S1 is 0.34 mg of hydrocarbons / g of rock. Tmax value is 437 0С. The hydrogen index (HI) remains low at 98 mg HC / g TOC, the value of the PI productivity index is 0.31, and the TOC is 0.77%.
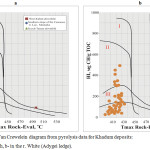 |
Figure 7: Modified Van Crewelein diagram from pyrolysis data for Khadum deposits: a- West Kuban trough, b- in the r. White (Adygei ledge). |
The listed parameters indicate low generation abilities of Khadum deposits in this zone. The explanation for this is that the Khadum deposits on the Cheburgol area were not included in the oil window, the degree of katagenesis corresponds to the end of PK3, i.e., the studied deposits within the platform bend are mainly in the protocatagenesis zone.
Within the limits of the Adygei bulge in the Fars and Belaya Khadum sediments basins, M. Saint-Germes (Saint-Germes, 2000) were studied. The average TOC values (without taking into account the “hurricane” values of the Pshekhsky schists on the Belaya River) here amount to 2.13%, and the values (S1 + S2) – 3.52 mg HC / g of rock. On the modified Van Krevelen diagram (Fig. 7 b), it can be seen that the Khadum deposits in this zone are poorly transformed (Tmax 410-430 ° C) and for the most part belong to type III kerogen. Only single samples of rocks are characterized by a hydrogen index of more than 300 mg of hydrocarbons / g TOC and can be attributed to type II.
For the tectonic zones of the western part of the Scythian plate, there are only a few determinations of the geochemical parameters of the Khadum deposits. This is determined both by their absence in the abbreviated section of the sedimentary cover and by the sanding of the Maikop section. Within the Rostov bulge in the Margaritovsk-1 well, the TOC content in the Khadum sediments is 0.9%, the concentration of the bitumoid is 0.009%, and the value of the bitumoid coefficient is 1.0%. In the junction zone of the Kanev-Berezansk and Dinskoy shafts, the Great TOC content in the Khadum sediments is 1.72%, the bitumoid is 0.039%, and the bitumoid coefficient is 6.0%.
Within the North-West Caucasus, in the Sochi-Adler depression, wells opened Maikop sediments, represented by dark-colored clays and clayey siltstones with sandstone interlayers with a thickness of more than 2 km. According to the pyrolysis data, the content of TOC and (S1 + S2) in the macestinian and hostinsk clays (age analogues of the Khadumsk suite) is 0.38-1.87% (average 0.85%) and 1.6 kg HC / t of rock (Kruglyakova et al., 2002). The content of chloroform bitumoid in rocks according to the data of luminescent-bitumen analysis varies from 0.08 to 0.156%. In the studied sections along the river The amount of TOC varies in the range of 0.67-1.81%, (S1 + S2) = 0.7-5.3 kg HC / t of rock, HI = 76-282 mg of HC / g TOC. Kerogen rocks in this section has a mixed composition and belongs to type II-III (Bazhenova et al., 2006).
In the outcrops of the Loo and Mamayk rivers, the rocks of the Khadum suite are represented by the alternation of dark-colored bituminous carbonate clays (marls) with interlayers of sandstones. The TOC content is 0.08-2.27%, the generation potential (S1 + S2) varies from 0.08 to 7.45 kg HC / t of rock, averaging in both sections (S1 + S2) = 3 kg HC / tons of rocks, which allows us to consider them as source rocks with a moderate generation potential (Fadeeva, Goreva, 2009). The relatively low initial potential of OM of sediments is due to the type of kerogen. In the studied rocks of this region, mixed type II / III kerogen prevails with a hydrogen index of HI = 180-272, an average of 230 mg of HC / g TOC, and only in one clay sample from the section p. Loo it reaches 326 mg HC / g TOC, i.e. actual source matter kerogen type II. Bitumoids are represented by heavy, alcohol-benzene fractions – in almost all samples, alcohol-benzene bitumoid (0.002-0.06%) prevails over chloroform bitumoid (0.0002-0.01%); Such a composition of the bitumoid meets the immature agent.
The transformation of the rocks is low – Tmax is 402-433 ° C, the average is 425 ° C, that is, they are on the PK katagenesis gradation and have practically not yet begun to realize their potential. The productivity index PI = S1 / (S1 + S2), showing the degree of kerogen depletion, is very low and varies for most samples from 0.01 to 0.17, an average of 0.02. However, the processes of weak thermolysis have already begun, which is fixed by the appearance of para-autochthonous hydrocarbons. Compared to the background, they are characterized by relatively lower values of Tmax (402-406оС) and increased – PI (0.16-0.55) and hydrocarbon ratio – βS1 (S1 * 10 / TOC) = 1.25-2.5% (background values of βS1 are 0.08-0.57%, average 0.34%). Thus, the rocks of the Khadum suite in the area of the river. Loo and Mamayk can be considered as potentially oil and gas source with satisfactory and good potential.
A comprehensive study of the organic matter of Khadum rocks using the methods of bituminology, pyrolysis, chromatography and mass spectrometry showed that all types of kerogen are developed in them (Fig. 8), however, OM mixed with moderate source potential dominates. The values of the HI hydrogen index vary in the range of 10–420 mg HC / g TOC, averaging about 100 mg HC / mg TOC. The low values of the hydrogen index are in some contradiction with the chemical, petrographic and facial characteristics of OM of Maikop (Khadum) rocks, for which planktonic algae (dominant dinoflagellates, blue-green, green, less often diatoms) served as the source material. Impurity of terrigenous organic material is quite noticeable in the composition of the total deflection, but the maximum influence of the land was observed only in the sections of the Kerch and Taman Peninsulas and in the northern areas of the Azov-Kuban oil and gas basin. Such a discrepancy in the interpretation of the type OM is explained by the significant adsorbing effect of the mineral matrix consisting of montmorillonite and illite, which can reduce the hydrogen index values by a factor of 2-3; The creators of the pyrolytic method Rock-Eval paid attention to this. This effect is especially pronounced in conditions of weak catagenesis (at the beginning of the oil window). Separate pyrolysis of rock samples and pure kerogen, conducted by employees of the Moscow State University named after M.V. Lomonosov (Saint-Germes et al., 2000), confirmed a similar effect and showed that in the Khadum sediments there is a substance with a high oil source potential (HI 650-750 mg HC / g TOC). In the greater part of the western West Ciscaucasia, the Khadum suite formations are outside the center of oil formation or are incomplete (Bazhenova et al., 2001).
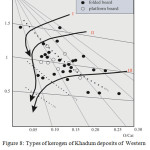 |
Figure 8: Types of kerogen of Khadum deposits of Western Ciscaucasia according to the chemical-bitumen and pyrolytic studies of core, sludge and rock samples. |
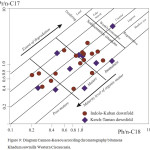 |
Figure 9: Diagram Cannon-Kessou according chromatography bitumens Khadum sawmills Western Ciscaucasia. |
The position of the PK-MK1 boundary corresponding to the beginning of the oil window in the Cenozoic sediments is differentiated.
In the West Kuban trough, the maximum depths of the oil window roof (4.2-4.3 km, current temperature 130-140°C) are observed in the most curved, western part of the trough (Kerch-Taman, Dzhiginsk-Varenikovsk districts), characterized by the development of mud volcanism and cryptodiapiruses structures – in this zone the most intense heat removal from the deep part of the section occurs. In the east direction, the position of the upper boundary of the oil window moves upwards and the highest hypsometric position of the roof of the hearth (2.5-2.6 km, temperature 100-105°C) is noted in the hottest part of the deflection – Khadyzhensk region and on the platform side, where there is an overall reduction in power Maikop sediments. Completion of the oil window in all geochemical parameters in the rocks of the Maikop series (and, accordingly, of the Khadum suite). Western Ciscaucasia occurring at a depth of 5.3 km is not observed, i.e. the center of oil formation in the Cenozoic rocks is about 3 km, which can be considered as a positive factor from the point of view of hydrocarbon generation.
Studying the nature of the distribution of geochemical parameters over the area and sections of the trough showed that, despite the general similarity of the lithological composition, the Maikop deposits differ quite sharply in TOC content and genetic potential (the spread of values is more than an order of magnitude). Maximum concentrations of TOC and genetic potential are noted in the limits of the West Kuban trough (especially in its central part), as well as in the outcropping zone of the Adygei bulge zone (basins of the R. Belaya, Fars, Kuban rivers). The improvement in geochemical indices in the central and eastern parts of the trough is explained by a decrease in the same direction of the terrigenous component in the initial OM (Bazhenova et al., 2001).
For the studied samples, the values of S2 vary between 0.80-8.56 mg HC / g of rock, but most of them fall into the category of “poor” and “medium”. Only the clays of the horizon of the frost beam on the Belaya and Kuban rivers can be classified as “rich” oil source suites. Given the strong dependence of S2 on the degree of katagenesis, this gradation should be approached differentially. Strictly speaking, it can be used to characterize only those breeds that have not yet entered the oil window, namely, the samples selected in the river basin. White (Adygei bulge) and in the eastern regions of the West Kuban trough (North Kutaisi, North Khadyzhensk). A part of the studied samples according to Tmax data (more than 430°С) is already in the oil window (Aleksandrovsk, Seversk, Tamansk), therefore here we can only talk about residual values of S2.
According to the values of the full generation potential (the spread of values in the range of 1.14–8.87 kg of hydrocarbons / ton of rock), the studied samples can be attributed mainly to the “satisfactory” and “high” classes. Again, the clays of the frost beam in the outcrop zones of the North-West Caucasus are identified as “very high”.
The most widespread in the practice of geochemical studies using data from Rock-Eval are various combined graphs, with which you can get the genetic and catagenetic characteristics of kerogen. Among them, first of all, is a graph defining the relationship between HI and OI for different types of kerogen. This diagram is similar in meaning to the well-known diagram of B. Tissot and others, in which three sets of points corresponding to three types of kerogenes are clearly distinguished in the N / C and O / C coordinate systems proposed by Van Krevelen.
According to B. Tissot et al., Type I kerogen is represented mainly by alkane structures with a small admixture of cyclomethylene and aromatic compounds. The starting material for type I kerogen is mainly microalgae and bacteria. It is characteristic of bituminous and combustible shale.
In type II kerogen, cyclic (naphthenic and aromatic) structures predominate. The primary agent that formed type II kerogen is represented by a mixture of algal, grass, and woody debris. It is characteristic, in particular, of the Lower Toar of the Paris Petroleum Basin, the Upper Paleozoic of Svalbard Island, and the Silurian of Libya. Type III kerogen mainly contains acyclic aromatic structures and oxygen functional groups, as well as high molecular weight alkanes. Wood-inertinite organics served as the starting material for it. This type of kerogen is found in Upper Cretaceous shale of the oil and gas basin of Douala (Cameroon). The graph of Tissot-Espitalier allows you to confidently determine the type of kerogen on the substage of protocatagenesis and gradations MK1-MK2. At higher gradations, as the generation potential is depleted, the value of HI decreases and kerogens of types I and II become difficult to distinguish, meaning that their construction and analysis loses meaning.
More informative information contains graphs of the hydrogen index (HI) as a function of T° max. This graph allows not only to highlight the fields of kerogen of different types, but also to trace their catagenetic evolution. The correlation of T ° max data with R° allowed French researchers to identify the interval T ° max <430 ° C as the zone of immature kerogen, identify the interval 430-465 ° C with the “oil window” (MK1 – MK3), interval T° max> 465°C attributed to the gas zone. Unfortunately, it is not possible to obtain such dependences for the studied samples, due to the lack of definitions of the reflectivity of vitrinite in the studied samples (it should be noted that this is a characteristic feature of the Maikop section).
On the modified van Crevelein diagram (HI dependence on Tmax), part of the samples falls into the oil window (Tmax 427-451°С). According to significant hydrogen index variations from 54 to 314 mg of hydrocarbons / g TOC, kerogen is classified as type II and type III (marine and mixed substance).
Conclusion
Generalization of materials on the geochemistry of the organic matter of the Cenozoic sedimentary formations of the Caucasian-Scythian region identified the following oil and gas source: – eocene (Kumskaya suite): marls, calcareous clays, Corg content. – from 0.6 to 11.5%, average – 3.3%, kerogen – type II, gradation of catagenesis – PK2 ÷ MK3; – oligocene – Lower Miocene (Maikop series) – a powerful stratum of dark-colored clayey aleurolites with interlayers of sandstones and olisostromic horizons with a thickness of 0.1 to 4.0 km. Grades of catagenesis – PK2 ÷ MK4, kerogen – type II / III, TOC content – from 0.1 to 18.0%. The magnitude of the generation potential (S1 + S2) varies from 0.7 to 127.3 mg HC / g of rock. The hydrogen index (HI) ranges from 110 to 680 mg HC / g TOC.
This list can be expanded at the expense of local sources: Khadyzhensk, Beloglinsk, diatom suites, Chokrak, and others.
The geochemical characterization of the Kum breeds’ rocks showed their high oil source potential. The qualitative and quantitative changes reflect not only the HC neoplasm, but also their emigration; The sapropelic agent in the Kumsky suite generates a large number of hydrocarbons, which increases along the top-down section. In the most submerged rocks, para-autochthonous bitumoid is widely distributed, and low-boiling hydrocarbons in its composition are HC7-C17. Migration and para-autochthonous bitumoids are noted at the PK3 gradation, but they are extremely extensively developed at the MK2 gradation (depth of 4.6-5 km). Practically all bitumoids in this zone are para-autochthonous (18%, the hydrocarbon content in the rock is up to 4 kg / m and more).
A comprehensive study of the organic matter of Khadum rocks using the methods of bituminology, pyrolysis, and chromatography showed that all types of kerogen are developed in them, however, OM mixed with moderate source potential dominates. The values of the HI hydrogen index vary in the range of 10–420 mg HC / g TOC, averaging about 100 mg HC / mg TOC. Only single samples of rocks in the southern regions of the study area (the Belaya river basins) are identified as “rich” source source rocks.
The maximum concentrations of TOC and genetic potential are observed within the West Kuban trough (especially in its central part), as well as in the outcrops in the area of the Adygei jut (basins of the river R. Belaya, Fars, Kuban). The improvement of geochemical parameters in these areas is explained by a decrease in the same direction of the terrigenous component in the initial OM.
References
- Bazhenova O.K., Fadeeva N.P. 21 International meeting of Organic geochemistry, 2003, II, 99-100.
- Bazhenova, O.K, Fadeeva, N.P, Nikishin, А.M. Vestnik Mosk. un-ta, 2006, 4, 6, 43-51.
- Bazhenova, O.K, Fadeeva, N.P, Petrichenko, Yu.A. Novye idei v geologii i geokhimii nefti i gaza, 2001, 36-38.
- Bazhenova, O.K, Fadeeva, N.P, Sen-Zhermes M.L. Geochemistry, 2002, 9, 993-1008
- Behar, F. Organic Geochemistry, 1987, 11, 1, 15-24.
- Distanova, L.R. Vestnik Mosk. un-ta, 4, 2007, 3, 59-64.
- Espitalie J.,G.Deroo, F.Marquis, Revue de l`Institut Francais du petrole, 1986, 41, №1.
- Guliyev, I.S., Kerimov, V.Y., Mustaev, R.N., Bondarev, A.V. SOCAR Proceedings, 2018, 1, 4-20.
- Guliyev, I.S., Kerimov, V.Y., Osipov, A.V., Mustaev, R.N. SOCAR Proceedings, 2017, 1, 4-16.
- Kerimov, V.Y., Gordadze, G.N., Lapidus, A.L., Giruts, M.V., Mustaev, R.N., Movsumzade, E.M., Zhagfarov, F.G., Zakharchenko, M.V. Solid Fuel Chemistry, 2018, 52(2), 128-137.
- Kerimov, V.Y., Rachinsky, M.Z., Mustaev, R.N., Osipov, A.V. Doklady Earth Sciences, 2017, 476(1), с. 1066-1068.
- Kerimov, V.Yu., Mustaev, R.N., Dmitrievsky, S.S., Zaitsev, V.A. Neftyanoe khozyaystvo – Oil Industry, 2016, 9, 18-21.
- Kerimov, V.Yu., Osipov, A.V., Lavrenova, E.A. Neftyanoe khozyaystvo – Oil Industry, 2014, 4, 33-35.
- Kerimov, V.Yu.; Lapidus, A.L.; Yandarbiev, N.Sh.; Movsumzade, E.M.; Mustaev, R.N. Solid Fuel Chemistry, 2017, 51(2), 122-130.
- Kerimov, V.Yu.; Mustaev, R.N.; Yandarbiev, N.Sh.; Movsumzade, E.M. Oriental Journal of Chemistry. 2017, 33, 2, 879-892.
- Lapidus, A.L., Kerimov, V.Y., Mustaev, R.N., Movsumzade, E.M., Zakharchenko, M.V. Oil Shale, 2018, 35(2), 113-127.
- Mustaev, R.N., Hai, W.N., Kerimov, V.Y., Leonova, E.A. Geomodel 2015 – 17th Scientific-Practical Conference on Oil and Gas Geological Exploration and Development, 2015, 212-216.
- Mustaev, R.N., Kerimov, V.Y., Shilov, G.Y., Dmitrievsky, S.S. Geomodel 2016 – 18th Science and Applied Research Conference on Oil and Gas Geological Exploration and Development, 2016.
- Mustaev, R.N. Oriental Journal of Chemistry, 2017, 33(4), 2036-2044.
- Nedumov, R.I. Litologiya i poleznye iskopaemye, 1994, 1, 69-78.
- Kerimov, V.Yu., Bondarev, A.V., Osipov, A.V., Serov, S.G., Neftyanoe khozyaystvo-Oil Industry., 2015, 5, 39–42.
- Sen-Zhermes, M.L., Bazhenova, O.K., Boden, F., Zaporozhec, N.I., Fadeeva, N.P. Litologiya i poleznye iskopaemye, 2000, 1. 56-73.
- Sokolov, B.A., Yandarbiev, N.Sh., Konyuhova, V.A. Geologiya nefti i gaza, 2001, 2, 31-36.
- Zaicev, V.A., Kerimov, V.Y., Mustaev, R.N., Dmitrievskij, S.S. EAGE/SPE Joint Workshop on Shale Science 2017: Prospecting and Development, 2017.

This work is licensed under a Creative Commons Attribution 4.0 International License.
![]()
A New Edition of Web of Science
Journal Impact Factor
2022: 0.5
Five Year: 0.8
Journal is Indexed in

Cabells Whitelist
![]()


