Evaluation of the Efficiency of Tea Waste Powder to Remove the Safranin O dye Compared to the Activated Carbon As Adsorbent
Sundus Saleh Nehaba*1 , Rahmah Hashim Abdullah2, Amjed Mirza Oda3, Alaa R. Omran4 and Ameer S. Mottaleb2
1Environmental Sciences Collage, Al-Qasim Green University, Iraq.
2Agriculture College, Al-Qasim Green University, Iraq.
3Basic education college, University of Babylon, Babylon, Iraq.
4Environmental Center Research, university of Babylon, Iraq.
Corresponding Author E-mail: sundus@environ.uoqasim.edu.iq
DOI : http://dx.doi.org/10.13005/ojc/350341
Article Received on : 09-05-2019
Article Accepted on : 14-06-2019
Article Published : 29 Jun 2019
Tea waste and active carbon manufactured from dates’ stone were used as adsorbents for removal Safranin O dye and the results were compared. Safranin O dye removal efficiency was studied by batch adsorption. The experimental results displayed that the removal efficiency of dye on the two adsorbent were greatest at high acidic solution of SO solution for tea adsorbent, while for Activated Carbon at high alkalinity for the same dye. This study shows the adsorption equilibrium isotherms were followed Freundlich and Langmuir isotherms, where safranin O dye adsorption obey Freundlich isotherm. The effect of temperature was studied and thermodynamic parameters were calculated.
KEYWORDS:Safranin O dye, Activated Carbon, tea waste, Adsorption equilibrium isotherm
Download this article as:| Copy the following to cite this article: Nehaba S. S, Abdullah R. H, Oda A. M, Omran A. R, Mottaleb A. S. Evaluation of the Efficiency of Tea Waste Powder to Remove the Safranin O dye Compared to the Activated Carbon As Adsorbent. Orient J Chem 2019;35(3). |
| Copy the following to cite this URL: Nehaba S. S, Abdullah R. H, Oda A. M, Omran A. R, Mottaleb A. S. Evaluation of the Efficiency of Tea Waste Powder to Remove the Safranin O dye Compared to the Activated Carbon As Adsorbent. Orient J Chem 2019;35(3). Available from: https://bit.ly/2LxOviD |
Introduction
Water pollution is the most serious problem due to development the technology of industries associated agricultural and domestic activities. Dyes and pigment have a large uses and found in all segment of environment. Dyes as known used for coloring and pigmentation in many kinds of industries like food, plastics, textile, paper rubber, etc. Safranin dye is considered as a toxic material and it has a tremendous impact on the human health.1 Different methods with varying degree of success have been developed to control and management of water and waste water pollution. Some of them included chemical precipitation ,coagulation, filtration, oxidation, ion exchange and adsorption.2 Among of these available methods used for water treatment, Adsorption considered the best technique associated with other methods because of easy operation, convenience, and simple in designation. Furthermore, this method can remove or reduce varying types of pollutants’ and thus it widely applicable in water treatment and pollution control.3 There are many locally materials used as adsorbent materials. Tea leaves waste as waste from restaurants and cafes can be applied as a secondary product that helpful in our society, also its can be consider as a high efficient, available , easy and faster method of purification domestic and industrial water instead of filtration and flocculation.4 Activated carbon (AC) has been found an important and widely used as an adsorbents industrial waste water.5 Also, the commercial activated carbon is expensive and in the present time, researchers efforts for focusing on cheaper, more economic and efficient adsorbents.6 Active carbon had been prepared from different materials that considered as a plant waste like sawdust, pomegranate peel , peat, coal coconut shell, palm kernel shell, cotton stalk, spent tea leaves… etc.7 this research, we dealing with manufacturing of two adsorbents which are tea waste and activated carbon produced from dates stone. The two adsorbents are used for safranin-O removal in aqueous solution by batch adsorption. Several parameters was studied like contact time, pH value, initial concentration of dye and temperature.
Materials and Methods
Preparing Adsorbent Materials
Tea leaves Waste
After collecting the tea leaves from the kitchen and cafes waste, the brown tea wastes were washing with water repeatedly. Tea waste boiled in water for 3h to eliminate the fully soluble colored ingredients, and then drying at room temperature for several days, grinding and sifting to the desired size and stored in plastic container for later use.
Manufacturing of Activated Carbon From Dates’ Stones
The source of organic material was dates’ stones and following steps were adopted in the preparation process:
First the dates’ stones were washed totally with water to extract the suspended materials and clingy sweet remnants that attached the dates’ stones. Then the cleaned dates’ stones and transferred to oven at 110 C° for drying and that made stones crushed and grinded easily.
50 gm/ 25 ml aqueous solution of zinc chloride was added to 25 g of crashed dates’ stones and completely mingling, then the mixture left overnight for saturation.
Carbonization of saturated dates’ stones done according to Yahia A. Alhamed8 method by putting it in furnace at 500 C° for 1 hour.
Adsorbate Preparation
The stock solution of safranin-o dye was 1000 mg/1 L in distilled water by weighing of 1 gm of dye powder in chemical balance and dissolved in water them completed to 1L. Series of diluted solutions were prepared to obtain the required concentrations under study. The UV-visible spectrophotometer scan of safranin-o dye was determined, where λmax equal to 518 nm. Fig. 1 illustrates the structural formula of safranin-O dye.
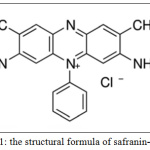 |
Figure 1: The structural formula of safranin-Odye. |
Batch Adsorption Experiments
By batch adsorption, the effect of adsorption contact time, pH, adsorbate dosage, temperature, and adsorbent particle size on removal efficiency were studied. Experimental procedures were carried out for two adsorbent materials: leave tea waste and activated carbon prepared from dates’ stones. In all practical experiments 0.15 g of tea waste and 0.05 g activated Carbon mixed with 50 ml of safranin-O dye (10 ppm) in shaking to evaluate the contact time, which equal to 10 min and 12 min for activated carbon and tea leaves respectively. The particle size of tow absorbents was 53 μm and the natural dye pH equal to 5.
Results and Discusion
The effect of period time to achieved adsorption equilibrium was studied under following operating conditions: 10 ppm initial dye concentration, 0.15g of tea waste and 0.05g activated Carbon dosage, and pH= 5. The data obtained were illustrated in fig.2, as explained that adsorption efficiency was increased with proceeding of time, till the equilibrium state was 10 min for activated carbon and 12 min for tea leaves.
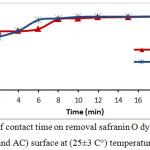 |
Figure 2: Effect of contact time on removal safranin O dye percentage onto (tea waste and AC) surface at (25±3 C°) temperature. |
In contact time start, the removal process was fast due to available active sites in adsorbents, and these active site were saturated (the adsorbate molecules created monolayer on the surface of adsorbent) gradually so the removal percentage become constant at the equilibrium time.9-11 By changing of safranin-O concentration in the following 10, 20, 30, 40 and 50 ppm and the operating conditions were: room temperature, pH=5, and the adsorbent dosage was 0.15 g of tea and 0.05g of activated Carbon. Safranin-O concentration is represent an essential powerful factor effects on mass transfer of dye molecules between the solid and aqueous phases. Consequently, a higher dye concentration lead to improve the adsorption process.12 Fig.3 illustrates the effect of safranin-O concentration for both of tea waste and activated carbon, where the removal and adsorption capacity of the safranin-O dye were different. When the concentration of dye is high, the efficiency of removal decreased while adsorption capacity increased. This phenomena is depends on the abundance of the number of active sites on surface and the availability of dye molecules that occupied the active site. At low dye loading, occupation is incompletely in the active sites and then it’s covered by dye molecules and the adsorption is at equilibrium.13
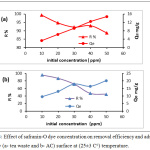 |
Figure 3: Effect of safranin-O dye concentration on removal efficiency and adsorption capacity (a- tea waste and b- AC) surface at (25±3 C°) temperature. |
The data expression that as the dye concentration, the removal dye percentage reductions, because of saturation the active site that available on the surface of adsorbents. while at low dye concentrations, all the dye molecules existing in the adsorption medium may possibly interact with the active site, hence greater removal percentage was achieved.14 The adsorbents doses of tea leaves and active carbon showed in Fig.4. as an effective factor for removal efficiency of safranin-O dye. At high doses of adsorbent, the removal efficiency increased. The enhancement in the removal efficiency can be explained to the increasing active sites of the adsorbent, and the surface area, where it is directly proportional with the adsorbent mass.15,16
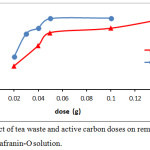 |
Figure 4: Effect of tea waste and active carbon doses on removal efficiency of safranin-O solution. |
The powder particle size of tea leaves and activated carbon effect on efficiency removal was studied by differing the particle adsorbents size in the range (53, 75 and 125 µm), and the working conditions were: room temperature, pH=5, and the adsorbent dosage were 0.05 g charcoal and 0.15 g of tea. In fig.5 illustrates a plot of removal dye percentage vs. particle size of adsorbent. When size of (tea leaves and activated carbon) particle is fine, the removal percentage obviously increased. The result show that the particle size of adsorbent was 125 µm the removal percentage was 79.03%, while at a size of 53 µm, the removal percentage reached to 93.7% for tea waste adsorbent. In case of the activated carbon, the removal percentage increased from 80.9% to 95.4% when particle size reduced from 125 to 53 µm for AC adsorbent. The increasing in the removal dye percentage to parallel reduce in adsorbent particle size, as the smaller in particle size, the surface area is greater.9
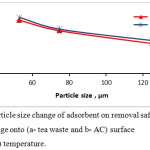 |
Figure 5: particle size change of adsorbent on removal safranin O dye percentage onto (a- tea waste and b- AC) surface at (25±3 C°) temperature. |
The change in the pH value of adsorbate solution alter average charge of adsorbent surface and effect on the ability of adsorption, also pH value changes the adsorbate charge and this another factor influence the adsorption process. In Fig. 6 showed alteration of pH value on safranin O dye that adsorbed by tea leaves and active carbon.
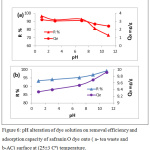 |
Figure 6: pH alteration of dye solution on removal efficiency and adsorption capacity of safranin O dye onto ( a- tea waste and b-AC) surface at (25±3 Cº) temperature. |
Fig.(6) shown, in case of tea waste, we note that the removal efficiency of safranin O dye increases when the pH of solution decreases. This phenomenon is caused by the presence of an increase of H+ ions changes the dye net charge, which increases the attraction with the negative charge of the surface. While when active carbon is used for adsorption of safranin dye, there is a slightly increase in the removal efficiency of dye with increased pH solution. At high pH, the OH– ions on the surface of the adsorbent increases, where attraction forces between positively dye cation and negatively charged sites will increase.17
To identify the adsorption process nature, the thermodynamic parameters: Gibbs’ free energy changes (ΔGo), entropy changes (ΔSo) and enthalpy change (ΔHo) calculated according to the following equations:
ΔG = – RT lnKd …..…………… (1)
![]()
Where: Kd is the equilibrium partition constant, Ris the universal constant of gases (8.314 J/mol. K) and T is the absolute temperature in Kelvin.
The values of ΔSo and ΔHo calculated from the intercept and the slope of ln Kd versus 1/T in equation (2), this shown in Table (1). See Fig. (7).
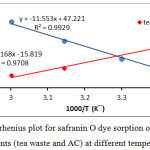 |
Figure 7: Arrhenius plot for safranin O dye sorption on the both of adsorbents (tea waste and AC) at different temperatures. |
Table 1: Thermodynamic parameters at different temperatures.
|
T(K) |
Tea leaves | Activated carbon | ||||
|
∆Hº (KJ/mol) |
∆Gº (KJ/mol) | ∆Sº (J/mol.K) | ∆Hº (KJ/mol) | (KJ/mol) |
∆Sº (J/mol.K) |
|
|
288 |
-63.326 |
-26.013 |
-131.519 | 96.051 |
-17.381 |
392.595 |
|
303 |
-22.659 |
-22.536 |
||||
|
318 |
-21.177 |
-28.307 |
||||
| 333 | -20.083 |
-35.196 |
||||
The parameters of thermodynamic at different temperatures are existing in the table 1. The adsorption safranin-O dye on the both of adsorbents (synthesis active carbon and tea leaves waste) were spontaneous, this concluded From the negative value of ΔGo, generally this results is favorable.18,19 Furthermore, the adsorption was more spontaneous when rise temperature from 288K to 333K, the ΔGo change from -26.01 to -20.08 KJ/mol for tea, and the ΔGo change for charcoal, from -17.381 to -35.196 Kj/mol. The nature of adsorption safranin-O dye on the charcoal was endothermic due to positive value of ΔHo, while The adsorption on the tea was exothermic due to negative value of ΔHo. Additionally, the positive sing of the ΔSo value 392.595 (J/mol.K) for adsorption safranin-O dye on the active carbon indicating that the entropy raised at solid-liquid interface during adsorption safranin-O dye on the charcoal.20 Interface when used the tea as adsorbent, that the So value -131.519 (J/mol. K) which have negative sing. Adsorption isotherms is play an important role in explaining the interaction form between adsorbed species from solution and adsorbent, Certain adsorption models are accessible, but there are two significant isotherm are Freundlich isotherm, and Langmuir isotherm. Fig.(8) shows adsorption isotherms for safranin O dye on the both of adsorbents (tea and charcoal) at different temperatures. The dye uptake on both of adsorbents was determined by the equation(3):
Qe=(Co-Ce) V/ wt …………..3
Where: Qe (mg/g) adsorption capacity, Co (mg/L) in the initial concentration of dye , Ce (mg/L) is adsorbed concentration at equilibrium, V (L) is solution volume of dye and wt (g) is the amount of adsorbent.
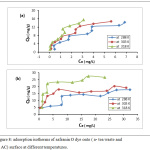 |
Figure 8: adsorption isotherms of safranin O dye onto (a- tea waste and b- AC) surface at different temperatures. |
The Langmuir isotherm assuming that the uptake of molecules of dye happens onto a homogenous surface formed monolayer adsorption, and the linear equation21 of this isotherm is:
![]()
Where the Qe is equilibrium capacity (mg/g); Ce is equilibrium adsorbed concentration(mg/L); Qo is maximum equilibrium adsorbed per unit adsorbent mass (mg/g) and KL the Langmuir isotherm constant (L/mg). By plotting values of 1/Qe versus values of 1/Ce, the values of KL and Qo was calculated from the slop and the intercept, see fig.(9). The separation factors (is an important feature of the Langmuir isotherm is explained according to the following equation and calculations are listed in the table. 2.22
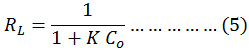
That, the K is constant of Langmuir, and the Co initial dye concentration. The Langmuir constant is designate the nature of adsorption nature as, thus, according to the adsorption isotherm, when RL>1 the adsorption is unfavorable, RL=1 the adsorption is linear and 0<RL<1 the adsorption is favorable.13-16
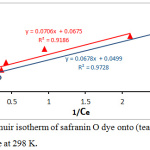 |
Figure 9: Langmuir isotherm of safranin O dye onto (tea waste and AC) surface at 298 K. |
The model of Freundlich isotherm is explains adsorption of the adsorbate on the adsorbent surface. It is usually employed for investigate the heterogeneity and the surface energies. The Freundlich isotherm expression follows equation 6.23
InQe = In Kf +1/n In Ce …………. (6)
thus, KF is adsorption constant which is the total capacity of adsorption (mg/g); 1/n is heterogeneity of the surface (dimensionless). The plot of lnQe against lnCe for the adsorption data of dye is shown in Fig.10, which allows to calculate the Freundlich constant values, n-1 and KF from slope and intercept, respectively. As show in the table 2:
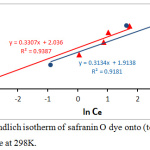 |
Figure 10: Freundlich isotherm of safranin O dye onto (tea waste and AC) surface at 298K. |
Table 2: Parameters of Freundlich and Langmuir Isotherm for the adsorption of safranin O dye onto (tea and charcoal) surface at 298 K.
| Isotherm models | Parameters | surface | |
| Tea leaves | Activated carbon | ||
| Freundlich | Kf (mg/g) | 7.659 | 6.778 |
| 1/n | 0.33 | 0.313 | |
| n | 3.03 | 3.194 | |
| R2 | 0.938 | 0.918 | |
| Langmuir | Qₒ (mg/g) | 14.814 | 20.04 |
| KL (L/mg) | 0.956 | 0.735 | |
| RL | 0.094 | 0.119 | |
| R2 | 0.918 | 0.972 | |
The Adsorption equilibrium isotherms were studied according to the linear Freundlich and Langmuir isotherms, and the parameters KL, KF, n, and RL were listed in the Table 2. The result showed that, the model of Langmuir isotherm and Freundlich isotherm acceptably explains experimental data. The correlation coefficient were higher for both utilized adsorbents R2= 0.938, 0.918 for tea and charcoal respectively (Freundlich isotherm), and R2= 0.918, 0.972 for tea and charcoal respectively (Langmuir isotherm), These results display a useful linearity. Moreover the suitable illustration of the Freundlich module possibly signifies adsorption of safranin-O on the charcoal was multilayer adsorption.24-26 The findings display that the n value is more than one (n=3.03, and 3.19 for tea and charcoal respectively) representing that the dye adsorbed onto both adsorbents are favorable. This agree with the results value of RL, the heterogeneity value in the table 2, signify that the each the adsorbent particles have a heterogeneous structure.27-30
Conclusion
In this study, low-cost tea wastes were compared with active carbon prepared from dates’ stones as adsorbent to remove Safranin O dye . The results were very convergent between tea wastes and active carbon as adsorbent for all studied parameters (the adsorbent dosage were 0.15g of tea wastes and 0.05g of active carbon). The results also showed that, the adsorption equilibrium is very short in time for both of adsorbents (10 min for activated carbon, 12 min for tea leaves). From the results above, we conclude that low-cost tea waste can be used as highly efficient adsorbent to remove dyes from Wastewaters.
Acknowledgements
I would like to express my deep appreciation to head of department and Dean of College for their support and encouragement.
Conflict of interest
There is no conflict of interest.
References
- Papita, D. and Rahul, Elixir International Journal, Elixir Pollution 2012, 44, 7579-758.
- Abdullah, R. H., Baqir, S. J. and Obaid, E. K. (2016). J. Babylon Univ./Pure Applied Sci, 24, 1277-1287.
- Hamdaoui O. Journal of Hazardous Materials B 135, pp. 264-273, 2006.
- Deshuai Sun, Zhongyi Zhang, Mengling Wang and Yude Wu. American Journal of Analytical Chemistry, 2013, 4, 17-26.
- Viswanathan, P. Indra Neel and T. K. Varadarajan. Indian Institute of Technology Madras, Chennai 600 036.
- Hakan D, İlknur D, Belgin K and Fatma T. Int. Environmental Application & Science, Vol. 3 (5): 381-389 (2008).
- Siang Y. Yeo , Siwon C., Vivian D., Yoke K., Genggeng Q., Alan H., Patrick S., Beng Reginald T. journal.pone. 0066648, 2013.
- Yahia A. Alhamed” Activated Carbon from Dates’ Stone by ZnCl 2 Activation” Eng. Sci., 17(2), 75-100, (2006).
- Rahmah H. A., Amjed M. O., Alaa R. O., Ameer S. M., and Teeba M. M. Indones. J. Chem., 2018, 18 (4), 724 – 732.
- Bansode R. R., Agricultural And Mechanical College, The Department of Food Science. 2002
- Alaa R.O., Maysam A.B., Juda S.A., Salman J.M. Inter-national Journal of ChemTech Research. 2016;9(4):334-342.
- Bhattacharya A. K., Mandal S. N. and Das S. K. Indian Journal Of Chemical Technology. 2006, 13, 576-583.
- Kannan N., Sundaram M.M. Dyes Pigment. 2001 , 51, 25-40.
- Awaz B., Alaa R., Maysam A., Jasim M. Baghdad Science Journal, 15(1), 2018.
- Bansal R. C. and Goyal M. Taylor & Francis Group, LLC. 2005.
- Salman JM, Amrin AR. Mesop environ J. 2015; 14: 75-83.
- Sahu, M. K., Sahu, U. K., and Patel, R. K. (2015). RSC Advances, 5(53), 42294-42304.
- Richardson J.F., Harker J.H., and Backhurst J.R. Chemical Engineering. 2,(5th) edition BH; 970-1006, 2011.
- Gong R, Ding Y, Li M, Yang C, Liu H, Sun Y. Dyes Pigments. 64: 187-192, 2005.
- Deng H., Yang L., Tao G., Dai J., Journal of Hazardous Materials, 166, 1514-1521, 2009.
- Deng H., Yang L., Tao G., Dai J., Journal of Hazardous Materials 166, 1514-1521, 2009.
- Cheah, U.B., R.C. Kirkwood and K.Y. Lum, Pesticide Science, 50: 53-63, 1997.
- Akçay, G. and K. Yurdakoç, Hydrobiol, 28(6): 300-304, 2000.
- Mc-kay G., Ramprasad G., and Mowli P.P., Water, Air and Soil Pollution 29(3); 273-283, 1986.
- Rasheed Khan, A., Hajira Tahir., Fahim Uddin., Uzma Hameed. Journal of Applied Science and Environment Management, 9(2), 29-35, 2005.0
- Bhatnagar A., and Jain A.K., Journal of Colloid and Interface Science; 49-55, 2004.
- Salman JM, Amrin AR, Jouda SA. Journal of advance chemical scinces. 2016; 2(1):192-194.
- Sharma S, Buddhdev J, Patel M, Ruparelia JP. Procedia Engineering, 51: 451-455, 2013.
- Namasivayam, C., N. Kanchana, N., Yamuna, R.C. Waste Management, 13(1), 8995, 1993b.

This work is licensed under a Creative Commons Attribution 4.0 International License.
![]()
A New Edition of Web of Science
Journal Impact Factor
2022: 0.5
Five Year: 0.8
Journal is Indexed in

Cabells Whitelist
![]()


