Environmentally Friendly Ag+ Detection of “Turn-on” Fluorescent Sensor with a Mega-Stokes Shift and Its Application in Biological Systems
Suphaluk Jarutikorn1, Sasiwimon Kraithong2, Jitnapa Sirirak1, Waraporn Panchan3, Thanasat Sooksimuang3, Adisri Charoenpanich4 and Nantanit Wanichacheva*1
1Department of Chemistry, Faculty of Science, Silpakorn University, Nakhon Pathom, 73000, Thailand.
2Research group on Materials for Clean Energy Production STAR, Department of Chemistry, Faculty of Science, Chulalongkorn University, Bangkok 10330, Thailand.
3National Metal and Materials Technology Center, Pathumthani, 12120, Thailand.
4Department of Biology, Faculty of Science, Silpakorn University, Nakhon Pathom, 73000, Thailand.
Corresponding Author E-mail: wanichacheva.nantanit@gmail.com
DOI : http://dx.doi.org/10.13005/ojc/350345
Article Received on : 19-06-2019
Article Accepted on : 27-06-2019
Article Published : 30 Jun 2019
A “turn on” fluorescent sensor based on 2-[4-(2-aminoethylthio)butylthio]ethanamine ionophore and [5]helicene fluorophores, MC4 was developed for detection of Ag+. An aqueous ethanol solution, an environmental friendly condition, was chosen as a working condition. MC4 exhibited Ag+–induced fluorescent enhancement with a low detection limit of 32 ppb for Ag+. The detection limit of the sensor was below the permissible concentrations of Ag+ for drinking water as regulated by the United States Environmental Protection Agency (U.S. EPA) and World Health Organization (WHO). Moreover, MC4 exhibited a strong fluorescent signal and expansive Stokes shift of 213 nm. This very expansive Stokes shift could reduce interferences from self-absorption and auto-fluorescence. The sensor also provided highly selective recognition of Ag+, distinguishing it from other competing ions through the photoinduced electron transfer (PET). Importantly, this sensor is able to track Ag+ in HepG2 cells, indicating that it shows good potential for practical applications.
KEYWORDS:Fluorescent Sensor; High Selectivity; Large Stokes Shift; Silver Sensor
Download this article as:| Copy the following to cite this article: Jarutikorn S, Kraithong S, Sirirak J, Panchan W, Sooksimuang T, Charoenpanich A, Wanichacheva N. Environmentally Friendly Ag+ Detection of “Turn-on” Fluorescent Sensor with a Mega-Stokes Shift and Its Application in Biological Systems. Orient J Chem 2019;35(3). |
| Copy the following to cite this URL: Jarutikorn S, Kraithong S, Sirirak J, Panchan W, Sooksimuang T, Charoenpanich A, Wanichacheva N. Environmentally Friendly Ag+ Detection of “Turn-on” Fluorescent Sensor with a Mega-Stokes Shift and Its Application in Biological Systems. Orient J Chem 2019;35(3). Available from: https://bit.ly/2Xk2j2t |
Introduction
The design and preparation of novel fluorescent sensors for quantitative and qualitative detections using protons,1,2 small molecules,3,4 anions5,6 and cations7-9 recognitions have become a subject of interest in research. This is due to their high sensitivity and selectivity, rapidity, functional simplicity, nondestructive of samples and real-time monitoring. Particularly, the capability of the fluorescent sensor to trap heavy metal ions (such as Hg2+, Cu2+, Ag+, Fe2+) is very important for environmental, biological and health awareness. Among those heavy metal ions, silver ion (Ag+) is widely used in several industries such as a photography, medical and electrical chemistry. Ag+ contaminated industrial waste can, therefore, be released into the environment. Although Ag+ is not as harmful as other heavy metal ions, a large amount of Ag+ can cause some serious health effects such as anemia, argyrosis and argyria. Argyrosis and argyria cause grayish-blue coloration of the eyes and skin, respectively.10 Due to the toxicity of Ag+, the United States Environmental Protection Agency (U.S. EPA) has set the standard permit level of Ag+ in drinking water at 100 μg·L-1.11 It is well-known that Ag+ and other metal ions including Cu2+, Pb2+ and Hg2+ are fluorescent quenchers due to their filled d-orbitals.12 A fluorescent sensor with high selectivity to Ag+ is highly desirable. The development of such a sensor for detection of Ag+ is challenging, especially, “turn on” fluorescent sensor.
Based on the fact that sulfur bearing ligands could exhibit a high tendency to interact with Ag+ due to the soft-soft acid-base interaction.13 In recent years, several fluorescent sensors containing sulfur atoms for determination of Ag+ have been reported.14-16 However, most of these sensors exhibited poor water solubility, resulting in their limitations in cell permeability and the application in aqueous environmental and biological samples. Therefore, the hydrosoluble Ag+ fluorescent sensor is needed.
Herein, [5]helicene derivative (M202) was chosen as the fluorophore because it can provide very large Stokes shifts and strong fluorescent emissions with a high quantum yield in visible wavelengths. Fluorophores with very large Stokes shifts provide well separated absorption and emission bands that can reduce self-absorption and auto-fluorescent interference, resulting in better sensitivity and a higher detection accuracy.17-19 In addition, the hydroxyl groups contained in M202 could raise the hydrophilicity and hydrosolubility of the sensor in aqueous systems.
In this study, the prepared “turn on” fluorescent sensor, MC4, consisted of 2-[4-(2-aminoethylthio)butylthio]ethanamine (C4) and two units of M202, worked well for Ag+ detection in aqueous ethanol condition, showing high sensitivity and selectivity and a low detection limit of 32 ppb. The solvent system of the sensor was also environmentally and biologically friendly, which allowed cell-permeability with great biocompatibility.20 Moreover, since MC4 had great water-solubility, it could be utilized for Ag+ intracellular monitoring in HepG2 cells.
Materials and Method
General Methods
To obtain mass spectra and NMR spectra, all products were characterized by ThermoElectron LCQ‒DECA‒XP, ESI-ion trap mass spectrometer and Bruker Avance 300 spectrometer using CDCl3 with internal standard TMS and MeOD, respectively. Optical properties were studied using Hewlett Packard 8453 UV-Vis spectrophotometer for absorption spectra and Perkin Elmer Luminescence spectrometer LS 55 in quartz cuvette (1 × 1 cm), operating at excitation and emission slit widths of 5.0 nm with scan speed of 300 nm/min for fluorescent emission spectra. Molecular structures of MC4 and MC4–Ag+ complex were optimized using Guassian09. Energies and geometrics were calculated at the B3LYP with 6‒311G** basis set for main group element and LanL2DZ for Ag+, respectively. The calculated molecular figures were obtained by VMD program.21
Synthesis Method
Common commercial chemicals and solvents were purchased from Sigma-Aldrich and Fluka Chemical Corporations. These reagents were used as received without further purification. Perchlorate salts of metal ion complexes were purchased from Strem Chemical Corporation.
General Synthetic Procedure
2-[4-(2-aminoethylthio)butylthio]ethanamine (C4) synthetic strategy
The synthetic method of C4 was designed following our previous report.22 Nucleophilic substitution of 2–aminoethanethiol hydrochloride and tetramethylene dibromide using sodium methoxide as a base provided yellow oil of C4 63%.
3,13-dimethoxy-5,6,10,11-tetrahydrofuro[3,4-i][5]helicene-7,9-dione (M201) synthetic strategy
M201 was synthesized using the same synthetic route as in a previous report.23 Concisely, a Diels-Alder reaction of diene and maleic anhydride, followed by oxidation via 2,3-dichloro-5,6-dicyano-1,4-benzoquinone (DDQ) afforded M201 in 31% yield.
7,12-dihydroxy-4,5,14,15-tetrahydronaphtho[2′,1′:3,4]phenanthro[1,2-c] furan-1,3-dione (M202) synthetic strategy
M201 (15.00 g, 36.00 mmol) and pyridine hydrochloride (63.00 g, 54.60 mmol) were mixed together in a 100 mL round bottom flask and stirred at 220 °C for 6 hours. Next, the homogeneous reaction mixture was poured into vigorous stirring of deionized water (1 L) while still hot. A yellow solid developed and the resulting residue was continuously stirred for 1 hour. The filtered yellow solid was collected, washed by 1 L of deionized water, and dried to obtain M202 as the product in the quantitative yield (99%). 1H NMR (DMSO, 300 MHz) δ (ppm): 9.92 (s, 2H), 7.00 (d, J = 8.5 Hz, 2H), 6.73 (s, 2H), 6.40 (d, J = 8.5 Hz, 2H), 3.70 (d, J = 16.0 Hz, 2H), 2.78 (m, 4H), 2.38 (m, 2H); 13C NMR (DMSO, 75 MHz) δ (ppm): 163.2 (2C), 157.9 (2C), 140.8 (2C), 139.2 (2C), 138.7 (2C), 130.7 (2CH), 124.2 (2C), 124.1 (2C), 114.3 (2CH), 113.2 (2CH), 27.7 (2CH2), 23.9 (2CH2). FT-IR (KBr) nmax (cm-1) 3262, 2972, 2835, 1825, 1759, 1579, 1355, 1277, 1168, 903, 745, 625, 505; HRMS‒ESI cald for C24H16NaO5+ (M+Na)+ 407.0890 m/z, found 407.0892 m/z.
MC4 Sensor Synthetic Strategy
The C4 (0.026 g, 0.12 mmol) and potassium carbonate (0.069 g, 0.50 mmol) were dissolved in dry dimethylformamide (2.0 mL) and then the solution mixture was stirred for 30 min. After that, M202 (0.096 g, 0.25 mmol) was added into the reaction flask. The reaction mixture was stirred at 110 °C for 2 h. Then, the solvent was removed under a vacuum system. The residue was extracted with ethyl acetate (3 × 20 mL) and deionized water (20 mL). The organic phase was dried over anhydrous sodium sulfate, filtered and removed the solvent under vacuum system. After that, the crude product was purified by preparative thin layer chromatography using ethyl acetate:hexane (3:1 v/v) as mobile phase (Rf = 0.32) to obtain MC4 as an orange solid 101 mg (87%). 1H-NMR (DMSO, 300 MHz) δ (ppm): 6.72 (d, J = 8.4 Hz, 4H), 6.50 (s, 4H), 6.15 (d, J = 6.3 Hz, 4H), 3.65 (t, J = 5.1 Hz, 4H), 3.50 (t, J = 6.9 Hz, 4H), 2.60 (t, J = 9.6 Hz, 4H), 2.45 (d, J = 5.7 Hz, 12H), 1.60 (s, 8H); 13C NMR (DMSO, 75 MHz) δ (ppm): 169.86 (4C), 158.54 (4C), 142.29 (4C), 139.12 (4C), 138.84 (4C), 132.41 (4CH), 126.57 (4C), 125.76 (4C), 114.95 (4CH), 114.00 (4CH), 38.20 (2CH2), 31.85 (2CH2), 30.49 (4CH2), 29.73 (4CH2), 25.25 (4CH2); HRMS-ESI cald for C56H48NaN2O8S2+ (M+Na)+ 963.2744 m/z, found 963.2742 m/z.
General UV-Vis and Fluorescent Spectral Measurements
Sensor MC4 and metal ions solutions were freshly prepared for UV-Vis and fluorescent studies. The MC4 stock solution was prepared in ethanol and serial diluted to 10.0 µM in working solution (60% aqueous ethanol). The various metal ion solutions including Ag+, Ba2+, Ni2+, Cd2+, Fe3+, Ca2+, Li+, Na+, Zn2+, Al3+, Pb2+, Cu2+, Mg2+, Hg2+, Mn2+, K+ and Co+ (10-2 M) were prepared in deionized water. Absorbance and fluorescent measurements were examined in quartz cuvette (1 × 1 cm). The fluorescent excitation was operated at 337 nm with excitation and emission spectral band pass of 5.0 nm and scan speed of 300 nm/min.
Bioimaging Experiments
Prior to the experiment, HepG2 cells were cultured in 96 well plate for 48 hours in Dulbecco’s modified eagle medium (DMEM) supplemented with 10% phosphate buffered saline (PBS buffer). The sensor MC4 was dissolved in dimethyl sulfoxide (DMSO), then diluted in PBS buffer to obtain a final concentration of 50 µM (10% DMSO in PBS buffer). Cells were incubated in 50 µM of fluorophore MC4 for 30 minutes, followed by twice PBS buffer washed, and further incubated in 0 or 50 µM of AgNO3 for 2 hours before being visualized.
Results and Discussion
Syntheses of MC4 and Molecular Design
The synthetic route of MC4 is depicted in Fig. 1. The MC4 sensor was synthesized via nucleophilic substitution and an imidation reaction. First, nucleophilic substitution of 2-aminoethanethiol hydrochloride and tetramethylene dibromide in the presence of sodium methoxide afforded C4 (63% yield). MC4 was then achieved in 83% yield through an imidation reaction of C4 and M202 using potassium carbonate as a base.
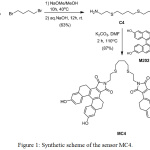 |
Figure 1: Synthetic scheme of the sensor MC4. |
According to the Pearson acid-base concept, Ag+ and sulfur atom are “soft acid” and “soft base”, respectively. Binding between Ag+ and sulfur atom is favored. Due to the thiophilic nature of the C4 containing sulfur atom, C4 was used as an ionophore for coordination with Ag+. Meanwhile, [5]helicene anhydride derivative (M202) was employed as fluorophore due to its intense fluorescence in the visible wavelengths and large Stokes shift. Additionally, hydroxy groups in the M202 induced hydrosoluble behavior in the sensor. As a result, the designed sensor with M202 had higher water-solubility compared to that of our first generation Ag+ sensor based on M201.24 The water solubility of the sensor could make M202 valuable in terms of application in biological samples.
Effect of Water on the Fluorescent Emission Behavior
For practical detection of Ag+ in the aqueous samples, the effect of water on the fluorescent emission of MC4 was investigated in ethanol solutions since an ethanol–water mixture was more favorable to the environment compared to pure ethanol. As can be seen in Fig. 2a, the fluorescent intensity of MC4 gradually increased with increasing amounts of water. In the presence of Ag+, the fluorescent intensity of the sensor was significantly turned on when the quantity of water was 40 ‒ 60% (Fig. 2b). From this experiment, it was found that an optimal system of 60% (v/v) water/ethanol was suitable for sensitivity and selectivity studies.
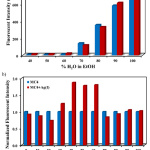 |
Figure 2: Effect of water on the fluorescent emission behavior |
(a) Fluorescent intensities and (b) Normalized fluorescent intensities of MC4 (10.0 µM) as a function of water contents in aqueous ethanol solutions at 550 nm in the absence and presence of Ag+ (2.0 eq.), excited at 337 nm.
Sensitivity study of the MC4 sensor
The spectroscopic behaviors of MC4 and MC4–Ag+ were determined in 60% aqueous ethanol. The absorption spectra in the UV‒Vis region of the sensor exhibited an absorption band at 337 nm with a shoulder of 420 nm (Fig. 3). Meanwhile, the fluorescent emission in the presence of Ag+ was observed at 550 nm (λex 337 nm) with a very expansive Stokes shift of 213 nm. This large Stokes shift could avoid interferences from self-absorption and auto-fluorescence, making the sensor suitable for many applications including optical portable device and biological samples.
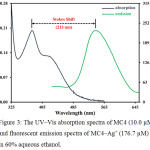 |
Figure 3: The UV‒Vis absorption spectra of MC4 (10.0 µM) and fluorescent emission spectra of MC4–Ag+ (176.7 µM) in 60% aqueous ethanol. |
Fluorescent titration was studied with the presence of Ag+, as shown in Fig. 4. At 550 nm (λex 337 nm), sensor MC4 exhibited weak fluorescent. Upon increasing the Ag+ concentration, the fluorescent signal of the sensor was gradually turned on rougly 4-fold, operating by the photoinduced electron transfer (PET) process. Concisely, weak fluorescent emission of MC4 was observed due to the PET by the sulfur atom in the molecule. It could be noted that the electron from the HOMO of MC4 was excited to the LUMO which allowed PET from sulfur to fluorophore, resulting in the fluorescent turn off (Fig. 5). However, the fluorescent “turn on” was observed upon addition of Ag+, suggested that the sulfur atom had a strong interaction with Ag+.
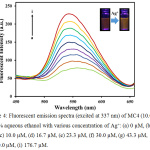 |
Figure 4: Fluorescent emission spectra (excited at 337 nm) of MC4 (10.0 µM) in 60% aqueous ethanol with various concentration of Ag+: (a) 0 µM, (b) 3.3 µM, (c) 10.0 µM, (d) 16.7 µM, (e) 23.3 µM, (f) 30.0 µM, (g) 43.3 µM, (h) 70.0 µM, (i) 176.7 µM.Click here to view figure |
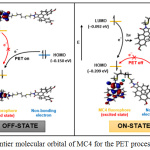 |
Figure 5: Frontier molecular orbital of MC4 for the PET process explanation. |
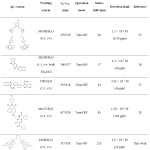 |
Table 1: Fluorescent sensors reported for Ag+ detection. |
The detection limit (LOD) of MC4 was calculated by the 3σb/m equation, where σb is the standard deviation of the blank signal, and m is the slope of linear correlation between the fluorescent intensities and Ag+ concentrations. The calculated LOD of MC4 was estimated to be 2.9 × 10⁻⁷ M or 32 ppb. According to the maximum permissible contaminant level of Ag+ concentration in drinking water as regulated by the U.S. EPA, the LOD of MC4 for detection of Ag+ was below the acceptable concentration for drinking water (100 ppb). Moreover, compared to previous Ag+ sensors,25-28 the LOD of this sensor was remarkably superior (Table 1). This suggested that the sensor not only exhibited a high sensitivity in aqueous media but also provided “Turn‒On” fluorescent behavior that was suitable for detection of Ag+ in the various environmental samples.
Binding Studies
Stoichiometry of the MC4–Ag+ complex was evaluated by Job’s plot analysis (Fig. 6). When the correlated fluorescent intensity reached a peak, the molar fraction of MC4 was found to be 0.5, suggesting that the possible stoichiometric ratio for MC4–Ag+ complex was 1:1. This stoichiometric ratio was also supported by the association constant (Kassoc) of 1.98 × 10⁴ M-1, calculated using a Benesi–Hildebrand plot,29 indicating a strong interaction between sensor and Ag+.
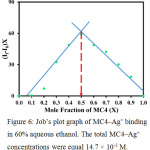 |
Figure 6: Job’s plot graph of MC4–Ag+ binding in 60% aqueous ethanol. The total MC4–Ag+ concentrations were equal 14.7 × 10⁻⁵ M. |
According to the 1:1 stoichiometry of MC4–Ag+ complex, structure of the MC4 Ag+ was designed. Both optimized geometries of MC4 and MC4 Ag+ at the DFT–B3LYP level with 6-311 G** and LanL2DZ basis set for main group element30 and Ag+,31 were illustrated in Fig. 7a and Fig. 7b, respectively. The optimized structures of MC4 Ag+ showed that Ag+ was assembled well in the core of the MC4 which exhibited a nearly planar geometry. Ag+ was also coordinated by two sulfur atoms and an oxygen atom with lengths of 2.60, 2.72 and 2.37 Å, respectively. These observations suggested that the electrostatic interactions between sulfur atoms and Ag+ were favorable and were operated through a cation–dipole interaction, resulting in selective chelation between sensor and Ag+.
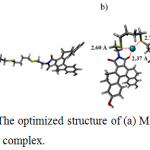 |
Figure 7: The optimized structure of (a) MC4 and (b) MC4–Ag+ complex. |
Selectivity Study of the MC4 Sensor
To observe the selectivity against other metal ions, the fluorescent responses were examined upon titration with various metal ions (Ag+, Ba2+, Ni2+, Cd2+, Fe3+, Ca2+, Li+, Na+, Zn2+, Al3+, Pb2+, Cu2+, Mg2+, Hg2+, Mn2+, K+ and Co+) in 60% aqueous ethanol. As can be seen in Fig. 8, it was found that only Ag+ could enhance the fluorescence of the sensor, corresponding to PET suppression. In contrast, other metal ions could not induce any fluorescent enhancement of the sensor.
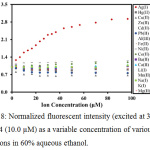 |
Figure 8: Normalized fluorescent intensity (excited at 337 nm) of MC4 (10.0 µM) as a variable concentration of various metal ions in 60% aqueous ethanol. |
To further clarify the selectivity of the sensor toward Ag+, competitive experiments were conducted in the presence of Ag+ with the subsequent addition of 1 eq. of other competing ions (Ba2+, Ni2+, Cd2+, Fe3+, Ca2+, Li+, Na+, Zn2+, Al3+, Pb2+, Cu2+, Mg2+, Hg2+, Mn2+, K+ and Co+). The results illustrated that the relatively fluorescent signals of the Ag+–enhanced fluorescence of MC4 still appeared upon addition of competing ions (Fig. 9).
![Figure 9: Competitive experiments (emitted at 550 nm) of MC4–Ag+ complexes in the system of various metal ions: [MC4] = [Mn+] = 10.0 µM.](http://www.orientjchem.org/wp-content/uploads/2019/07/Vol35No3_Env_Sup_fig9-150x150.jpg) |
Figure 9: Competitive experiments (emitted at 550 nm) of MC4 Ag+ complexes in the system of various metal ions: [MC4] = [Mn+] = 10.0 µM. |
The fluorogenic change of MC4 in the presence of various metal ions was also explored under UV light. As can be seen in Fig. 10, the fluorescent turn‒on was observed in the presence of Ag+ only, and not in the presence of the other metal ions.
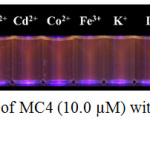 |
Figure 10: Fluorescent changes of MC4 (10.0 µM) with addition of various metal ions (16.7 µM) under UV light. |
These results clearly confirmed that MC4 had a high selectivity toward Ag+. Other competitor ions such as Ba2+, Ni2+, Cd2+, Fe3+, Ca2+, Li+, Na+, Zn2+, Al3+, Pb2+, Cu2+, Mg2+, Hg2+, Mn2+, K+ and Co+ ions, could not induce any significant change in fluorescent response.
Bioimaging application of the MC4 sensor for Ag+ detection
Due to a good hydrophilicity of MC4, the application of MC4 for intracellular tracking of Ag+ in HepG2 cells was investigated. HepG2 cells were first incubated with MC4 (50 µM), then subsequently treated with Ag+ (50 µM). A confocal fluorescent image of the HepG2 cells stained with MC4 provided negligible intracellular fluorescence. When Ag+ was taken into the cells, a remarkable, bright green fluorescence was observed (Fig. 11). It was demonstrated that MC4 was efficient in screening for Ag+ in biological cells, suggesting that MC4 can permeate in cells with excellent biocompatibility.
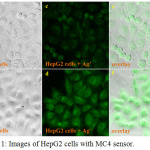 |
Figure 11: Images of HepG2 cells with MC4 sensor. |
(a) HepG2 cells image under phase contrast; (b) HepG2 cells image with Ag+ (50 µM) under phase contrast; (c) HepG2 cells image under blue light; (d) HepG2 cells image with Ag+ (50 µM) under blue light; (e),(f) overlay between phase contrast and blue light.
Conclusion
A hydrosoluble Ag+ fluorescent sensor MC4 with very large Stokes shift (213 nm) was designed and synthesized with two steps of simple reaction. This “turn on” sensor was highly selective and sensitive toward Ag+ in aqueous ethanol solution. Moreover, its detection limit (32 ppb) was low enough for quantitative detection of Ag+ in drinking water specified by U.S. EPA (100 ppb). The good hydrosoluble of sensor also provided cell permeation which allowed Ag+ intracellular screening in HepG2 cells. Therefore MC4 had good potential for biological samples. More importantly, the detection of Ag+ with MC4 was based on green chemistry and environmental friendly.
Acknowledgements
This project is supported by Thailand Graduate Institute of Science and Technology (TGIST, Grant TG-33-16-59-051M) Scholarship from National Metal and Materials Technology Center (MTEC); a member of National Science and Technology Development Agency (NSTDA). Rachadapisek Sompote Fund for Postdoctoral Fellowship, Chulalongkorn University was acknowledged by S. Kraithong. N. Wanichacheva is grateful for supporting of Grant RSA 6080058 from Faculty of Science, Silpakorn University and the Thailand Research Fund.
References
- Thivierge, C.; Han, J.; Jenkins R. M.; Burgess, K. J. Org. Chem. 2011, 76, 5219-5228.
- Cox, R. P.; Higginbotham, H. F.; Graystone, B. A.; Sandanayake, S.; Langford, S. J.; Bell, T. D. Chem. Phys. Lett., 2012, 521, 59-63.
- Liang, X.; James, T. D.; Zhao, J. Tetrahedron Lett. 2008, 64, 1309-1315.
- Lin, C. M.; Usama, S. M.; Burgess, K. Molecules. 2018, 23(11), 2900.
- Rivadehi, S.; Reid, E. F.; Hogan, C. F.; Bhosale, S. V.; Langford, S. J. Biomol. Chem. 2012, 10, 705-709.
- Li, M.; Liu, Z.; Wang, H. C.; Sedgwick, A. C.; Gardiner, J. E.; Bull, S. D.; Xiao, H. N.; James, T. D. Dyes and Pigments. 2018, 149, 669-675.
- Tachapermpon, Y.; Thavornpradit, S.; Charoenpanich, A.; Sirirak, J.; Burgess, K.; Wanichacheva, N.; Dalton Trans. 2017, 46, 16251-16256.
- Kaewnok, N.; Petdum, A.; Sirirak, J.; Charoenpanich, A.; Panchan, W.; Sahasithiwat, S.; Sooksimuang, T.; Wanichacheva, N. New J. Chem. 2018, 42, 5540-5547.
- Cox, R. P.; Sandanayake, S.; Scarborough, D. L. A.; Izgorodina, E. I.; Langford, S. J.; Bell, T. D. M. New J. Chem. 2019, 43, 2011-2018.
- Chemical properties of silver – Health effects of silver – Environmental effects of silver. Delft, Netherlands: Lenntech B.V, 1998-2019.
- McCarthy G. National Primary Drinking Water Regulation Table (EPA 816-F-09-004). N.W., Washington, DC: U. S. E. P. Agency, 2009.
- Leung, C. W. T.; Hong, Y.; Chen, S.; Zhao, E.; Lam, J. W. Y.; Tang, B. Z. Am. Chem. Soc. 2013, 135, 62-65.
- Li, L. Q.; Gao, L. J. Acta. A. Mol. Biomol. Spectrosc. 2016, 152, 426-430.
- Goh, H.; Nam, T. K.; Singh, A.; Singh, N.; Jang, D. O. Tetrahedron Lett., 2017, 58, 1040-1045.
- Hwang, K. S.; Park, K. Y.; Kim, D. B.; Chang, S. K. Dyes and Pigments. 2017, 147, 413-419.
- Lotfi, B.; Tarlani, A.; Moghaddam, P. ; Aghayan, M. M.; Peyghan, A. A.; Muzart, J.; Zadmard, R. Biosens Bioelectron. 2017, 90, 290-297.
- Araneda, J. F.; Piers, W. E.; Heyne, B.; Parvez, M.; McDonald, R. Chem. Int. Ed. 2011, 50, 12214-12217.
- Benniston, A. C.; Winstanley, T. P. L.; Lemmetyinen, H.; Tkachenko, N. V.; Harrington, R. W.; Wills, C. Lett. 2012, 14, 1374-1377.
- Er, J. C.; Tang, M. K.; Chia, C. G.; Liew, H.; Vendrell, M.; Chang, Y. T. Sci. 2013, 4, 2168-2176.
- Capello, C.; Fischer, U.; Hungerbühler, K. Green Chem. 2007, 9, 927-934.
- Humphrey, W.; Dalke, A.; Schulten, K. J. Mol.Graph. 1996, 14, 33-38.
- Wanichacheva, N.; Watpathomsub, S.; Lee, V. S.; Grudpan, K. 2010, 15 (3), 1798-1810.
- Sooksimuang, T.; Kamtonwong, S.; Parnchan, W.; Kangkaew, L.; Sahasithiwat, S. crystallogr. Sect. E: Struct. Rep. Online. 2014, 70, 418-420.
- Petdum, A.; Panchan, W.; Swanglap, P.; Sirirak, J.; Sooksimuang, T.; Wanichacheva, N. Sensors and Actuators B: Chemical. 2018, 259, 862-870.
- Kursunlu, A. N.; Güler. E. Mol. Structure. 2017, 1134, 345-349.
- Chen, C.; Liu, H.; Zhang, B.; Wang, Y.; Cai, K.; Tan, Y.; Gao, C.; Liu, H.; Tan, C.; Jiang, Y. Tetrahedron Lett. 2016, 72, 3980-3985.
- Wu, Y. C.; Jiang, K.; Luo, S. H.; Cao, L.; Wu, H. Q.; Wang, Z. Y. 2019, 206, 632-641.
- Ye, F.; Liang, X. M.; Xu, K. X.; Pang, X. X.; Chai, Q.; Fu, Y. 2019, 200, 494-502.
- Ma, T. H.; Zhang, A. J.; Dong, M.; Dong, Y. M.; Peng, Y.; Wang, Y. W. Lumin. 2010, 130, 888-892.
- Frisch, M. J.; Trucks, G. W.; Schlegel, H. B.; Scuseria, G. E.; Robb, M. A.; Cheeseman, J. R.; Scalmani, G.; Barone, V.; Mennucci, B.; Petersson, G. A.; Nakatsuji, H.; Caricato, M.; Li, X.; Hratchian, H. P.; Izmaylov, A. F.; Bloino, J.; Zheng, G.; Sonnenberg, J. L.; Hada, M.; Ehara, M.; Toyota, K.; Fukuda, R.; Hasegawa, J.; Ishida, M.; Nakajima, T.; Honda, Y.; Kitao, O.; Nakai, H.; Vreven, T.; Montgomery Jr., J. A.; Peralta, J. E.; Ogliaro, F.; Bearpark, M.; Heyd, J. J.; Brothers, E.; Kudin, K. N.; Staroverov, V. N.; Keith, T.; Kobayashi, R.; Normand, J.; Raghavachari, K.; Rendell, A.; Burant, J. C.; Iyengar, S. S.; Tomasi, J.; Cossi, M.; Rega, N.; Millam, J. M.; Klene, M.; Knox, J. E.; Cross, J. B.; Bakken, V.; Adamo, C.; Jaramillo, J.; Gomperts, R.; Stratmann, R. E.; Yazyev, O.; Austin, A. J.; Cammi, R.; Pomelli, C.; Ochterski, J. W.; Martin, R. L.; Morokuma, K.; Zakrzewski, V. G.; Voth, G. A.; Salvador, P.; Dannenberg, J. J.; Dapprich, S.; Daniels, A. D.; Farkas, O.; Foresman, J. B.; Ortiz, J. V.; Cioslowski, J.; Fox, D. J. Gaussian, Inc., Wallingford CT, 2009.
- Shkir, M.; Muhammad, S.; AlFaify, S.; Chaudhry, A. R.; Al-Sehemi, A. G. Arab. J. Chem. 2016, DOI: https://doi.org/10.1016/j.arabjc.2016.06.016.

This work is licensed under a Creative Commons Attribution 4.0 International License.
![]()
A New Edition of Web of Science
Journal Impact Factor
2022: 0.5
Five Year: 0.8
Journal is Indexed in

Cabells Whitelist
![]()


