Data on the Corrosion Resistance and Polarization Behaviour of Lean Austenitic and Ferritic Stainless Steels in Neutral Chloride Media
Roland Tolulope Loto*
Department of Mechanical Engineering, Covenant University, Ota, Ogun State, Nigeria.
Corresponding Author E-mail tolu.loto@gmail.com
DOI : http://dx.doi.org/10.13005/ojc/350330
Article Received on : 21-02-2019
Article Accepted on : 09-06-2019
Article Published : 21 Jun 2019
Stainless steels are extensively applied in diverse industries due to their exceptional corrosion resistance. The corrosion resistance of alloy stainless steels (316L austenitic and 430Ti ferritic stainless steel) was studied in neutral chloride solutions with chloride concentrations of 1%, 2%, 3%, 4%, 5% and 6%. Their general and localized corrosion resistance were compared and discussed in addition to their passivation characteristics. Corrosion rate results obtained showed 430Ti exhibited slightly greater general resistance to chloride attack compared to 316L. Further investigation showed 316L steel exhibited higher resistance to localized corrosion attack to its resilient passive film. 430Ti exhibited cathodic and anodic passivation compared to 316L which only exhibited anodic passivation. Optical microscopic analysis showed the presence of small, superficial corrosion pits on 316L steel compared to 430Ti, which exhibited deep corrosion pits.
KEYWORDS:Corrosion; Pitting; NaCl; Steel
Download this article as:| Copy the following to cite this article: Loto R. T. Data on the Corrosion Resistance and Polarization Behaviour of Lean Austenitic and Ferritic Stainless Steels in Neutral Chloride Media. Orient J Chem 2019;35(3). |
| Copy the following to cite this URL: Loto R. T. Data on the Corrosion Resistance and Polarization Behaviour of Lean Austenitic and Ferritic Stainless Steels in Neutral Chloride Media. Orient J Chem 2019;35(3). Available from: https://bit.ly/2N0ziZZ |
Introduction
Corrosion of stainless steel in reducing/oxidizing environments is a major problem of global and industrial significance due to the secondary problems associated with it.1,2 Stainless steels displays enhanced corrosion resistance properties in conditions destructive to carbon steels due to the presence of Cr and other alloying elements. Cr chemically combines with O2, to form an impenetrable oxide, which protects the alloy from chloride and other aggressive anions. The nature of the protective oxide formed on stainless steels is the product of the metallurgical structure and phase constituents of the steel. Breakdown of the passive film in the presence of chlorides and the resulting localized corrosion is one of the important factors responsible for failure of stainless steels.3-7 Chloride anion containing environments are usually encountered during application of stainless steels in industries such as marine/shipping, oil and gas production, power generating plants, industrial plants located along seacoast, oil field water injection and desalination plants. Corrosion problems associated with stainless steels within these environments is responsible for catastrophic failures, plant shutdown, high maintenance cost and increase in sales cost to end users. The inherent instability of stainless steels in their refined forms is the basic cause of their corrosion as they tend to revert to their natural states through interaction with corrosive anions in their environment of application. Differential concentrations of chlorides have been known to reduce the operating lifespan of stainless steels.6,8-9 It must be noted that appropriate selection of stainless steels with respect to corrosivity and composition of the operating environment is one of the major factors sustaining the viability of steels in service though in many cases corrosion inhibitors are applied.10,11 The focus given to material selection has increased over the years.12 Corrosion resistance of stainless steels vary with respect to general and localized corrosion as a result of the fundamental property of the electrochemical processes involved and the nature of the corrosive environment.13 Application of stainless steels in operating conditions where they are most effective is very important. This research studies and compares the general and localized corrosion resistance of 316L austenitic and 430Ti ferritic stainless steels in varying concentrations of chloride in neutral chloride environment.
Experimental Procedure
316L austenitic (316L) and 430Ti ferritic (430Ti) stainless steel specimen plates were cut to average dimensions of 1 cm by 1 cm rod with manual hack saw. The specimens were encased in resin mounts and metallographically prepared using emery papers of 80, 120, 220, 800 and 1000 grits. They were subsequently polished with 6 um diamond paste for polarization test. Neutral chloride solution as prepared in volumetric concentration of 1%, 2%, 3%, 4%, 5% and 6% NaCl concentration from analar grade NaCl in distilled H2O at 200 mL each. Potentiodynamic polarization test was performed with Digi-Ivy 2300 potentiostat at 25°C ambient temperature. Resin mounted 316L and 430Ti stainless steel electrodes with surface area of 1 cm2, Pt counter electrode and silver chloride reference electrode (Ag/AgCl) were immersed in 100 mL of the chloride test solution and connected to the potentiostat. Potentiodynamic measurement was performed from -1.5V to 1.5 V at a scan rate of 0.0015 V/s. Omax metallurgical microscope was employed to visualize and capture images of the mounted steel before corrosion and after corrosion test. The corrosion current density (Icorr) and corrosion potential (Ecorr) were calculated from the Tafel plots of potential versus log current. The corrosion rate (ɤ) was determined from equation 1.
![]()
where Icorr is the current density in µA/cm2, ρ is the density in g/cm3; Eq is the specimen equivalent weight in grams. 0.00327 is a constant for corrosion rate calculation in mm/y.
Polarization resistance (Rp) was determined from the equation below;
![]()
where Ba is the anodic Tafel slope and Bc is the cathodic Tafel slope, both are measured as (V vs Ag/AgCl/dec). Optical microscopic images were produced from captured images of the steel morphology before and after the electrochemical tests.
Results and Discussion
Potentiodynamic Polarization Studies
Tables 1 and 2 shows the data obtained from the potentiodynamic polarization tests for 316L and 430Ti stainless steels. Figs. 1 and 2 shows the polarization curves of 316L and 430Ti obtained from the tests. The corrosion rates of 316L were generally higher than the values obtained for 430Ti in the neutral chloride solution at specific NaCl concentrations (1% – 6% NaCl). This observation is due to the higher tendency of 316L valence atoms to oxidize than 430Ti in the presence of chlorides. While the corrosion resistance of 316L is proportional to NaCl concentration, the corrosion rate value of 430Ti bears no proportional relationship signifying greater general corrosion resistance as earlier mentioned. At 1% NaCl, 316L has a corrosion rate of 0.076 mm/y which corresponds to 7.33 x 10⁻⁶ A/cm2. Increase in NaCl concentration caused the corrosion rate to increase, peaking at 0.129 mm/y at 6% NaCl concentration. Changes in the anodic-cathodic Tafel values couples with the active-passive transition of the corrosion potentials shows the redox reaction mechanism responsible for corrosion counterbalances each other. However, observation of the polarization plots in Fig. 1 shows at 1% NaCl concentration the mechanism of H2 evolution/O2 reduction reactions were partially restrained. Beyond 1% NaCl, the intensity of reduction reactions increased as shown from the absence of cathodic passivation. It must be noted that the presence of higher chloride atoms caused double anodic-cathodic peaks at some concentrations. Secondly higher chloride concentration extended the passivation range of the polarization plots after 1% NaCl before breakdown at the transpassive region. The corrosion rate values observed for 430Ti indicates a generally more stable passive film, though it does not necessarily constitute higher resistance to localized corrosion. However, the polarization plots in Fig. 2 confirm the results in Table 2. The plots show anodic and cathodic passivation behaviour at all concentrations studied before the intercept at corrosion potential. Cathodic passivation limited the hydrogen evolution and oxygen reduction reactions while anodic passivation stifled the surface oxidation of the steel. This observation is confirmed from the anodic-cathodic Tafel values in Table 2 whose variation tends to transition more smoothly at lower values compared to Table 1.
Table 1: Potentiodynamic polarization data on for 316L in neutral choride (1% – 6% NaCl concentration) solution .
| Sample | NaCl Conc. (%) | 316L Corrosion Rate (mm/y) | Corrosion Current (A) | Corrosion Current Density (A/cm2) | Corrosion Potential (V) | Polarization Resistance, Rp (Ω) | Cathodic Potential, Bc (V/dec) | Anodic Potential, Ba (V/dec) |
| A | 1 | 0.076 | 7.33E-06 | 7.33E-06 | -0.436 | 3505.00 | -4.274 | 2.525 |
| B | 2 | 0.086 | 8.22E-06 | 8.22E-06 | -0.855 | 3370.00 | -11.030 | 2.620 |
| C | 3 | 0.099 | 9.48E-06 | 9.48E-06 | -0.760 | 2723.00 | -14.180 | 5.520 |
| D | 4 | 0.102 | 9.74E-06 | 9.74E-06 | -0.072 | 3380.00 | -8.108 | 4.391 |
| E | 5 | 0.115 | 1.11E-05 | 1.11E-05 | -0.901 | 2321.00 | -11.130 | 1.644 |
| F | 6 | 0.129 | 1.24E-05 | 1.24E-05 | -0.874 | 2074.00 | -9.445 | 1.754 |
Table 2: Potentiodynamic polarization data on for 430Ti in neutral chloride (1% – 6% NaCl concentration) solution.
| Sample | NaCl Conc. (%) | 430Ti Corrosion Rate (mm/y) | Corrosion Current (A) | Corrosion Current Density (A/cm2) | Corrosion Potential (V) | Polarization Resistance, Rp (Ω) | Cathodic Potential, Bc (V/dec) | Anodic Potential, Ba (V/dec) |
| A | 1 | 0.048 | 4.51E-06 | 4.51E-06 | -0.424 | 5245.00 | -3.020 | 5.026 |
| B | 2 | 0.036 | 3.33E-06 | 3.33E-06 | -0.399 | 7723.00 | -3.724 | 5.285 |
| C | 3 | 0.044 | 4.09E-06 | 4.09E-06 | -0.608 | 6850.00 | -4.408 | 2.769 |
| D | 4 | 0.042 | 3.92E-06 | 3.92E-06 | -0.682 | 7380.00 | -4.625 | 2.826 |
| E | 5 | 0.044 | 4.06E-06 | 4.06E-06 | -0.281 | 6314.00 | -4.015 | 4.313 |
| F | 6 | 0.038 | 3.58E-06 | 3.58E-06 | -0.356 | 7175.00 | -5.295 | 4.934 |
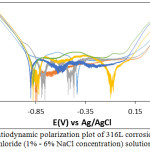 |
Figure 1: Potentiodynamic polarization plot of 316L corrosion in in neutral chloride (1% – 6% NaCl concentration) solution. |
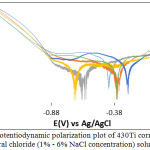 |
Figure 2: Potentiodynamic polarization plot of 430Ti corrosion in in neutral chloride (1% – 6% NaCl concentration) solution. |
Optical Microscopy Analysis
Fig. 3(a) and (b) shows the morphology of 316L and 430Ti before corrosion at mag. x100. Fig. 4(a) and (b) shows the morphology of 316L after corrosion from 1% and 6% NaCl test solution, while Fig. 5(a) and (b) shows the morphology of 430Ti after corrosion from 1% and 6% NaCl test solution. Observation of Fig. 4(a) shows the presence of corrosion pits associated with localized corrosion reactions on the steel surface. However, the pits appear superficial with little morphological alteration of the steel. On Fig. 4(b), the pits have disappeared due to the presence of excess chloride ions which generally oxidized the entire steel surface. Secondly, there is possibility that the excess chloride concentration reduced its oxidizing strength hence stifling its ability to displace the O2 atoms chemically combined with Cr. Observation of Fig. 5(a) and (b) shows fewer but deeper corrosion pits are visible on the surface of 430Ti signifying greater vulnerability to pitting corrosion. Increase in chloride concentration to 6% did not change the morphology of the steel except to slightly wear it due to increased redox reaction processes on the steel’s surface. Comparing the results from the polarization test with the morphological observations, it is evident that 316L is more resistant to localized corrosion reactions than 430Ti, while 430Ti displays greater resistance general surface corrosion than 316L.
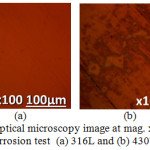 |
Figure 3: Optical microscopy image at mag. x100 before corrosion test (a) 316L and (b) 430Ti. |
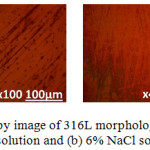 |
Figure 4: Optical microscopy image of 316L morphology after corrosion in (a) 1% NaCl solution and (b) 6% NaCl solution. |
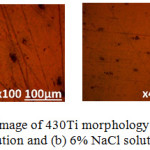 |
Figure 5: Optical microscopy image of 430Ti morphology after corrosion in (a) 1% NaCl solution and (b) 6% NaCl solution. |
Conclusion
430T9i ferritic stainless steel exhibited higher resistance to general corrosion compared to 316L austenitic stainless steel. The polarization plots of 430Ti displayed cathodic and anodic paeeivation regions due to suppression of the redox electrochemical processes. However, 316L austenitic steel proves to be more resistant to localized corrosion reactions compared to 430Ti ferritic steel. This was supported by images from optical microscopy analysis.
Acknowledgements
The authors sincerely appreciate Covenant University for the provision of research facilities and funding for publication.
Conflict of Interest
There is no conflict of interest.
References
- Loto, R.T.; Loto, C.A. J. Mater. Res. Technol., 2018, 7(3), 231–239.
- Abdallah, M. Mater. Chem. Phys., 2003, 82, 786–792.
- McCafferty, E. Corros. Sci., 2003, 45, 1421-1438.
- Abdel Rehim, S.S.; Hassan, H.H.; Amin, M.A. Corros. Sci., 2004, 46, 1921-1938.
- Loto, R.T.; Loto, C.A. J Fail. Anal. & Preven., 2017, 17(4), 672–679.
- Loto, R.T.; Loto, C.A. J. Mater. Res. Technol., 2017. doi.org/10.1016/j.jmrt.2017.07.004.
- Loto, R.T. J. Mater. Environ. Sci., 2013, 4(4), 448-459.
- Fong-Yuan M. Corrosive effects of chlorides on metals Pitting corrosion. Intech Open 2012, 139–78.
- Oliver, DC.; Sephton, M. J. South Afr. Inst. Mineral Metall., 2003, 103(2), 93–100.
- Loto, R.T. Results Phys., 2017, 7, 769–76.
- Loto, R.T. S. Afr. J. Chem., 2017, 24, 148–55.
- Strategic impact and cost of corrosion damage, http://www.corrosion-doctors.org/Why-Study/Strategic-Impact.htm. [Retrieved: 30/03/2017].
- Loto, R.T. Orient. J. Chem., 2017, 33(3), 1090-1096.

This work is licensed under a Creative Commons Attribution 4.0 International License.
![]()
A New Edition of Web of Science
Journal Impact Factor
2022: 0.5
Five Year: 0.8
Journal is Indexed in

Cabells Whitelist
![]()


