Cyclic Voltammetric Studies of Biologically Active Azomethine 2’-Hydroxyacetophenone Sulfamethoxazole
Gopal Lal Kumawat, Preeti Choudhary, Anil Kumar Varshney and Sarita Varshney*
Department of Chemistry, University of Rajasthan, Jaipur-302004, Rajasthan, India.
Corresponding Author E-mail: saritavarshney@rediffmail.com
DOI : http://dx.doi.org/10.13005/ojc/350327
Article Received on : 26-02-2019
Article Accepted on : 09-05-2019
Article Published : 17 May 2019
The cyclic voltammetric behavior of newly synthesized biologically active azomethine 2’-hydroxyacetophenone sulfamethoxazole (2’-HyAcPhSM) was examined at glassy carbon electrode in acetonitrile, acetone, methanol and DMF solvents using phosphate buffer and Britton-Robinson (BR) buffer. The effect of solvents, buffers, sweep rates and pH were calculated on peak potential and peak current. The cyclic voltammograms of 2’-HyAcPhSM exhibited two electronic, irreversible and diffusion-controlled single cathodic peak within the entire pH range which is attributed to the reduction of the azomethine group (‒CH=N‒) to amine group (‒CH2‒NH‒). The biological activity of synthesized 2’-HyAcPhSM compound were carried out against various bacteria and fungi.
KEYWORDS:Biological Activity; Cyclic Voltammetry; 2’-Hydroxyacetophenone Sulfamethoxazole
Download this article as:| Copy the following to cite this article: Kumawat G. L, Choudhary P, Varshney A. K, Varshney S. Cyclic Voltammetric Studies of Biologically Active Azomethine 2’-Hydroxyacetophenone Sulfamethoxazole. Orient J Chem 2019;35(3). |
| Copy the following to cite this URL: Kumawat G. L, Choudhary P, Varshney A. K, Varshney S. Cyclic Voltammetric Studies of Biologically Active Azomethine 2’-Hydroxyacetophenone Sulfamethoxazole. Orient J Chem 2019;35(3). Available from: https://bit.ly/2w5Eh0e |
Introduction
Schiff bases termed as anils, imines or azomethines and are first reported by Hugo Schiff in 1864. Schiff bases and their transition metal complexes exhibit a wide range of biological activity,1-4 corrosion inhibition effects5-8 and analytical applications9-13 have been prepared by condensing carbonyl compounds with amines in different conditions and in different solvents with the elimination of water molecule.14-19 The electrochemical behavior of Schiff bases have been also drawn the attention of many workers.20-24 However, insufficient informations are available in the literature regarding the electrochemical behavior of the Schiff bases of sulfa drugs and their transition metal complexes.
The present work emphasized on electrochemical behavior of 2’-HyAcPhSM with a view to investigate some important aspects such as charge-transfer coefficient (αn), diffusion coefficient (D01/2) and rate constant (K°f,h) by altering scan rate, solvent, buffer solution and pH of the electrochemical solution.
Experimental
Synthesis of 2’-Hydroxyacetophenone Sulfamethoxazole
All chemicals were analytical grade and of the highest available purity, and used without further purification. 2’-hydroxyacetophenone and sulfamethoxazole were obtained from Sigma-Aldrich. To synthesize 2’-hydroxyacetophenone sulfamethoxazole (2’-HyAcPhSM), 0.1 M solution of 2’-hydroxyacetophenone added to 0.1 M solution of sulfamethoxazole in ethanol and then reaction mixture was refluxed about two and half hour at 70°C. The product thus obtained was purified by washing with distilled water and then with ethanol. The brown solid crystals were obtained after recrystallization in ethanol. Melting point and yield were found 139°C and 68% respectively.
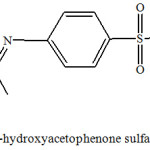 |
Figure 1: Synthesized 2’-hydroxyacetophenone sulfamethoxazole Schiff base. |
Elemental Analysis
Elemental analysis of 2’-HyAcPhSM were carried out using micro analytical technique on C, H, N, S, O elemental analyzer. Analytical data were found (Cal.): M. Wt.; 371.09 (371.41), C; 58.22 (58.21), H; 4.11 (4.61), N; 11.17 (11.31), O; 16.96 (17.23) and S; 8.55 (8.63).
Spectral Studies
Infrared Studies
The infrared spectra of 2’-HyAcPhSM were scanned in the range 4000-667 cm-1 using FT-IR spectrometer (Model 8400S, Schimadzu) inKBr pallets. The Schiff base compound contains five potential donor sites (i) phenolic oxygen, (ii) azomethine nitrogen, (iii) sulphonamide oxygen, (iv) sulphonamide nitrogen, and (v) ring nitrogen. The features observable in the infrared spectra of the compound is the intense and broad band at 3055 cm-1, showing the existence of intramolecular H-bonding between phenolic oxygen and azomethine nitrogen (υOH…N). The broad band at 3355 cm-1 due to phenolic –OH group and a sharp band at 1630 cm-1 assignable to the azomethine group (υC=N)25 are also appeared in this spectrum. The strong band at 1276 cm-1 indicates the presence of phenolic C-O stretching,26 in addition to other typical bands of phenyl ring vibrations at 1485 cm-1 and 754 cm-1. The bands at 1340 cm-1 and 1145 cm-1 are assigned to asymmetric and symmetric SO2 vibrations respectively.
1H NMR Studies
The 1HNMR spectra of compound was recorded on 300.4 MHz FT-NMR spectrometer (Model Jeol AL 300) in CDCl3 using TMS as internal standard. The compound exhibit multiplet signals corresponding to aromatic protons which occurs between d7.20-7.50 ppm. The resonance signals due to methyl protons (‒C(CH3)=N‒) are observed at d1.80 ppm. The sharp low field signal for the phenolic proton occur at d5.25 ppm which shows the presence of intramolecular hydrogen bond involving the phenolic proton and the azomethine nitrogen atom, thus implying a phenol-iminic structure.
Cyclic Voltammetric Studies of 2’-Hydroxyacetophenone Sulfamethoxazole
The cyclic voltammetric experiments were carried out using “ECDA–001 Basic Electrochemistry System”. A three electrode combination system which consisted of a working glassy carbon electrode, an Ag/AgCl reference electrode and Pt wire auxiliary electrode was used. To study the effect of solvents, buffers, scan rates and pH on redox behavior of compound, cyclic voltammograms were recorded in acetonitrile, acetone, methanol and DMF solvents using phosphate buffer (mixture of 0.2 M monobasic sodium phosphate, 0.2 M dibasic sodium phosphate and 0.1 M HCl/NaOH) and BR buffer (mixture of 0.04 M boric acid, 0.04 M phosphoric acid, 0.04 M acetic acid and 0.2 M sodium hydroxide) at different pH values. For this, 10 ml of 1 mM concentration solution (containing 1 ml of 0.01 M stock solution of compound in appropriate solvent and remaining 9 ml of phosphate/BR buffer solution of desired pH) were employed in voltammetric experiment on 50, 100, 150, 200 and 250 mV/s sweep rates, +1000 mV to -1800 mV potential range, and at 0.1 mA current sensitivity. All cyclic voltammograms were obtained, exhibits one irreversible reduction peak in the cathodic direction and no anodic peak in reverse scan (fig. 2 to 4). Thus, to explain irreversible electrochemical reduction nature of 2’-HyAcPhSM, kinetic parameters such as charge-transfer coefficient (αn), diffusion coefficient (D01/2) and rate constant (k°f,h) have been evaluated using equations27-30 1 to 3 and are reported in tables 1 to 3.
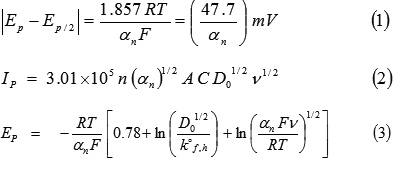
Where Ep, Ep/2, Ip, ν, A, n and C are peak potential, half peak potential, peak current, scan rate, electrode surface area, number of electrons involved in electrode process and concentration of the electrolytic solution. All other symbols have their usual significance.
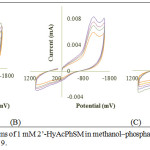 |
Figure 2: Cyclic voltammograms of 1 mM 2’-HyAcPhSM in methanol‒phosphate buffer at (A) pH 5 (B) pH 7 and (C) pH 9. |
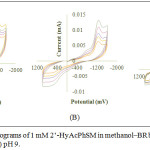 |
Figure 3: Cyclic voltammograms of 1 mM 2’-HyAcPhSM in methanol‒BR buffer at (A) pH 5 (B) pH 7 and (C) pH 9. |
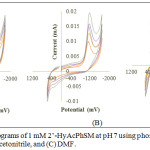 |
Figure 4: Cyclic voltammograms of 1 mM 2’-HyAcPhSM at pH 7 using phosphate buffer in (A) acetone (B) acetonitrile, and (C) DMF. |
Table 1: Effect of sweep rate on voltammetric parameters of 1 mM 2’-HyAcPhSM in methanol‒phosphate buffer at pH 5, 7 and 9 (fig. 2‒A, B and C).
| pH | v (mVs-1) | Epc (mV) | Ipc (µA) | Ep/2 (mV) | Ipc/ ν1/2 | αn | (i. e. D01/2) (cm2s-1) | k°f,h (cm.s-1) |
| 5 | 50 | -1097 | 3.49 | -904 | 0.4935 | 0.2471 | 6.2493 | 2.46×10-07 |
| 100 | -1124 | 4.89 | -921 | 0.4890 | 0.2349 | 6.3500 | 4.52×10-07 | |
| 150 | -1145 | 5.64 | -945 | 0.4605 | 0.2385 | 5.9356 | 3.68×10-07 | |
| 200 | -1164 | 5.99 | -958 | 0.4235 | 0.2315 | 5.5406 | 4.49×10-07 | |
| 250 | -1181 | 7.64 | -978 | 0.4831 | 0.2349 | 6.2746 | 4.19×10-07 | |
| 7 | 50 | -1112 | 5.77 | -921 | 0.8160 | 0.2497 | 10.2784 | 3.14×10-07 |
| 100 | -1138 | 6.12 | -936 | 0.6120 | 0.2361 | 7.9276 | 4.73×10-07 | |
| 150 | -1178 | 6.58 | -957 | 0.5372 | 0.2158 | 7.2793 | 8.93×10-07 | |
| 200 | -1204 | 7.25 | -984 | 0.5126 | 0.2168 | 6.9303 | 7.55×10-07 | |
| 250 | -1234 | 8.01 | -999 | 0.5065 | 0.2218 | 6.7701 | 5.08×10-07 | |
| 9 | 50 | -1124 | 6.25 | -953 | 0.8838 | 0.2789 | 10.5344 | 8.43×10-08 |
| 100 | -1138 | 8.78 | -964 | 0.8780 | 0.2741 | 10.5557 | 1.26×10-07 | |
| 150 | -1178 | 10.21 | -975 | 0.8336 | 0.2349 | 10.8254 | 5.76×10-07 | |
| 200 | -1204 | 11.97 | -986 | 0.8464 | 0.2188 | 11.3900 | 1.14×10-06 | |
| 250 | -1280 | 13.98 | -1005 | 0.8841 | 0.1697 | 13.5085 | 8.01×10-06 |
Table 2: Effect of sweep rate on voltammetric parameters of 1 mM 2’-HyAcPhSM in methanol‒BR buffer at pH 5, 7 and 9 (fig. 3‒A, B and C).
| pH | v(mVs-1) | Epc(mV) | Ipc(µA) | Ep/2(mV) | Ipc/ ν1/2 | αn | (i. e. D01/2) (cm2s-1) | k°f,h(cm.s-1) |
| 5 | 50 | -1153 | 6.24 | -968 | 0.8824 | 0.2578 | 10.9396 | 1.59×10-07 |
| 100 | -1168 | 7.77 | -975 | 0.7770 | 0.2471 | 9.8382 | 2.76×10-07 | |
| 150 | -1187 | 8.79 | -984 | 0.7177 | 0.2349 | 9.3198 | 4.57×10-07 | |
| 200 | -1212 | 10.02 | -998 | 0.7085 | 0.2228 | 9.4466 | 7.32×10-07 | |
| 250 | -1234 | 10.91 | -1017 | 0.6900 | 0.2198 | 9.2640 | 7.64×10-07 | |
| 7 | 50 | -1175 | 5.24 | -981 | 0.7410 | 0.2458 | 9.4073 | 1.85×10-07 |
| 100 | -1199 | 7.56 | -992 | 0.7560 | 0.2304 | 9.9134 | 4.35×10-07 | |
| 150 | -1221 | 9.25 | -1001 | 0.7552 | 0.2168 | 10.2099 | 8.35×10-07 | |
| 200 | -1240 | 10.45 | -1016 | 0.7389 | 0.2129 | 10.0796 | 9.69×10-07 | |
| 250 | -1264 | 12.01 | -1028 | 0.7595 | 0.2021 | 10.6352 | 1.55×10-06 | |
| 9 | 50 | -1212 | 6.91 | -1012 | 0.9772 | 0.2385 | 12.5958 | 2.42×10-07 |
| 100 | -1234 | 7.89 | -1024 | 0.7890 | 0.2271 | 10.4208 | 3.89×10-07 | |
| 150 | -1256 | 9.25 | -1035 | 0.7552 | 0.2158 | 10.2331 | 6.52×10-07 | |
| 200 | -1274 | 10.45 | -1051 | 0.7389 | 0.2139 | 10.0570 | 6.97×10-07 | |
| 250 | -1298 | 12.01 | -1079 | 0.7595 | 0.2178 | 10.2450 | 5.38×10-07 |
Table 3: Effect of sweep rate on voltammetric parameters of 1 mM 2’-HyAcPhSM in different solvents with phosphate buffer at pH 7 (fig. 4‒A, B and C).
| Solvent | v(mVs-1) | Epc(mV) | Ipc(µA) | Ep/2(mV) | Ipc/ ν1/2 | αn | (i. e. D01/2) (cm2s-1) | k°f,h(cm.s-1) |
| Acetone | 50 | -914 | 10.56 | -742 | 1.4934 | 0.2773 | 17.8509 | 1.48×10-06 |
| 100 | -942 | 14.78 | -751 | 1.4780 | 0.2497 | 18.6169 | 4.21×10-06 | |
| 150 | -988 | 17.45 | -769 | 1.4247 | 0.2178 | 19.2171 | 1.08×10-05 | |
| 200 | -1016 | 20.56 | -794 | 1.4538 | 0.2148 | 19.7425 | 1.13×10-05 | |
| 250 | -1055 | 23.68 | -812 | 1.4976 | 0.1962 | 21.2781 | 2.02×10-05 | |
| Acetonitrile | 50 | -1056 | 9.04 | -935 | 1.2784 | 0.3942 | 12.8172 | 2.23×10-09 |
| 100 | -1098 | 12.79 | -971 | 1.2790 | 0.3755 | 13.1368 | 3.67×10-09 | |
| 150 | -1132 | 15.65 | -1012 | 1.2778 | 0.3975 | 12.7578 | 1.04×10-09 | |
| 200 | -1164 | 18.05 | -1035 | 1.2763 | 0.3697 | 13.2122 | 2.57×10-09 | |
| 250 | -1197 | 19.97 | -1063 | 1.2630 | 0.3559 | 13.3253 | 3.36×10-09 | |
| DMF | 50 | -1218 | 8.34 | -1078 | 1.1794 | 0.3407 | 12.7193 | 2.16×10-09 |
| 100 | -1231 | 12.45 | -1089 | 1.2450 | 0.3359 | 13.5217 | 3.42×10-09 | |
| 150 | -1256 | 15.42 | -1101 | 1.2590 | 0.3077 | 14.2863 | 1.21×10-08 | |
| 200 | -1289 | 17.98 | -1112 | 1.2713 | 0.2694 | 15.4162 | 6.50×10-08 | |
| 250 | -1307 | 20.01 | -1125 | 1.2655 | 0.2620 | 15.5607 | 8.72×10-08 |
Results and Discussion
Effect of Scan Rate
Effect of scan rate on the cathodic peak potential of 1 mM 2’-HyAcPhSM were examined in acetonitrile, acetone and DMF solvents using phosphate buffer at pH 7, methanol‒phosphate buffer and methanol‒BR buffer at pH 5, 7 and 9. All cyclic voltammograms were taken by varying the scan rate from 50 mV/s to 250 mV/s in all cases. The peak potential shifted to more negative value with an increase in the scan rate, implying that electrochemical process was irreversible31 in nature. The irreversibility of reduction process is confirmed from the linear dependence of the cathodic peak potential (Epc) with ln v (fig. 5 to 8). The peak potential shift is larger at high scan rates. This implies that under these conditions the electrochemical processes are more irreversible. In all the cases the cathodic peak current (Ipc) is proportional to the square root of the scan rate (ν1/2) (tables 1 to 3), which infer that under these conditions, the electrochemical processes are diffusion controlled.27,32
Effect of Solvent
The effect of solvent on electrochemical properties can’t be explained by any single chemical or physical property of the solvent or by a single unified theory. It can be explained by viscosity, dielectric constant, steric factor and polarity of the solvent.33-34 In this work cyclic voltammograms of 2’-HyAcPhSM were recorded in acetone, acetonitrile, methanol and DMF solvents with phosphate buffer. It was observed that, the peak potential has maximum negative potential in presence of DMF and minimum in presence of acetone. This trend is parallel to the trend in viscosity, dielectric constant and polarity of these solvents.35-36
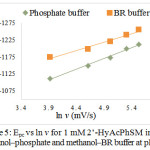 |
Figure 5: Epc vs ln v for 1 mM 2’-HyAcPhSM in methanol‒phosphate and methanol‒BR buffer at pH 7. |
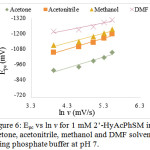 |
Figure 6: Epc vs ln v for 1 mM 2’-HyAcPhSM in acetone, acetonitrile, methanol and DMF solvent using phosphate buffer at pH 7. |
Effect of pH
The effect of pH on electrochemical reduction behavior of 2’-HyAcPhSM were studied in acidic, neutral and alkaline media at pH 5, 7 and 9 in methanol‒phosphate buffer and methanol‒BR buffer. The reported cyclic voltammograms, shows that cathodic peak potentials have negative shift with the increase of the pH, suggesting that the reduction process involves protons30. The relationship between the peak potentials (Epc) and the pH of the electrochemical solution were investigated (fig. 7 and 8). The Ep/2 values are also found to be pH dependent and shift towards more negative potential that indicates the involvement of protons in the electrode process. The increase in the pH value increases the dissociation constant of protonated species which affects the protonation rate, and consequently Ep/2 value of the reduction wave shifts towards more negative value. These phenomena appear to have the same results in methanol‒phosphate buffer as well as in methanol‒BR buffer systems (tables 1 and 2).
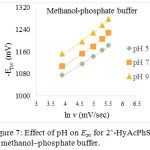 |
Figure 7: Effect of pH on Epc for 2’-HyAcPhSM in methanol‒phosphate buffer. |
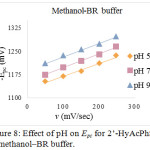 |
Figure 8: Effect of pH on Epc for 2’-HyAcPhSM in methanol‒BR buffer. |
Effect of Buffer Solutions
The effect of buffer solutions on electrochemical behavior of 2’-HyAcPhSM were investigated by taking cyclic voltammograms in phosphate buffer (and Britton‒Robinson buffer with methanol solvent. Cyclic voltammograms obtained in both buffers with methanol solvent shows that cathodic peak potential (Epc) values of compound are found to be changed with change in buffer solution. The cathodic peak potential shifts to more negative value at all scan rates and on same pH in Briton‒Robinson buffer compared to phosphate buffer. This means, that the electrochemical reduction is dependent on polarity of buffer solutions. The Epc value in phosphate buffer at 50 mV/s scan rate is -1112 mV and at 250 mV/s scan rate is -1234 mV while in Briton‒Robinson buffer at 50 mV/s is -1175 mV and at 250 mV/s scan rate is -1275 mV which is greater than phosphate buffer. So it can be concluded that reduction is easier in more polar phosphate buffer solution and difficult in less polar Briton-Robinson buffer solution where the ionization is low as evident from the tables 1 and 2.
Biological Studies
The In vitro biological screening effects of 2’-HyAcPhSM were tested against bacteria Staphylococcus aureus, Streptococci and Escherichia coli, and fungi Candida albicans and Aspergillus niger by agar well diffusion method.37 For this purpose, the standard drug Ciprofloxacin and Ketoconazole were used for antibacterial screening and antifungal screening respectively. The antimicrobial/antifungal spectrum of the experimental compound were determined for the bacterial/fungal species in terms of inhibited zone size around each well. For each bacterial/fungal strain controls were maintained by pure solvents instead of the compound solution.38-39 The compound is reported to have most antibacterial activity against Escherichia coli (activity index 0.9615 at 60 mg/mL concentration) and most antifungal activity against Candidi albicans (activity index 1.3529 at 60 mg/mL concentration) (table 4). In comparison with Ciprofloxacin drug, the compound is less active against all tested bacteria in the compound concentration range 20 mg/mL to 60 mg/mL. However, the compound is more active than standard Ketoconazole drug, against Candida albicans in the compound concentration range 40 mg/mL to 60 mg/mL and Aspergillus niger at 60 mg/mL compound concentration (table 4).
Table 4: Antibacterial and antifungal activity of 2’-HyAcPhSM against bacteria Staphylococcus aureus, Streptococci and Escherichia coli, and fungi Candida albicans and Aspergillus niger.
| Conc. (µg/mL) | Staphylococcus Aureus | Streptococci | Escherichia Coli | Candida albicans | Aspergillus niger | |||||
| I. Z. (mm) | ActivityIndex | I. Z.(mm) | ActivityIndex | I. Z.(mm) | ActivityIndex | I. Z.(mm) | ActivityIndex | I. Z.(mm) | ActivityIndex | |
| 20 | 13 | 0.5000 | 10 | 0.3846 | 15 | 0.5759 | 13 | 0.7647 | 9 | 0.5294 |
| 30 | 15 | 0.5769 | 12 | 0.4615 | 17 | 0.6538 | 15 | 0.8823 | 11 | 0.6470 |
| 40 | 16 | 0.6153 | 14 | 0.5384 | 20 | 0.7692 | 18 | 1.0588 | 14 | 0.8235 |
| 50 | 18 | 0.6923 | 17 | 0.6538 | 22 | 0.8461 | 20 | 1.1764 | 16 | 0.9411 |
| 60 | 20 | 0.7692 | 19 | 0.7307 | 25 | 0.9615 | 23 | 1.3529 | 19 | 1.1117 |
I. Z. = Inhibition zone in mm; Ciprofloxacin=26 mm and Ketoconazole=17 mm.
Conclusion
It was concluded from the electrochemical data that the electrochemical reduction of 2’-HyAcPhSM is irreversible and diffusion controlled in nature under the pH 5 to 9 and scan rate range from 50 mV/s to 250 mV/s. The irreversibility of the process was found more at higher scan rates and higher pH values in all applied conditions that indicate the scan rate and pH dependence of the electrode process. It was also found that the reduction process is dependent on the polarity of the medium. The In vitro biological screening studies show sufficient activity against tested microorganisms in the compound concentration range of 20 to 60 mg/mL.
Acknowledgements
The authors express sincere thanks to the Head, Department of Chemistry, University of Rajasthan, Jaipur for providing research facilities. The author Preeti Choudhary is thankful to UGC, New Delhi for financial assistance.
References
- Rauf, A.; Shah, A.; Khan, A. A.; Shah, A. H.; Abbasi, R.; Qureshi, I. Z.; Ali, S. Spectrochim. Acta, Part A 2017, 176, 155-167.
- Mohamed, G. G.; Omar, M. M.; Hindy, A. M. Turk. J. Chem. 2006, 30, 361-382.
- Ismail, T. M. J. Coord. Chem. 2006, 59(3), 255-270.
- Nanjundan, N.; Narayanasamy, R.; Geib, S.; Velmurugan, K.; Nandhakumar, R.; Balakumaran, M. D.; Kalaichelvan, P. T. Polyhedron 2016, 110, 203-220.
- Ashassi-Sorkhabi, H.; Shabani, B.; Aligholipour, B.; Seifzadeh, D. App. Surf. Sci. 2006, 252, 4039-4047.
- Ehteshamzade, M.; Shahrabi, T.; Hosseini, M. G. App. Surf. Sci. 2006, 252, 2949-2959.
- Dadgarnezhad, A.; Sheikhshoaie, I.; Baghaei, F. Asian J. Chem. 2004, 16, 1109-1118.
- Shokry, H.; Yuasa, M.; Sekine, I.; Issa, R. M.; El-Baradie, H. Y.; Gomma, G. K. Corros. Sci. 1998, 40(12), 2173-2186.
- Dey, R. K.; Jha, U.; Singh, A. C.; Samal, S.; Ray, A. R. Anal. Sci. 2006, 22(8), 1105-1110.
- Sabry, S. M. J. Pharm. Boimed. Anal. 2006, 40(5), 1057-1067.
- Okochi, M.; Ohta, H.; Taguchi, T.; Matsunaga, T. Electrochim. Acta 2005, 51(5), 952-955.
- Salimi, A.; Mamkhezri, H.; Mohebbi, S. Electrochem. Commun. 2006, 8(5), 688-696.
- Gholivand, M. E. B.; Ahmadi, F.; Rafiee, E. Electroanalysis (N. Y. N. Y.) 2006, 18(16), 1620-1626.
- Liu, G.; Cogan, D. A.; Owens, T. D.; Tang, T. P.; Ellman, J. A. J. Org. Chem. 1999, 64(4), 1278-1284.
- Love, B. E.; Ren, J. J. Org. Chem. 1993, 58(20), 5556-5557.
- Dalpozzo, R.; De Nino, A.; Nardi, M.; Russo, B.; Procopio, A. Synthesis 2006, 7, 1127-1132.
- Naeimi, H.; Salimi, F.; Rabiei, K. J. Mol. Catal. A: Chem. 2006, 260(1-2), 100-104.
- Vass, A.; Dudás, J.; Varma, R. S. Tetrahedron Lett. 1999, 40(27), 4951-4954.
- Tanaka, K.; Shiraishi, R. Green Chem. 2000, 2(6), 272-273.
- Shabbir, M.; Akhter, Z.; Ahmad, I.; Ahmed, S.; Ismail, H.; Mirza, B.; McKee, V.; Bolte, M. J. Mol. Struct. 2016, 1116, 84-92.
- Pogány, L.; Moncol, J.; Gál, M.; Šalitroš, I.; Boča, R. Inorg. Chim. Acta 2017, 462, 23-29.
- Kong, D. S.; Wan, L. J.; Han, M. J.; Pan, G. B.; Lei, S. B.; Bai, C. L.; Chen, S. H. Electrochim. Acta 2002, 48(4), 303-309.
- Shabbir, M.; Akhter, Z.; Ahmad, I.; Ahmed, S.; Bolte, M.; Ismail, H.; Mirza, B. Inorg. Chim. Acta 2017, 463, 102-111.
- El-Hallag, I. S.; El-Hefnawy, G. B.; Moharram, Y. I.; Ghoneim, E. M. Can. J. Chem. 2000, 78(9), 1170-1177.
- Welsh, W. A.; Reynolds, G. J.; Henry, P. M. Inorg. Chem. 1977, 16(10), 2558-2561.
- Temel, H.; Şekerci, M. Synth. React. Inorg. Met.-Org. Chem. 2001, 31(5), 849-857.
- Parajón‐Costa, B. S.; González‐Baró, A. C.; Baran, E.J. Z. Anorg. Allg. Chem. 2002, 628(6), 1419-1424.
- Bard, A. J.; Faulkner, L. R.; Leddy, J.; Zoski, C. G. Wiley, New York 1980, 2.
- Noel, M.; Vasu, K. I. Aspect Publications, London, 1990.
- Sharma, P.; Kumar, A.; Sharma, M.; Upadhyay, S.; Indian J. Chem. 2004, 43B, 2653-2660.
- Meites, L.; Israel, Y. J. Am. Chem. Soc. 1961, 83(24), 4903-4906.
- Jain, R.; Karaiya, S.; Yadav, R. L.; Arya, V. K. J. Sci. Ind. Res. India 2012, 71, 606-611.
- Larson, R. C.; Iwamoto, R. T. J. Am. Chem. Soc. 1960, 82(13), 3239-3244.
- Coetzee, J. F.; Hedrick, J. L. J. Phys. Chem. 1963, 67(2), 221-226.
- Bairwa, B. S.; Goyal, M.; Sharma, I. K.; Varshney, S.; Verma, P. S. Indian J. Chem. 2007, 46, 778-782.
- Sangtyani, R.; Rawat, J.; Verma, P. S.; Varshney, A. K.; Varshney, S. J. Indian Chem. Soc. 2011, 88(10), 1553-1560
- Irshad, S.; Mahmood, M.; Perveen, F. Res. J. Bio. 2012, 2(1), 1-8.
- Perez, C.; Paul, M.; Bazerque, P. Acta. Biol. Med. Exp. 1990, 15, 113-115.
- Bonjar, S.; Aghighi, S.; Karimi, N. A. J. Biol. Sci. 2005, 4, 405-412.

This work is licensed under a Creative Commons Attribution 4.0 International License.
![]()
A New Edition of Web of Science
Journal Impact Factor
2022: 0.5
Five Year: 0.8
Journal is Indexed in

Cabells Whitelist
![]()


