Calculation of Gas-Phase Gibb’s free Energy Changes of Some Small Molecules with Monte Carlo, DFT (MPW1PW91), Composite (CBS-QB3), Gaussian-n (G1, G2) and Gaussian Modified (G2MP2) Methods
Muhammad Abul Kashem Liton, Md. Nuruzzaman* and Sabrina Helen
Department of Chemistry, Faculty of Science, Mawlana Bhashani Science and Technology University, Santosh, Tangail-1902, Bangladesh.
Corresponding Author E-mail: md.nuruzzaman04@gmail.com
DOI : http://dx.doi.org/10.13005/ojc/350305
Download this article as:
![]()
A set of 74 small molecules was employed to generate a quantitative structure-property relationship (QSPR) model for predicting gas-phase Gibb’s free energy changes (ΔGgas) on the simplified molecular input line entry system (SMILES). To obtain the models, the Monte Carlo method (MCM) was applied to calculate the descriptors. The best proposed model of them provides an excellent statistical result of r2 = 0.9866, q2 = 0.9857, s = 2.48 and F = 4346 for the training set, and r2 = 0.9340, q2 = 0.8418, s = 5.80, F = 149 for the test set. Consequently, the gas-phase Gibb’s free energy changes were also calculated in DFT (MPW1PW91/6-311+G(2d,2p)), CBS-QB3, G1, G2 and G2MP2 methods which showed a very good agreement with experimental values.
KEYWORDS:CBS-QB3; G1; G2; Monte Carlo; QSPR; SMILES; Training Set; Test Set
Introduction
The Gibb’s free energy or chemical potential in basic theoretical research plays an important role on chemical and biological systems.1 These are the central quantities that determine the route of spontaneous change for a system or explain the ability of biological systems in all organisms to resist a natural tendency to disorder. Examination of free energy behavior of such systems enables us to fully understand the structural, kinetic and dynamic characteristics of processes like – protein ligand binding constants,2 permeability coefficients,3 conformational equilibrium constants,4 membrane-water partition coefficient,5,6 electron transfer,7 solvation8 etc.
Numerous reports have been appeared in the literature describing computational methods for the calculation of gas-phase Gibbs free energy9-14 but calculation in computational methodology along with QSPR modeling is not randomly found. In recent years, rapid advances in theory of calculations, continuous increasing of computational capabilities as well as statistical mechanics make the determination of Gibb’s free energy changes more reliable, efficient and well organized.15-18
For an instance, protein–ligand binding constants and membrane–water partition coefficients are an essential part of rational drug design, and cannot be evaluated reliably and accurately without the knowledge of the associated free energy changes. The ability to calculate free energy in an efficient manner is of paramount importance in the structural and thermodynamic study of gas hydrate systems.19 Thus MDFE simulations have been improved by new treatments of long-range electrostatic interactions and, successful in determination of protein–ligand binding constants.2
In this study we have developed a QSPR model and established a computational methodology for the calculation of gas phase Gibb’s free energy of some small molecules which have many applications in nature. In addition we have focused our study to calculate the free energies as an essential complement to experimental quantities from reported literatures and to establish the accurate, low cost-effective and reliable methods for predicting the gas-phase Gibbs free energy changes.
Materials and Methods
Data
Table 1 shows structural details of the 74 small molecules used in this study. The experimental gas phase Gibb’s free energy changes (at 298.15 K and 1 atmospheric pressure) were taken from reported literatures. All the gas-phase Gibb’s free energy chages in data set represented in kcal/mol. The data set was splitted into two: a training set (61) and a test set (13) where the molecules in test set were arranged in random manner.
Descriptors Calculation
Three kinds of descriptors: graph-based, SMILES-based, and hybrid descriptors were generated using CORAL software.20 Furthermore three kinds of molecular graphs: hydrogen suppressed graph (HSG), hydrogen filled graph (HFG), and graph of atomic orbitals (GAO) were also generated by CORAL.21
The graph-based optimal descriptors were calculated as the following:
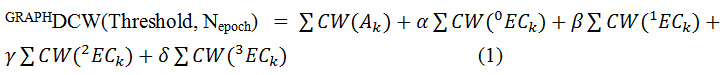
Where, Ak is a chemical element like C, N, O, etc., for HSG and HFG; or atomic orbitals, such as 1s1, 2p3, 3d10, etc., for GAO; 0ECk,1ECk, …3ECk represents the hierarchy of the Morgan extended connectivity; α, β, γ, and δ can be 1 or 0: combinations of their values gives possibility to define various of the graph-based optimal descriptor; CW(x) is the correlation weight of a molecular feature (encoded by Ak or xECk).
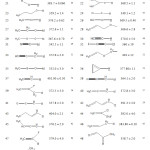 |
Table 1: List of the molecules with experimental values employed for the calculation of gas-phase Gibb’s free energies (at 298.15 K and 1 atmospheric pressure). |
Similarly the SMILES-based optimal descriptors were calculated as the following:

where, Sk, SSk, and SSSk are one-, two-, and three-component SMILES attributes, respectively. NOSP, HALO, and BOND are indices that related to the presence or absence of chemical elements like N, O, S and P (NOSP); F, Cl, and Br (HALO). The BOND is related to a mathematical function where double (=), triple (#), or stereo chemical bonds may be present or absent and finally α, β, γ, x, y, and z can be 1 or 0: combinations of their values provide possibility to define various versions of the SMILES-based optimal descriptor. CW(x) is the correlation weight of a molecular feature (encoded by SkSkSkor xECk).
The hybrid optimal descriptors were calculated by taking into account both representations of the molecular structure by GRAPH andby SMILES.
HYBRIDDCW(Threshold, Nepoch) = GRAPHDCW(Threshold, Nepoch) + SMILESDCW(Threshold, Nepoch) (3)
Threshold and Nepoch in equations (1) – (3) represent the parameters of the Monte Carlo optimization. The threshold is the criterion for classification of the components of the representation of the molecular structure into two classes: noise (rare) and active (not rare). The correlation weight of a rare component is fixed as zero; hence rare component is not involved in the building up of the model. Nepoch is the number of epochs of the Monte Carlo optimization.
Computational Calculation
All the calculations were performed on Intel core-i5 Fujitsu Lap-top Computer with 3–4 GB of memory and 48 GB of scratch disk space, using CORAL20 and Gaussian 09 software.79 Every structure is initially optimized at 298.15 K in the gas phase at the Hartree–Fock (HF) level80-82 and finally G1, G2, G2MP2, CBS-QB3 and DFT (MPW1PW91 /6-311+G(2d,2p)) methods were used to calculate the G°(g) values (Gas phase Gibbs free energy).83-89 The optimized structures were confirmed to be energy minima by vibrational frequency calculations with all real frequencies. In this study there are no imaginary frequency found. These high level composite procedures have been designed particularly for the prediction of reliable energies of molecules in the gas-phase and have been demonstrated to provide the accuracy within 1-2 kcal/mol when assessed against large test sets of thermo-chemical data.90,91
Results and Discussions
The models calculated with GRAPH based, SMILES based and a Hybrid (both GRAPH and SMILES) version of the descriptor. The versions of descriptors GRAPHDCW(Threshold,Nepoch) calculated here with Eq. (1) (HSG) are the following: α = 0, β = 1, γ = 1, and δ = 1. The SMILES-based descriptors SMILESDCW(Threshold,Nepoch) applied in our work with Eq. (2) are as follows: α = 1, β = 1, γ = 1, δ = 0, x = 0, y = 1 and z = 0 and finally the hybrid version of the descriptors HYBRIDDCW(Threshold, Nepoch) were calculated with Eq. (3).
Equations (4) – (6) represent the models calculated with GRAPH based, SMILES based and Hybrid based descriptors. The classic scheme (only training and test set used) has been applied here is the Monte Carlo optimization method.
The aforementioned models for the calculation of gas-phase Gibb’s free energy changes are the following:
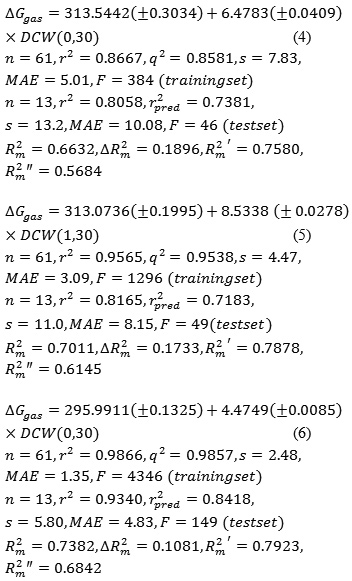
where, n is the number of compounds in a set; r2 is squared correlation coefficient; q2 and r2pred are leave-one-out correlation coefficients for training and test sets; s is the standard error of estimation; MAE is mean absolute error; F is Fischer F-ratio; novel validation metrics R2m [20]; R2m is mean of R2mʹ and R2mʹʹ values and ΔR2m is the absolute difference between R2mʹ and R2mʹʹ. R2m should be more than 0.5 and ΔR2m should be smaller than 0.2.
Table 3 contains the statistical quality of all models for gas phase Gibb’s free energy changes of data set calculated by equations (4) – (6) of QSPR methods. In this table the statistics obtained from the HYBRID method are n=61, r2 =0.9866, q2= 0.9857, s= 2.48, MAE= 1.35 and F= 4356 for the training set and r2= 0.9340, r2pred=0.8418, s = 5.80, MAE= 4.83 and F= 149 for the test set. The large value of F in hybrid model indicates that this linear model is robust and hybrid version of optimal descriptors is more compatible with the data than other models. On the basis of other statistical values hybrid method appeared to be a significant improvement among all the QSPR methods.
Table 2 shows the calculated gas-phase Gibb’s free energy changes in kcal/mol of all (74) molecules using the three aforementioned QSPR methods of Coral and five methods: DFT (MPW1PW91/6-311+G(2d,2p)), Gaussian-n (G1, G2, G2MP2) and composite (CBS-QB3) of Gaussian 09 respectively. The RMSE (Root Mean Squared Error) of gas-phase Gibb’s free energy changes calculated with GRAPH, SMILES and Hybrid methods are 8.3, 5.98 and 3.23 respectively. In the case of QSPR analysis the HYBRID model gives the lowest RMSE value ( 3.23) of all. In the meanwhile RMSE (Root Mean Squared Error) of gas-phase Gibb’s free energy changes calculated with DFT (MPW1PW91/6-311+G(2d,2p)), G1, G2, G2MP2 and CBS-QB3 methods are 3.49, 4.26, 3.17, 3.12 and 4.61 respectively. In these calculations, G2MP2 method gives a comparatively lower RMSE hence it shows a significant congruence with the experimental values.
Figure 1 shows the correlation of gas phase Gibbs free energy changes calculated by three QSPR methods with experimental values. Among the employed QSPR methods, HYBRID shows a better linearity than others. Therefore HYBRID based QSPR model is more reliable and pertinent methods than other QSPR models for calculation of gas phase Gibb’s free energy changes for small molecules. Figure 2 shows the correlation of Gibb’s free energy changes calculated by a DFT (MPW1PW91/6-311+G(2d,2p)) method, Gaussian n-methods (G1, G2), modified Gaussian method (G2MP2) and a composite method (CBS-QB3) with respect to the experimental values. Upon the analysis of calculations the CBS-QB3 and G1 methods give comparatively poor results, so some calculated values are littleapart from the trendline. In the meanwhile, MPW1PW91/6-311+G(2d,2p), G2 and G2MP2 give better results therefore they show a significant improvement of linearity other than two methods (CBS-QB3 and G1).
Table 2: Experimental and calculated gas-phase Gibb’s free energies (kcal/mol) of 74 small molecules in Coral and Gaussian software.
|
ID |
Exp |
Graph |
SMILES |
Hybrid |
MPW1PW91 / 6-311+G(2d,2p) |
G1 |
G2 |
G2MP2 |
CBS-QB3 |
|
1 |
343.20 |
345.21 |
322.43 |
335.86 |
343.46 |
342.71 |
342.73 |
343.51 |
341.66 |
|
2 |
347.00 |
339.86 |
341.12 |
341.94 |
349.81 |
351.38 |
351.96 |
352.21 |
347.12 |
|
3 |
344.40 |
344.39 |
339.69 |
344.38 |
346.50 |
346.29 |
345.63 |
346.00 |
344.78 |
|
4 |
349.00 |
360.42 |
349.05 |
349.07 |
350.71 |
345.79 |
349.09 |
349.86 |
349.18 |
|
5 |
345.00 |
333.63 |
356.27 |
339.35 |
338.43 |
336.66 |
336.81 |
337.30 |
335.56 |
|
6 |
348.90 |
345.21 |
357.45 |
348.87 |
350.13 |
349.04 |
349.02 |
349.54 |
347.71 |
|
7 |
350.60 |
357.72 |
356.27 |
355.64 |
351.84 |
351.77 |
351.63 |
352.13 |
349.84 |
|
8 |
327.50 |
327.51 |
323.89 |
327.48 |
320.61 |
318.48 |
320.18 |
321.09 |
319.26 |
|
9 |
389.10 |
378.02 |
390.07 |
389.10 |
391.15 |
388.86 |
389.04 |
388.96 |
389.81 |
|
10 |
341.00 |
345.21 |
333.78 |
333.95 |
339.74 |
340.53 |
340.72 |
341.07 |
339.28 |
|
11 |
347.10 |
345.57 |
350.32 |
347.13 |
348.69 |
346.82 |
347.07 |
347.60 |
345.84 |
|
12 |
320.90 |
324.62 |
320.73 |
320.79 |
320.15 |
315.92 |
316.58 |
317.50 |
315.31 |
|
13 |
335.50 |
345.12 |
338.35 |
345.39 |
336.98 |
334.76 |
335.86 |
336.40 |
309.14 |
|
14 |
344.10 |
351.68 |
346.65 |
344.83 |
341.82 |
340.49 |
341.47 |
341.51 |
341.60 |
|
15 |
352.80 |
344.67 |
353.71 |
352.71 |
358.87 |
355.12 |
356.57 |
356.71 |
356.59 |
|
16 |
387.90 |
386.29 |
391.25 |
388.03 |
389.00 |
387.71 |
388.56 |
388.62 |
387.20 |
|
17 |
395.90 |
395.91 |
396.19 |
395.88 |
400.62 |
397.02 |
396.94 |
396.67 |
397.63 |
|
18 |
334.70 |
344.67 |
335.62 |
339.02 |
332.48 |
327.15 |
328.94 |
329.26 |
329.08 |
|
19 |
391.70 |
372.27 |
387.84 |
391.30 |
393.48 |
390.58 |
391.17 |
391.21 |
390.91 |
|
20 |
355.70 |
355.75 |
354.70 |
355.69 |
358.24 |
354.05 |
355.31 |
355.46 |
355.42 |
|
21 |
383.70 |
383.72 |
381.31 |
383.69 |
387.90 |
382.59 |
383.18 |
383.65 |
385.80 |
|
22 |
368.50 |
362.14 |
369.95 |
372.79 |
370.82 |
367.76 |
368.96 |
369.32 |
369.10 |
|
23 |
369.20 |
364.83 |
375.43 |
372.59 |
371.84 |
369.74 |
370.86 |
371.12 |
370.65 |
|
24 |
349.10 |
360.16 |
350.33 |
349.13 |
350.58 |
348.61 |
349.49 |
349.81 |
349.79 |
|
25 |
376.20 |
378.54 |
373.09 |
381.24 |
375.82 |
374.23 |
375.45 |
375.59 |
371.60 |
|
26 |
369.50 |
360.68 |
369.49 |
369.51 |
370.45 |
368.42 |
368.62 |
369.59 |
368.39 |
|
27 |
372.60 |
365.25 |
374.26 |
370.32 |
372.82 |
370.56 |
371.67 |
371.95 |
371.65 |
|
28 |
366.60 |
364.83 |
362.01 |
360.36 |
366.34 |
365.13 |
366.20 |
366.43 |
366.42 |
|
29 |
367.60 |
362.40 |
361.27 |
374.07 |
366.75 |
364.09 |
364.63 |
365.42 |
364.85 |
|
30 |
370.00 |
396.40 |
369.64 |
372.76 |
371.13 |
368.52 |
369.50 |
369.43 |
370.35 |
|
31 |
342.50 |
342.52 |
356.17 |
342.61 |
343.99 |
341.50 |
342.88 |
343.18 |
343.11 |
|
32 |
360.00 |
381.17 |
359.92 |
357.10 |
367.56 |
379.18 |
364.67 |
361.84 |
365.62 |
|
33 |
372.60 |
392.86 |
370.81 |
369.02 |
374.96 |
375.99 |
376.25 |
375.87 |
377.08 |
|
34 |
403.00 |
403.04 |
402.96 |
402.97 |
399.64 |
417.85 |
398.10 |
398.18 |
398.84 |
|
35 |
352.00 |
353.67 |
357.70 |
357.07 |
351.44 |
351.28 |
351.95 |
352.45 |
351.44 |
|
36 |
377.80 |
389.35 |
378.02 |
377.70 |
380.53 |
376.91 |
377.95 |
377.82 |
378.36 |
|
37 |
401.00 |
396.40 |
394.71 |
396.25 |
402.62 |
400.33 |
400.96 |
400.83 |
401.19 |
|
38 |
364.10 |
365.71 |
363.86 |
364.21 |
368.04 |
365.38 |
365.67 |
365.49 |
366.43 |
|
39 |
372.50 |
371.84 |
372.62 |
372.70 |
374.70 |
376.04 |
376.44 |
376.54 |
376.68 |
|
40 |
372.80 |
392.86 |
371.00 |
377.81 |
376.87 |
375.11 |
375.38 |
375.16 |
376.19 |
|
41 |
357.80 |
365.25 |
358.05 |
354.75 |
360.83 |
361.18 |
362.17 |
362.19 |
359.06 |
|
42 |
391.30 |
397.77 |
393.79 |
395.25 |
393.47 |
391.62 |
392.27 |
392.24 |
392.63 |
|
43 |
404.00 |
397.77 |
397.06 |
399.81 |
403.01 |
398.74 |
399.16 |
399.02 |
398.43 |
|
44 |
391.30 |
391.33 |
386.17 |
391.35 |
388.06 |
387.14 |
388.08 |
388.07 |
387.74 |
|
45 |
376.20 |
397.77 |
372.17 |
375.11 |
379.29 |
377.71 |
378.08 |
377.93 |
378.23 |
|
46 |
383.80 |
392.86 |
395.89 |
392.51 |
382.41 |
383.22 |
383.31 |
383.01 |
383.11 |
|
47 |
379.00 |
381.17 |
385.00 |
380.59 |
385.30 |
382.07 |
383.02 |
383.37 |
383.74 |
|
48 |
358.70 |
364.83 |
362.50 |
361.58 |
358.92 |
359.39 |
360.58 |
360.70 |
359.04 |
|
49 |
361.90 |
362.14 |
357.02 |
361.78 |
364.27 |
362.91 |
363.60 |
363.66 |
363.21 |
|
50 |
398.20 |
390.01 |
415.20 |
398.89 |
407.03 |
403.81 |
404.35 |
404.49 |
405.62 |
|
51 |
367.40 |
367.43 |
358.52 |
367.50 |
367.80 |
369.03 |
369.75 |
369.79 |
369.36 |
|
52 |
407.20 |
392.86 |
409.31 |
404.73 |
410.11 |
409.07 |
408.92 |
408.79 |
408.58 |
|
53 |
411.70 |
396.40 |
408.14 |
408.48 |
414.25 |
413.18 |
413.02 |
412.92 |
412.98 |
|
54 |
401.00 |
389.35 |
400.83 |
400.95 |
407.92 |
405.33 |
405.65 |
405.43 |
405.62 |
|
55 |
366.40 |
366.42 |
366.62 |
366.38 |
371.04 |
368.66 |
368.47 |
368.62 |
371.37 |
|
56 |
344.00 |
345.57 |
343.80 |
343.92 |
342.95 |
342.80 |
343.01 |
343.39 |
341.50 |
|
57 |
350.70 |
350.70 |
350.57 |
350.60 |
351.26 |
349.61 |
350.26 |
350.63 |
350.73 |
|
58 |
383.00 |
381.28 |
372.86 |
377.95 |
388.91 |
387.45 |
386.95 |
386.73 |
386.87 |
|
59 |
359.00 |
365.25 |
361.33 |
359.31 |
360.36 |
359.52 |
360.46 |
360.47 |
360.24 |
|
60 |
365.20 |
372.27 |
357.34 |
364.52 |
365.90 |
366.88 |
367.54 |
367.53 |
367.51 |
|
61 |
396.50 |
414.62 |
379.20 |
396.74 |
393.62 |
391.84 |
392.20 |
391.81 |
393.28 |
|
62 |
394.00 |
394.04 |
394.07 |
394.05 |
393.50 |
389.41 |
390.58 |
390.37 |
389.75 |
|
63 |
408.70 |
408.71 |
406.96 |
408.69 |
412.06 |
411.15 |
410.94 |
410.82 |
411.67 |
|
64 |
400.60 |
400.62 |
397.25 |
400.64 |
404.30 |
402.36 |
402.70 |
403.22 |
403.69 |
|
65 |
381.20 |
369.48 |
382.75 |
381.83 |
392.44 |
390.06 |
390.98 |
391.73 |
391.93 |
|
66 |
370.30 |
370.59 |
374.94 |
370.29 |
372.97 |
370.79 |
371.96 |
372.71 |
372.65 |
|
67 |
368.00 |
367.98 |
363.60 |
368.02 |
370.25 |
369.34 |
369.85 |
369.61 |
369.03 |
|
68 |
349.90 |
349.92 |
353.89 |
349.89 |
351.73 |
351.01 |
352.17 |
351.74 |
350.73 |
|
69 |
389.70 |
378.28 |
389.88 |
389.77 |
386.36 |
384.61 |
385.37 |
385.75 |
383.77 |
|
70 |
361.30 |
365.10 |
348.14 |
354.14 |
362.64 |
361.25 |
362.42 |
362.94 |
362.02 |
|
71 |
342.00 |
342.01 |
341.78 |
342.04 |
343.08 |
342.34 |
344.05 |
344.62 |
341.85 |
|
72 |
381.30 |
381.26 |
381.23 |
381.28 |
386.23 |
384.85 |
385.18 |
384.90 |
386.50 |
|
73 |
356.00 |
355.98 |
356.05 |
356.01 |
351.46 |
349.83 |
350.07 |
350.53 |
351.18 |
|
74 |
356.40 |
356.40 |
356.28 |
356.41 |
361.28 |
361.79 |
361.07 |
361.72 |
360.11 |
|
RMSE |
8.83 |
5.98 |
3.23 |
3.49 |
4.26 |
3.17 |
3.12 |
4.61 |
|
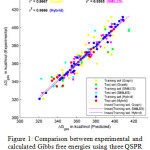 |
Figure 1: Comparison between experimental and calculated Gibbs free energies using three QSPR models. |
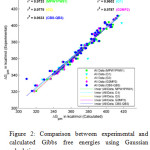 |
Figure 2: Comparison between experimental and calculated Gibbs free energies using Gaussian calculations. |
Upon the statistical analysis of all models, the HYBRID method of CORAL and G2MP2 method of Gaussian 09 gives a better improvement results for gas phase Gibbs free energy changes shown in Table-2. Inspection of these calculated values reveals that in most cases the values are very close to the experimental values. For an instance, in case of compound 9, 21, 31, 51, 57 and 67 the calculated gas-phase Gibb’s free energy changes of 389.10, 383.69, 342.61, 367.50, 350.60 and 368.02 kcal/mol by HYBRID method and 388.96, 383.65, 343.18, 369.79, 350.63 and 369.61 kcal/mol by G2MP2 method are very close to the experimental values of 389.10, 383.70, 342.50, 367.40, 350.70 and 368.90 kcal/mol respectively. Now the unsigned errors (%) of these molecules by HYBRID and G2MP2 methods are 0.0, 0.0026, 0321, 0.0272, 0.0285, 0.2385 and 0.0360, 0.0130, 0.1985, 0.6505, 0.0200, 0.1925 respectively which show a very small deviation compared to experimental values. In addition, the unsigned errors of the remaining molecules are almost same or slightly higher from these unsigned errors.
Acknowledgements
The authors wish to thank Chairman, Department of Chemistry, Mawlana Bhashani Science and Technology University, Santosh, Tangail-1902, Bangladesh to use the departmental computational chemistry laboratory and for his kind support during the work.
Conclusion
In this paper we have shown gas phase Gibbs free energies of seventy four types of small molecules and these experimentally studied molecules were selected to test new theoretical methodology. There are a variety of methods and tools to calculate the gas phase Gibb’s free energies in modern technology. CORAL software is thus one of the modern and an efficient tool to build up a model for Gibb’s free energy calculation of a set of diverse substances. The predicted free energy of the applied approach was validated with a test set. The best results were obtained using the HYBRID version of the representation of the molecular structure, i.e., by both molecular graph and SMILES. At the same time Gaussian software program was also employed to calculate the gas phase Gibbs free energies with a variety of methods and basis sets. MPW1PW91/6-311+G(2d,2p) and G2MP2 gave the results with an excellent agreement with experimental values. It is clear that high-levels of theory and cost effective methods are not always feasible for the calculations of gas phase Gibbs free energies of these small molecules. Sometimes low-levels of theory can reach the point where calculations at the level of chemical accuracy, within 1 kcal/mol, are now possible. The main variation in the accuracy of these molecules stems from the levels of theory used in the optimization. In future, further studies can develop a new methodology to calculate the high accuracy of gas phase Gibbs free energies.
Conflict of Interest
We as authors confirm that there are no known conflicts of interest associated with this publication and there has been no significant financial support for this work that could have influenced its outcome.
References
- Chipot, C.; Mark, A. E.; Pande, V. S.; Simonson, T. Springer Ser. Chem. Phys. 2007, 86, 463–492.
- Kollman, P. Chem. Rev. 1993, 93, 2395–2417.
- Ateshian, G. A.; Morrison, B.; Hung, C. T.; Hung, C. T. Ann. Biomed. Eng. 2010, 38 (5), 1801–1814.
- Scholtz, J. M.; Pace, C. N.; Huyghues-Despointes, B. M. P. Nat. Struct. Biol. 1999, 6 (10), 910–912.
- Vaes, W. H. J.; Ramos, E. U.; Verhaar, H. J. M.; Christopher J. Cramer; Hermens, J. L. M. Chem. Res. Toxicol. 1998, 11 (8), 847–854.
- Lozano, H. R.; Martínez, F. Brazilian J. Pharm. Sci. 2006, 42 (4), 601–613.
- Van Den Bosch, M.; Swart, M.; Snijders, J. G.; Berendsen, H. J. C.; Mark, A. E.; Oostenbrink, C.; Van Gunsteren, W. F.; Canters, G. W. ChemBioChem 2005, 6, 738–746.
- Srinivasan, J.; Cheatham, T. E.; Cieplak, P.; Kollman, P. A.; Case, D. A. J. Am. Chem. Soc. 1998, 120, 9401–9409.
- Chipot, C. In New Algorithms for Macromolecular Simulation; Springer-Verlag: Berlin/Heidelberg, 2006; pp 185–211.
- Christ, C. D.; Mark, A. E.; van Gunsteren, W. F. J. Comput. Chem. 2009, 31 (8), NA-NA.
- Bonomi, M.; Branduardi, D.; Bussi, G.; Camilloni, C.; Provasi, D.; Raiteri, P.; Donadio, D.; Marinelli, F.; Pietrucci, F.; Broglia, R. A.; et al. Comput. Phys. Commun. 2009, 180 (10), 1961–1972.
- Gohlke, H.; Kiel, C.; Case, D. A. J. Mol. Biol. 2003, 330 (4), 891–913.
- Koca, J.; Jirouskova, Z.; Svobodova Varekova, R.; Vanek, J. J. Comput. Chem. 2009, 30 (7), 1174–1178.
- Aledo, J. C. Biochem. Mol. Biol. Educ. 2001, 29 (4), 142–143.
- Postma, J. P. M.; Berendsen, H. J. C.; Haak, J. R. Faraday Symp. Chem. Soc. 1982, 17, 55–67.
- Warshel, A. J. Phys. Chem. 1982, No. 86, 2218–2224.
- Bash, P. A.; Singh, U. C.; Langridge, R.; Kollman, P. A. Science (80-. ). 1987, 236, 564–568.
- Bash, P. A.; Chandra Singh, U.; Brown, F. K.; Langridge, R.; Kollman, P. A. Science (80-. ). 1987, 235 (4788), 574–576.
- WESTACOTT, R. E.; RODGER, P. M. Ann. N. Y. Acad. Sci. 1994, 715 (1), 539–543.
- CORAL/Free software for QSAR and nanoQSAR, http://www.insilico.eu/CORAL/ (accessed Apr 14, 2019).
- Toropova, A. P.; Toropov, A. A.; Martyanov, S. E.; Benfenati, E.; Gini, G.; Leszczynska, D.; Leszczynski, J. Chemom. Intell. Lab. Syst. Short Commun. 2012, 110 (1), 177–181.
- Robinson, M. S.; Davico, G. E.; Bierbaum, V. M.; DePuy, C. H. Int. J. Mass Spectrom. Ion Process. 1994, 137 (C), 107–119.
- O’Hair, R. A. J.; DePuy, C. H.; Bierbaum, V. M. J. Phys. Chem. 1993, 97, 7955–7961.
- Rempala, K.; Ervin, K. M. J. Chem. Phys. 2000, 112 (10), 4579–4590.
- Gilles, M. K.; Polak, M. L.; Lineberger, W. C. J. Chem. Phys. 1992, 96 (11), 8012–8020.
- Downard, K. M.; Bowie, J. H.; O’Hair, R. A. J.; Krempp, M.; DePuy, C. H. Int. J. Mass Spectrom. Ion Process. 1992, 120 (3), 217–229.
- Bartmess, J. E.; Scott, J. A.; Mclver, Robert T., J. J. Am. Chem. Soc. 1979, 101 (20), 6046–6056.
- Burk, P.; Koppel, I. A.; Rummel, A.; Trummal, A. J. Phys. Chem. A 2000, 104 (7), 1602–1607.
- Ingemann, S.; Nibbering, N. M. M. Compd. J. Chem. Soc. Perkin Trans. II 2014, 837.
- Guillemin, J. C.; Riague, E. H.; Gal, J. F.; Maria, P. C.; Mó, O.; Yáñez, M. Chem. Eur. J. 2005, 11 (7), 2145–2153.
- Bierbaum, V. M.; Grabowski, J. J.; DePuy, C. H. J. Phys. Chem. 1984, 88 (7), 1389–1393.
- Yang, X.; Kiran, B.; Wang, X.; Wang, L.; Mucha, M.; Jungwirth, P. J. Phys. Chem. A 2004, 108, 7820–7826.
- Koppel, I. A. .; Taft, R. W. .; Anvia, F. .; Zhu, S. Z. .; Hu, L. Q. .; Sung, K. S. .; Desmarteau, D. D. .; Yagupolskii, L. M. .; Yagupolskii, Y. L. .; Ignat’ev, N. V. .; et al. J. Am. Chem. Soc. 1994, 116 (7), 3047–3057.
- Taft, R. W. Progress in Physical Organic Physical Organic; John Wiley & Sons: New York, 1987; Vol. 16.
- Radisic, D.; Xu, S.; Bowen, K. H. J. Chem. Phys. Lett. 2002, 354 (March), 9–13.
- Wickham-Jones, C. T.; Ervin, K. M.; Ellison, G. B.; Lineberger, W. C. J. Chem. Phys. 1989, 91 (4), 2762–2763.
- Bradforth, S. E.; Kim, E. H.; Arnold, D. W.; Neumark, D. M. J. Chem. Phys. 1993, 98 (2), 800–810.
- Mackay, G. I.; Hems Worth, R. S.; Bohme, D. K. Can. J. Chem. 1976, 54, 1624.
- Ma, S.; Wang, F.; Cooks, R. G. J. Mass Spectrom. 1998, 33 (10), 943–949.
- Smith, J. R.; Kim, J. B.; Lineberger, W. C. Phys. Rev. A 1997, 55 (3), 2036–2043.
- Ramond, T. M.; Davico, G. E.; Schwartz, R. L.; Lineberger, W. C. J. Chem. Phys. 2000, 112 (3), 1158–1169.
- Ellison, G. B.; Engelking, P. C.; Lineberger, W. C. J. Phys. Chem. 1982, 86 (25), 4873–4878.
- Distelrath, V.; Boesl, U. Faraday Discuss. 2000, 115 (1), 161–174.
- Nee, M. J.; Osterwalder, A.; Zhou, J.; Neumark, D. M. J. Chem. Phys. 2006, 125, 014306(1-9).
- Ramond, T. M.; Blanksby, S. J.; Kato, S.; Bierbaum, V. M.; Davico, G. E.; Schwartz, R. L.; Lineberger, W. C.; Ellison, G. B. J. Phys. Chem. A 2002, 106 (42), 9641–9647.
- Graul, S. T.; Schnute, M. E.; Squires, R. R. Int. J. Mass Spectrom. Ion Process. 1990, 96, 181–198.
- Blanksby, S. J.; Ramond, T. M.; Davico, G. E.; Nimlos, M. R.; Kato, S.; Bierbaum, V. M.; Lineberger, W. C.; Ellison, G. B.; Okumura, M. J. Am. Chem. Soc. 2001, 123 (39), 9585–9596.
- Botter, R.; Dibeler, V. H.; Walker, J. A.; Rosenstock, H. M. J. Chem. Phys. 1966, 44 (3), 1271–1278.
- Akin, F. A.; Ervin, K. M. J. Phys. Chem. A 2006, 110 (4), 1342–1349.
- Thynne, J. C. .; MacNeil, K. A. G. J. Phys. Chem. 1971, 75 (17), 2584–2591.
- Gal, J. F.; Decouzon, M.; Maria, P. C.; González, A. I.; Mó, O.; Yáñez, M.; El Chaouch, S.; Guillemin, J. C. J. Am. Chem. Soc. 2001, 123 (26), 6353–6359.
- Graul, S. T.; Squires, R. R. J. Am. Chem. Soc. 1990, 112 (7), 2517–2529.
- Dorofeeva, O. V. J. Phys. Chem. Ref. Data 1986, 15, 437–464.
- Ervin, K.; Gronert, S.; Barlow, S.; Gilles, M.; Harrison, A.; Bierbaum, V. M.; Depuy, C. H.; Lineberger, W. C. J. Am. Chem. Soc. 1990, 112 (1), 5750–5759.
- Clifford, E. P.; Wenthold, P. G.; Lineberger, W. C.; Petersson, G. A.; Broadus, K. M.; Kass, S. R.; Kato, S.; DePuy, C. H.; Bierbaum, V. M.; Ellison, G. B. J. Phys. Chem. A 1998, 102 (36), 7100–7112.
- Bartmess, J. E.; Burnham, R. D. J. Org. Chem. 1984, 49 (8), 1382–1387.
- Robinson, M. S.; Bierbaum, V. M.; DePuy, C. H.; Polak, M. L.; Lineberger, W. C. J. Am. Chem. Soc. 1995, 117 (25), 6766–6778.
- Oakes, J. M.; Jones, M. E.; Bierbaum, V. M.; Ellison, G. B. J. Phys. Chem. 1983, 87, 4810–4815.
- de Visser, S. P.; de Koning, L. J.; van der Hart, W. J.; Nibbering, N. M. M. Recl. des Trav. Chim. des Pays‐Bas 1995, 114 (6), 267–272.
- DePuy, C. H.; Gronert, S.; Barlow, S. E.; Bierbaum, V. M.; Damrauer, R. J. Am. Chem. Soc. 1989, 111, 1968–1973.
- Dahlke, G. D.; Kass, S. R. J. Am. Chem. Soc. 1991, 113 (15), 5566–5573.
- Parr, A. C. .; Elder, F. A. J. Chem. Phys. 1968, 49, 2659.
- Ellison, G. B.; Davico, G. E.; Bierbaum, V. M.; DePuy, C. H. Int. J. Mass Spectrom. Ion Process. 1996, 156 (1–2), 109–131.
- Rabasco, J. J.; Kass, S. R. J. Am. Soc. Mass Spectrom.Soc. Mass Spectrom. 1992, 3, 91–98.
- DePuy, C. H.; Bierbaum, V. M.; Damrauer, R. J. Am. Chem. Soc. 1984, 106 (8), 4051–4053.
- Plemenkov, V. V. .; Villem, Y. Y. .; Villem, N. V. .; Bolesov, I. G. .; Surmina, L.S.; Yakushkina, N. I. .; Formanovskii, A. A. Zh. Obs. Khim., 1981, 51, 2076.
- Zhang, L.; Grabowski, J. J. J. CHEM. SOC., CHEM. COMMUN., 1989, No. 1, 1819–1821.
- Moran, S.; Barney Ellison, G. J. Phys. Chem. 1988, 92 (7), 1794–1803.
- Tian, Z.; Fattahi, A.; Lis, L.; Kass, S. R. J. Am. Chem. Soc. 2006, 128 (51), 17087–17092.
- Kroeker, R. L.; Kass, S. R. J. Am. Chem. Soc. 1990, No. 112, 9024–9025.
- Ellison, G. B.; Engelking, P. C.; Lineberger, W. C. J. Am. Chem. Soc. 1978, 100 (8), 2556–2558.
- Deyerl, H.-J.; Alconcel, L. S.; Continetti, R. E. J. Phys. Chem. A 2001, 105, 552–557.
- Born, M.; Ingemann, S.; Nibbering, N. M. M. Int. J. Mass Spectrom. 2000, 194 (2–3), 103–113.
- Paulino, J. A.; Squires, R. R. J. Am. Chem. Soc. 1991, 113 (15), 5573–5580.
- Hierl, P. M.; Henchman, M. J.; Paulson, J. F. Int. J. Mass Spectrom. Ion Process. 1992, 117 (C), 475–485.
- Rackwitz, R.; Feldmann, D.; Kaiser, H. .; Heinicke, E. Z. Naturforsch. A 1977, 32, 594–599.
- Bengali, A. A.; Leopold, D. G. J. Am. Chem. Soc. 1992, 114, 9192–9194.
- Ervin, K. M.; Lineberger, W. C. J. Chem. Phys. 2005, 122 (19), 1–11.
- Frisch, M. J.; Trucks, G. W.; Schlegel, H. B.; Scuseria, G. E.; Robb, M. A.; Cheeseman, J. R.; Scalmani, G.; Barone, V.; Mennucci, B.; Petersson, G. A.; et al. Gaussian Inc., Wallingford CT. 2009.
- Roothaan, C. C. J. Rev. Mod. Phys. 1951, 23 (2), 69–89.
- Pople, J. A.; Nesbet, R. K. J. Chem. Phys. 1954, 22, 571–572.
- McWeeny, R.; Diercksen, G. J. Chem. Phys. 1968, 49, 4852.
- Pople, J. A.; Head‐Gordon, M.; Fox, D. J.; Raghavachari, K.; Curtiss, L. A. J. Chem. Phys. 1989, 90 (10), 5622–5629.
- Curtiss, L. A.; Jones, C.; Trucks, G. W.; Raghavachari, K.; Pople, J. A. J. Chem. Phys. 1990, 93 (4), 2537–2545.
- Curtiss, L. A.; Raghavachari, K.; Trucks, G. W.; Pople, J. A. J. Chem. Phys. 1991, 94 (11), 7221–7230.
- Curtiss, L. A.; Raghavachari, K.; Pople, J. A. J. Chem. Phys. 1993, 98 (2), 1293–1298.
- Montgomery, J. A.; Frisch, M. J.; Ochterski, J. W.; Petersson, G. A. J. Chem. Phys. 1999, 110 (6), 2822–2827.
- Montgomery, J. A.; Frisch, M. J.; Ochterski, J. W.; Petersson, G. A. J. Chem. Phys. 2000, 112 (15), 6532–6542.
- Adamo, C.; Barone, V. J. Chem. Phys. 1998, 108 (2), 664–675.
- Montgomery, J. A.; Frisch, M. J.; Ochterski, J. W.; Petersson, G. A. J. Chem. Phys. 1999, 110 (6), 2822–2827.
- Curtiss, L. A.; Raghavach Ari, K.; Redfern, P. C.; Rassolov, V.; Pople, J. A. J. Chem. Phys. 1998, 109 (18), 7764–7776.
Accepted on: 04-06-2019


![]()


