Cadmium Sulfide Loaded Activated Carbon: An Efficient, Solar Light Driven Photocatalyst for Rhodamine B Dye Degradation
Sagar Kande1, Udhav Ghoshir1, Jayshree Khedkar2 and Anil Gambhire*3
1Research Centre, Department of Chemistry, New Arts, Commerce and Science College, Ahmednagar, Maharashtra, 414001, India.
2Department of Chemistry, New Arts, Commerce and Science College, Shevgaon, Dist. Ahmednagar, Maharashtra, 414502, India.
3Department of Chemistry, Shri Anand College, Pathardi, Dist. Ahmednagar, Maharashtra, 414102, India.
Corresponding Author E–mail: abg_chem@ymail.com
DOI : http://dx.doi.org/10.13005/ojc/350316
Article Received on : 24-03-2019
Article Accepted on : 07-05-2019
Article Published : 16 May 2019
A series of novel photocatalyst with CdS loaded on activated carbon (xAC/CdS) were successfully synthesized by a simple hydrothermal method. The activated carbon content was varied between 0-7 wt. %. The prepared photocatalysts were characterized by X-ray diffraction, scanning electron microscopy with EDX, transmission electron microscopy, X-ray photoelectron spectroscopy, UV-Vis diffuse reflectance spectroscopy, N2 adsorption-desorption analysis and photoluminescence spectroscopy. The photocatalytic activity of as-synthesized photocatalysts was studied for RhB dye degradation under natural sunlight irradiation. XRD analysis assigned both cubic and hexagonal morphology for xAC/CdS photocatalysts. The UV-vis DRS studies showed that loading of CdS on activated carbon enhances its visible light absorption with decrease in band gap energy. The lowest photoinduced e/h pair recombination rate in 3wt% AC/CdS results in optimum photocatalytic activity as revealed by photoluminescence study. The enhancement in dye degradation ability (̴ 11 times) of prepared photocatalysts can be attributed to synergistic effect of CdS and activated carbon.
KEYWORDS:Activated Carbon; CdS; RhB Dye; Solar Light
Download this article as:| Copy the following to cite this article: Kande S, Ghoshir U, Khedkar J, Gambhire A. Cadmium Sulfide Loaded Activated Carbon: An Efficient, Solar Light Driven Photocatalyst for Rhodamine B Dye Degradation. Orient J Chem 2019;35(3). |
| Copy the following to cite this URL: Kande S, Ghoshir U, Khedkar J, Gambhire A. Cadmium Sulfide Loaded Activated Carbon: An Efficient, Solar Light Driven Photocatalyst for Rhodamine B Dye Degradation. Orient J Chem 2019;35(3). Available from: https://bit.ly/2LMkY6R |
Introduction
During last few decades waste water released from textile industries containing dyes as contaminants has been emerged as a challenging environmental issue. The natural degradation of these contaminants, however, is a difficult task. Several research groups have been highly engaged in efforts to deal with this issue.1 Accordingly, semiconductor photocatalysts have attracted significant attention of researchers for natural degradation of the contaminants present in water.2-3 Among such semiconductor photocatalysts, TiO2, ZnO and SnO2 are commonly used due to their low toxicity, high photocatalytic activity and stability. In spite of these properties a large band gap of these metal oxides have so far been limited their activity only in ultra-violet (UV) region.4-8 It is well known that CdS is a highly activated photocatalyst with band gap energy of 2.4 eV that matches closely with the spectral range in the visible region. However, the photocorrosion effect in aqueous medium and high e-h pair recombination rate in CdS restricts its photocatalytic activity. To overcome these problems with CdS, different strategies such as doping with metals,9 coupling with metal oxides10 and loading on carbon based materials have been developed. The loading of CdS on carbon based materials like carbon nanotubes (CNTs),11 reduced graphene oxides,12 fullerene (C60),13 carbon spheres14 have shown an enhancement in its photocatalytic activity. Nevertheless, commercialization of loaded CdS is not possible due to the high market cost of these supporting materials. Amongst carbon based materials, activated carbon (AC) has been potentially applied in many fields owing to its high surface area, good chemical stability, superior light response ability and excellent electronic properties. Due to the high surface area and low cost it has widely been used as a support for semiconductor photocatalyst.15-16 The loading on AC brings significant enhancement in the surface area as well as dye degradation efficiency of photocatalyst.17
Huang et. al. studied photodegradation of Rhodamine B over biomass derived activated carbon supported CdS nanomaterials. The synthesized CdS@SAC-800 exhibit higher photocatalytic activity, however, the reusability of this photocatalyst is observed to be less.18 Guo et. al. successfully prepared CdS loaded coal based activated carbon nanofibers with high surface area due to microporous carbonaceous support.19 Similarly Hu et. al. studied the coating of colloidal carbon sphere with CdS nanoparticles by microwave assisted synthesis.20 However, in both cases the commercialization of these photocatalysts is difficult due to the costly supporting materials. In the present work we successfully loaded CdS crystals on the activated carbon by using simple hydrothermal method and have the advantages of less particle size, uniform distribution and high purity.21-23 In general, photocatalysts exhibit agglomeration in aqueous medium which reduces their surface area, whereas loading on activated carbon gives uniform distribution without agglomeration. In addition to this, high adsorption capacity of AC increases the contact between organic contaminants and photocatalyst that renders enhanced photocatalytic activity. Furthermore, the used photocatalyst can be easily recovered by simple filtration process.
Herein, we develop a simple, efficient and low cost method for the synthesis of CdS loaded on activated carbon (xAC/CdS, x = 0, 1, 3, 5 and 7wt% AC) by hydrothermal method. The present work probes synergism between CdS and AC and thereby concomitant enhancement in photocatalytic dye degradation efficiency.
Experimental
Materials
Activated carbon was purchased from Sigma Aldrich, Germany, Cadmium acetate (Cd(OAc)2).2H2O, thiourea (H2NCSNH2), ethylenediamine (H2NCH2CH2NH2) were obtained from Merck. All the chemicals were analytical grade and used without further purification. DI water is used throughout the experiment.
Preparation of xAC/CdS Photocatalysts
Hydrothermal method was used to synthesize xAC/CdS photocatalysts. 0.2 M cadmium acetate (2.76 gm in 40 ml DI water) and 0.2 M thiourea (1.67 gm in 40 ml DI water) were mixed with constant stirring for 30 minutes. Further, the above mixture was added with 2.6 ml ethylenediammine. Different weight percentage of activated carbon (0, 1, 3, 5 and 7 wt%) were added in above mixture to get different nanocomposites as pure CdS, 1AC/CdS, 3AC/CdS, 5AC/CdS and 7AC/CdS, respectively. The obtained mixture was vigorously stirred for 2 h and then transferred in Teflon coated stainless steel autoclave and kept at 180°C for 12 h. After completion of reaction, autoclave was cooled to room temperature. The obtained olive colored powder was dried in vacuum at 70°C followed by fine crushing and labeling. The codes of prepared photocatalysts are displayed in Table 1.
Table 1: Sample content and sample codes of prepared samples.
|
Sr. No |
Sample name |
Sample code |
|
1 |
Pure CdS |
CdS |
|
2 |
1wt % AC/ CdS |
1AC/ CdS |
|
3 |
3wt % AC/ CdS |
3AC/ CdS |
|
4 |
5wt % AC/ CdS |
5AC/ CdS |
|
5 |
7wt % AC/ CdS |
7AC/ CdS |
Sample Characterization
Powder X-ray diffraction pattern of synthesized photocatalysts was obtained from Brucker D8 Advance diffractometer using Cu Kα radiation source at 40kV, 30mA over 2θ range of 10-80º. Raman spectra were obtained from Renishaw InVia raman spectrometer. The morphology of the prepared photocatalyst was studied by scanning electron microscopy (SEM) on Nova NanoSEM 450 with EDX on Bruker XFlash 6I30. The high resolution transmission electron microscope (HRTEM) and selected area electron diffraction (SAED) images are obtained from FEI Tecnai F30 TEM. The binding energy and chemical state were analyzed by ESCA-3000, VG Microtech, Uckfield, UK. Photoluminescence (PL) spectra were recorded on SCINCO FluoroMate FS-2. Diffuse reflectance spectra were obtained using PE LAMBDA35 spectrophotometer. The Brunauer-Emmett-Teller (BET) specific surface area measurement was carried out by N2 adsorption/desorption at 77K using Micrometrics ASAP 2020 systems.
Measurement of Photocatalytic Activity
The photocatalytic activity of the prepared photocatalyst was evaluated by the degradation of Rhodamine B (RhB) under natural sunlight irradiation. The dye degradation experiment was carried out in the month of May 2018 between 1-2 p.m. To overcome the variation of intensity of sunlight the experiments were run in sets simultaneously. The intensity of solar light was recorded using lux meter (lx-101a) and it was found in average 91000 Lux. The intensity was measured at the interval of every 15 min and remains constant throughout the experiment. 20 mg of prepared photocatalyst (pure CdS or xAC/CdS) was dispersed into 100 ml (2 mg L-1) RhB solution in quartz vessel. In order to establish equilibrium between adsorption and desorption the mixture was stirred for 2 h in dark. Further, this mixture was exposed to natural sunlight. During irradiation small quantity of mixture was withdrawn periodically after every 5 min. The concentration of mixture was analyzed using UV-vis spectrophotometer (UV-1900) after centrifugation at wavelength 552 nm. The dye degradation efficiency (%) was estimated using the following equation:
Where, C0 and Ct are the concentration of RhB after time 0 and t, respectively during irradiation. BET surface area of prepared samples is displayed in Table 2.
Table 2: BET surface area of prepared samples.
|
Sr. No. |
Sample |
Surface area (SBET) (m2g-1)a |
|
1 |
AC |
1003 |
|
2 |
Pure CdS |
27.5 |
|
3 |
1AC/CdS |
69.4 |
|
4 |
3AC/CdS |
115.3 |
|
5 |
5AC/CdS |
156.7 |
|
6 |
7AC/CdS |
192.4 |
a BET technique was used to study surface area of xAC/CdS photocatalysts.
Results and discussion
XRD Analysis
The crystallinity and phase structure of the prepared samples were studied by X-ray diffraction (XRD) technique. Figure 1 depicts the XRD pattern of pure AC, pure CdS and xAC/CdS photocatalysts. A shallow broad diffraction peak (0 0 2) of carbon is obtained at 25.9ºC.24 Three diffraction peaks for 1AC/CdS, 3AC/CdS, 5AC/CdS, and 7AC/CdS at 26.7ºC (1 1 1), 43.8º (2 2 0) and 52.2º (3 1 1) indicates cubic phase of CdS (JCPDS card No. (80-0019). Also the hexagonal phase of CdS is evident from the peaks located at 24.8º (1 0 0), 28.2º (1 0 1) and 47.9º (1 0 3) (JCPDS card No. 41-1049).25 The observed similar XRD pattern in CdS and xAC/CdS reveals that loading of CdS on AC does not alter its crystalline phase. The disappearance of weak diffraction peak of carbon in xAC/CdS points the low concentration of activated carbon in prepared photocatalyst [26]. The crystal sizes of prepared samples were measured by using Scherrer formula,

Where, D- average crystalline size (Aº), K- Scherrer’s constant, λ- wavelength (nm), β- FWHM and θ- Bragg’s angle. The average crystal size of CdS loaded on AC is observed to be about 2.3 nm.
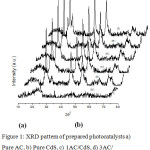 |
Figure 1: XRD pattern of prepared photocatalysts a) Pure AC, b) Pure CdS, c) 1AC/CdS, d) 3AC/CdS, d) 5AC/CdS, e) 7AC/CdS. |
TEM Analysis
The surface morphology of AC, pure CdS and 3AC/CdS was studied by TEM and the corresponding images are displayed in Fig. 2. Figure 2b depicts the agglomerated spherical crystals of pure CdS within the size range of 3.9 to 4.3 nm. This obtained size is higher than the crystal size determined using XRD. Such increased crystal size may be due to the aggregation of small primary crystals (2.3 nm) with large surface energy.27 The TEM and HRTEM image of 3AC/CdS (Fig. 2(c-d)) shows the successful anchoring of CdS nanocrystals on the surface of activated carbon without agglomeration. Even after sonication the CdS nanocrystals were attached to the surface of activated carbon which indicates the strong interaction between CdS and activated carbon.28
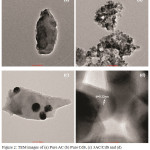 |
Figure 2: TEM images of (a) Pure AC (b) Pure CdS, (c) 3AC/CdS and (d) HRTEM image of 3AC/CdS. |
XPS Analysis
XPS study details the chemical composition and electronic structure of the prepared 3AC/CdS photocatalyst(Fig. 3(a-d)). XPS survey spectrum of 3AC/CdS shown in Fig. 3a indicates the presence ofCd, S and C. The asymmetric peak of C1s shown in Fig. 3b can be deconvoluted into two peaks.The strong peak at 284.5eV can be assigned to adventitious carbon from AC. In addition to this the appearance of the weak peak at 288.6 eV is observed, indicates the formation of O=C ̶ Obond .29 The binding energies of Cd3d5/2 and Cd3d3/2 of 3AC/CdS at 405.7eV and 412.4eV,respectivelycould be assigned to Cd2+ of CdS (Fig. 3c).30 The observed S2p peaks at 162.1eV and 163.3eV clearly showthe presence of sulphide (S2-) in CdS (Fig. 3d).31
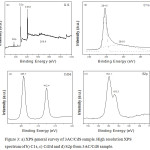 |
Figure 3: a) XPS general survey of 3AC/CdS sample. High resolution XPS spectrum of b) C1s, c) Cd3d and d) S2p from 3AC/CdS sample. |
Photoluminescence Spectra Analysis
The xAC/CdS photocatalysts under natural sunlight irradiation undergo photoexcitation with generation of e/h pairs. The recombination of e/h pairs in excited state accompanied with the liberation of energy is known as fluorescence. The interaction of CdS with activated carbon and their synergistic effect can be well correlated using fluorescence quenching. It is well known that the high PL intensity is the result of increased e/h pair recombination.32 In the present study, all the prepared samples upon excitation at 381 nm show a fluorescence emission peak at 465 nm. As shown in Fig. 4, the fluorescence peak intensity of xAC/CdS samples is much lower than pure CdS. This indicates that the loading of CdS on AC results in quenching of fluorescence intensity. The formation of interface between the surface of activated carbon and CdS separates the photogenerated e/h pairs and quenches their fluorescence.33 Thus, the lowest PL intensity in 3AC/CdS could be attributed to the highest e/h pair separation rate.
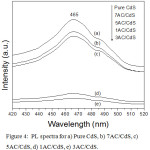 |
Figure 4: PL spectra for a) Pure CdS, b) 7AC/CdS, c) 5AC/CdS, d) 1AC/CdS, e) 3AC/CdS. |
UV-Vis DR Spectral Analysis
Optical properties of pure CdS and xAC/CdS samples were studied by UV-vis diffuse reflectance spectroscopy. A comparative graph in Fig. 5 shows the absorption of pure CdS at about 520 nm which is in accordance with its reported band gap of 2.4 eV.13 An enhanced absorption in visible light region was noticed for 1AC/CdS, 3AC/CdS and 5AC/CdS. The Cd ̶ C bond formation between CdS molecules and activated carbon shifts the absorption (~23 nm) at higher wavelength.34
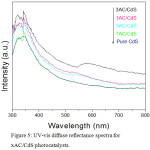 |
Figure 5: UV-vis diffuse reflectance spectra for xAC/CdS photocatalysts. |
Photocatalytic Activity
Figure 6 displays the RhB dye degradation activity under natural solar light irradiation for series of xAC/CdS samples. The photocatalytic activity of prepared samples was recorded under dark and light control i.e. in dark and without adding photocatalyst, respectively. In both the experiments no RhB dye degradation was observed. Therefore, it can be inferred that the reaction does not proceed in dark as well as by self photocatalysis. It is worth to note that dye degradation activity of photocatalyst is strongly dependent on the activated carbon content and optimum distribution of CdS crystals on AC. Accordingly 3wt% AC/CdS gives the highest degradation (95% in 60 min), whereas pure CdS was recorded with the minimum (24% in 60 min). The calculated rate constant (k) of photocatalytic RhB dye degradation using pseudo first order model shows the ~11 times higher photocatalytic dye degradation rate 4.99×10⁻² min-1 for 3AC/CdS compared to pure CdS 4.57×10⁻³ min-1.35 The photocatalytic dye degradation rate follows the order: 3AC/CdS > 1AC/CdS > 5AC/CdS > 7AC/CdS > pure CdS which is in line with the studied fluorescence.
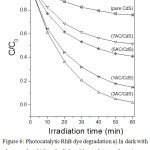 |
Figure 6: Photocatalytic RhB dye degradation a) In dark with photocatalyst, b) In solar light without photocatalyst, c) pure CdS, d) 7AC/CdS, e) 5AC/CdS f) 1AC/CdS and g) 3AC/CdS under solar light irradiation. |
Mechanism of the Enhanced Photocatalytic Activity and Synergistic Effect
Generally, the photocatalytic activity of semiconductor photocatalyst can be increased by doping, coupling, mixing and structure alteration or modification. Adsorption of pollutant on the surface of photocatalyst is very crucial step in photocatalytic process. The contact of CdS with activated carbon can form semiconductor/Nom-metal material heterojunction, which can reduce the photogenerated e/h pair recombination.36 The large surface area, good adsorptive nature and porous structure of activated carbon mark it as a good support and adsorbent for semiconductor photocatalyst. In the present work, we observed that the loading of CdS on activated carbon results in enhanced RhB dye degradation efficiency. Even though activated carbon itself is photocatalytically inactivated, it brings significant enhancement in the photocatalytic activity of CdS due to the formation of heterojunction. The organic molecules initially get adsorbed on the surface of activated carbon with CdS-AC heterojunction. The xAC/CdS samples with high surface area provide more adsorption sites for RhB dye as compared to pure CdS. The CdS molecules after solar light irradiation act as a photoactivated centre due to generation of e/h pair. These photogenerated e/h pairs further create activated species i.e. radicals. Subsequently, these strong oxidizing hydroxyl radicals demineralize the organic molecules those adsorbed on both the surface of AC and in contact with CdS. A mechanism for this synergistic effect is depicted in Fig. 7. The highest photocatalytic activity in 3AC/CdS inferred that the successful formation of heterojunction and the optimum distribution of CdS on activated carbon results in efficient collision between RhB dye and CdS molecules. However, the high adsorption of organic molecules may results in the decreased photocatalytic activity. Thus, the high activated carbon content in the photocatalyst (5wt % and 7wt %) increases its adsorption which in turn reduces effective collision of RhB molecules with CdS. This reduced collision results in decreased photocatalytic efficiency of 5AC/CdS and 7AC/CdS.
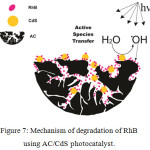 |
Figure 7: Mechanism of degradation of RhB using AC/CdS photocatalyst. |
In order to confirm the practical applicability of as prepared photocatalysts, the recyclability and stability was studied under similar conditions. The cycling runs in the solar photocatalytic RhB dye degradation using 3AC/CdS is shown in Fig. 8. For five successive cycles, the degradation rates after 60 min were 95%, 94.7%, 94.3%, 92.1% and 90.4%, respectively. The marginal decrease in the photocatalytic efficiency is due to the loss of photocatalyst during washing process. It is noteworthy that, after recycling the AC/CdS photocatalyst still maintains its stability and photocatalytic activity. These stability results indicate the successful loading of CdS on AC and also demonstrate AC/CdS as very feasible photocatalyst for solar photocatalytic wastewater treatment.
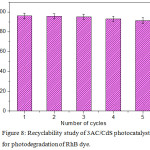 |
Figure 8: Recyclability study of 3AC/CdS photocatalyst for photodegradation of RhB dye. |
Conclusion
Herein, we report a highly activated and stable xAC/CdS photocatalysts successfully synthesized by facile one pot hydrothermal method. The RhB dye degradation efficiency of prepared photocatalyst was studied under natural sunlight irradiation. The prepared xAC/CdS photocatalysts show enhanced photocatalytic activity by shifting absorption towards the visible light region. The 3wt % of activated carbon was found to be the optimum mass ratio for the highest photocatalytic activity. The dye degradation efficiency of 3AC/CdS reaches 95% within 30 minute i.e. the rate is 11 times higher than pure CdS. This remarkable enhancement in photocatalytic activity of prepared photocatalyst is attributed to the synergistic effect of natural sunlight absorption, decreased band gap energy, high adsorption and increased surface area. We believe that the present work, using activated carbon as a support should serve as an important step in the field of band gap engineering.
Acknowledgements
This work is financed by Science & Engineering Research Board (SERB), Grant No. SB/EMEQ-029/2014 and DST-FIST, Grant No. SR/FST/College-262, New Delhi India.
References
- Wang, F.; Liang, L.; Chen, K.; Sun, J. J. Mol. Catal. A: Chem. 2016, 425, 76-85.
- Hu, Z.; Liu, G.; Chen, X.; Shen, Z.; Yu, J.C. Adv. Funct. Mater. 2016, 26, 4445-4455.
- Hu, Z.; Yuan, L.; Liu, Z.; Shen, Z.; Yu, J.C. Angew. Chem. Int. Ed. 2016, 55, 9580-9585.
- Gambhire, A.B.; Lande, M.K.; Arbad, B.R.; Rathod, S.B.; Gholap, R.S.; Patil, K.R. Mater. Chem. Phys. 2011, 125, 807-812.
- Ahmad, M.; Ahmed, E.; Hong, Z.L.; Xu, J.F.; Khalid, N.R.; Elhissi, A.; Ahmed, W. Appl. Surf. Sci. 2013, 274, 273-281.
- Ahmad, M.; Ahmed, E.; Hong, Z.L.; Ahmed, W.; Elhissi, A.; Khalid, N.R. Ultrason. Sonochem. 2014, 21, 761-773.
- Manjula, P.; Boppella, R.; Manorama, S.V. ACS Appl. Mater. Interfaces 2012, 4, 6252-6260.
- Wei, J.; Xue, S.; Xie, P.; Zou, R. Appl. Surf. Sci. 2016, 376, 172-179.
- Park, H.; Choi, W.; Hoffmann, M.R. J. Mater. Chem. 2008, 18, 2379-2385.
- Jia, X.; Tahir, M.; Pan, L.; Huang, Z.F.; Zhang, X.; Wang, L.; Zou, J.J. Appl. Catal. B: Environ. 2016, 198, 154-161.
- Neelgund, G.M.; Oki, A. Appl. Catal. B: Environ. 2011, 110, 99-107.
- Li, Q.; Guo, B.; Yu, J.; Ran, J.; Zhang, B.; Yan, H.; Gong, J.R. J. Am. Chem. Soc. 2011, 133, 10878-10884.
- Cai, Q.; Hu, Z.; Zhang, Q.; Li, B.; Shen, Z. Appl. Surf. Sci. 2017, 403, 151-158.
- Wang, Q.; Lian, J.; Ma, Q.; Zhang, S.; He, J.; Zhong, J.; Li, J.; Huang, H.; Su, B. Catal. Today 2017, 281, 662-668.
- Liu, S.X.; Chen, X.Y.; Chen X. J. Hazard. Mater. 2007, 143, 257-263.
- Wang, X.; Liu, Y.; Hu, Z.; Chen, Y.; Liu, W.; Zhao, G. J. Hazard. Mater. 2009, 169, 1061-1067.
- Laohhasurayotin, K.; Pookboonmee, S. Appl. Surf. Sci. 2013, 282, 236-244.
- Huang, H.B.; Wang, Y.; Cai, F.Y.; Jiao, W.B.; Zhang, N.; Liu, C.; Cao, H.L.; Lu, J. Front. Chem. 2017, 5, 1-10.
- Guo, J.; Guo, M.; Jia, D.; Song, X.; Tong, F. Chemical Physics Letters 2016, 659, 66-69.
- Hu, Y.; Liu, Y.; Qian, H.; Li, Z.; Chen, J. Langmuir 2010, 26, 18570-18575.
- Balushi, B.; Marzouqi, F.; Wahaibi, B.; Kuvarega, A.; Kindy, S.; Kim, Y.; Selvara, R. Appl. Surf. Sci. 2018, 457, 559-565.
- Tian, Z.; Yu, N.; Cheng, Y.; Wang, Z.; Chen, Z.; Zhang, L. Materials Letters 2017, 194, 172-175.
- Zou, S.; Fu, Z.; Xiang, C.; Wu, W.; Tang, S.; Liu, Y.; Yin, D. Chinese Journal of Catalysis 2015, 36, 1077-1085.
- Thakur, S.; Kshetri, T.; Kim, N.H.; Lee, J.H. J. Catal. 2017, 345, 78-86.
- Wang, J.; Liang, S.; Ma, L.; Ding, S.; Yu, X.; Zhou, L.; Wang, Q. CrystEngComm 2014, 16, 399-405.
- Wang, F.; Liang, L.; Shi, L.; Liu, M.; Sun, J. Dalton Trans. 2014, 43, 16441-16449.
- Ma, L.L.; Sun, H.Z.; Zhang, Y.G.; Lin, Y.L.; Li, J.L.; Wang, E.K.; Yu, Y.; Tan, M.; Wang, J.B. Nanotechnol. 2008, 19, 115709.
- Robel, I.; Bunker, B.A.; Kamat, P.V. Adv. Mater. 2005, 17, 2458-2463.
- Yu, H.; Zhao, Y.; Zhou, C.; Shang, L.; Peng, Y.; Cao, Y.; Wu, L.Z.; Tung, C.H.; Zhang, T. J. Mater. Chem. A 2014, 2, 3344-3351.
- Cho, S.; Jang, J.W.; Lee, J.S.; Lee, K.H. CrystEngComm 2010, 12, 3929-3935.
- Cao, S.W.; Yuan, Y.P.; Fang, J.; Shahjamali, M.M.; Boey, F.Y.; Barber, J.; Loo, S.C.; Xue, C. Int. J. Hydrog. Energy 2013, 38, 1258-1266.
- Lu, C.; Chen, R.; Wu, X.; Fan, M.; Liu, Y.; Le, Z.; Jiang, S.; Song, S. Appl. Surf. Sci. 2016, 360, 1016-1022.
- Gao, Z.; Liu, N.; Wu, D.; Tao, W.; Xu, F.; Jiang, K. Appl. Surf. Sci. 2012, 258, 2473-2478.
- Zhang, P.; Shao, C.; Zhang, Z.; Zhang, M.; Mu, J.; Guo, Z.; Liu, Y. Nanoscale 2011, 3, 2943-2949.
- Jing, F.; Liang, R.; Liang, J.; Chen, R.; Zhang, S.; Li, Y. Appl. Catal. B Environ. 2017, 206, 9-15.
- Songcan, W.; Ho, Y.J.; Bin, L.; Teera, B.; Piangjai, P.; Supphasin, T.; Mu, X.; Lianzhou, W. J. Mater. Sci. Technol. 2017, 33, 1-22.

This work is licensed under a Creative Commons Attribution 4.0 International License.
![]()
A New Edition of Web of Science
Journal Impact Factor
2022: 0.5
Five Year: 0.8
Journal is Indexed in

Cabells Whitelist
![]()


