Cadmium and Lead Adsorption Capacities of Nigerian Ultisol Soil of Tropics
Henry Olumayowa Oluwasola1, Jonnie Niyi Asegbeloyin*1 , Alfred Ezinna Ochonogor1, Julius Udeh Ani1, Collins Ugochukwu Ibeji1,2 and Ebube Evaristus Oyeka1
1Department of Pure and Industrial Chemistry, University of Nigeria, Nsukka.
2Catalysis and Peptide Research Unit, School of Health Sciences, University of KwaZuluNatal, Durban 4001, South Africa.
Corresponding Author E-mail: niyi.asegbeloyin@unn.edu.ng
DOI : http://dx.doi.org/10.13005/ojc/350312
Article Received on : 09-02-2019
Article Accepted on : 08-05-2019
Article Published : 13 May 2019
The study investigates the sorption of cadmium (Cd) and lead (Pb) by Nsukka urban soils, a Nigeria soil classified as an ultisol soil of tropics. Laboratory batch technique was utilized to investigate the effect of pH, temperature, contact time, and concentration on the adsorption process. Results showed that adsorption efficiency of the soils for Cd2+ and Pb2+ increased with increase in pH, temperature, and contact time but decreased with increase in concentration. The data from adsorption study was fitted to the Langmuir, Freundlich and Temkin adsorption isotherms, and results revealed that Langmuir isotherm fitted most satisfactorily. On the basis of the obtained maximum adsorption capacity (qmax) from the Langmuir model, the affinity of Cd and Pb for the studied soil was Pb2+ > Cd2+. Pseudo-second order (r2 ≥ 0.995-0.999) best described the kinetics of the sorption process for the metal ions in the soil.
KEYWORDS:Adsorption; Heavy Metal; Isotherm; Kinetics; Ultisol
Download this article as:| Copy the following to cite this article: Oluwasola H. O, Asegbeloyin J. N, Ochonogor A. E, Ani J. U, Ibeji C. U, Oyeka E. E. Cadmium and Lead Adsorption Capacities of Nigerian Ultisol Soil of Tropics. Orient J Chem 2019;35(3). |
| Copy the following to cite this URL: Oluwasola H. O, Asegbeloyin J. N, Ochonogor A. E, Ani J. U, Ibeji C. U, Oyeka E. E. Cadmium and Lead Adsorption Capacities of Nigerian Ultisol Soil of Tropics. Orient J Chem 2019;35(3). Available from: https://bit.ly/2JxXvn7 |
Introduction
Due to increasing industrialization and urbanization, heavy metals are continually introduced into the environment.1 Unfortunately, the heavy metals in soils can be taken up by crops via translocation, thereby entering the food chain. Consequently, soils provide a potential pathway through which heavy metals may become bioavailable to humans. Heavy metals are one of the most toxic inorganic pollutants which find their way to the surrounding either via natural or anthropogenic activities.2
The numerous adverse human health problems associated with exposure to heavy metals, even at low concentrations, entails, but are not limited to, neurotoxic and carcinogenic actions.3,4 The persistence of heavy metals in soil and their mobility are dependent on a number of phenomena which include sorption, desorption, complexation, oxidation/reduction, precipitation, and dissolution. In spite of these reactions proceeding simultaneously, availability of metals and their behaviour in the soil have been reported to be controlled by sorption mechanism.5 The concentration of metal ions and complexes in the soil solution is regulated by adsorption process and hence can majorly influence their absorption by plant roots.6 Heavy metals like cadmium (Cd) and lead (Pb) may exhibit high toxicity because of their ability to solubilize in water. Also, low concentration of heavy metals has deleterious effect on humans because of poor elimination mechanism from the body.7 Soils have active minerals and humic constituents present at its surface that are involved in retention of metal. Results from soil adsorption studies indicate that adsorption is pH, concentration, contact time and temperature dependent.8,9 An indepth study on adsorption mechanism is quite pivotal towards understanding the movement of toxic metals in soils that have been polluted, and the results obtainable from such studies could assist in providing possible alternatives for preventive environmental measures.10 Vast reports on the fate of heavy metals in soils have been confined to basically the world’s temperate region11 and the acquired data on the outcome of these pollutants in subtropical and tropical soils of Africa region are limited.12 This present study investigated Cd and Pb adsorption capacities by Nsukka urban soils; a Nigerian ultisol soil. The influences of pH, concentration, contact time as well as temperature on the sorption capacity of the soil were evaluated and data obtained were used to describe the process involved in the adsorption and to predict the mechanism of adsorption. The result and knowledge derived herein, could be useful in formulating guidelines when remediating soils contaminated by these metals.
Materials and Methods
Sampling and Physicochemical Properties
Three surface soils (0-30 cm) samples were obtained from varying locations (Table 1) in Nsukka urban, of Enugu State, South-Eastern Nigeria, by composting the random samples collected from locations which are quite a distance from anthropogenic activities. These soils broadly represent one of the typical soil types of tropics (ultisol). The samples were air-dried to remove moisture, and sieved to pass through a 2-mm mesh size sieve. Soil pH was determined using pH meter (Jenway, 3510), with samples prepared in the ratio of 1:2.5 (w/v) soil: water.13 Organic matter was determined by dichromate oxidation method.14 Particle size distribution was determined using hydrometer method.15 Cation exchange capacity was determined by method reported in literature.16 Exchangeable acidity was determined by potassium chloride method13 and exchangeable bases were determined using ammonium acetate method.13 The textural classification was determined by calculation.17
Cadmium and Lead Adsorption
Cadmium and lead adsorption by Nsukka urban soils were determined using a batch equilibrium technique. Dilutions were appropriately made with 0.01 M CaCl2 solution, which served as background electrolyte to bring about a relatively constant and defined ionic strength of the working concentrations in the process of metal adsorption. 0.20 g air-dried sieved samples were placed in plastic vials and 20 mL of the working concentrations of Cd, and Pb(NO3)2 were added and tightly sealed with Teflon lined screw caps and mechanically agitated on a horizontal shaker (Gallenkamp, HY-2), for 1 hour at 120 rpm at room temperature (25±1°C), and allowed to equilibrate for 24 hours. After equilibration, the vials were centrifuged using a centrifuge (US M-512) at 3000 rpm for 30 minutes, allowed to settle and filtered via Whatmann 110 mm filter paper into plastic vials, the filtrate were analyzed for Pb2+ and Cd2+ equilibrium concentration at a wavelength of 283.3 nm and 228.8nm respectively, using Shimadzu atomic absorption spectrophotometer (model AA-7000) with air-C2H2 flame. All analysis were done in triplicate and the average of the obtained results were employed for further relevant calculation as reported in literature.18
In order to ascertain the effect of time on the adsorption process, the plastic containers were incubated for 10 to 60 minutes. Equilibrium studies were conducted within concentration range of 5 to 50 mg/L at 25°C, and effect of temperature was obtained by varying temperature within a range of 25°C to 70°C. The experiments were conducted at the ambient pH of the soil, except while determining effect of pH, which was conducted by varying medium pH from 3 to 9 using initial concentration of 50 mg/L for Pb2+ and Cd2+ respectively at 25°C.
Data treatment
The amounts of Cd2+ and Pb2+ adsorbed were computed as the difference between the initial (Co) and equilibrium concentrations (Ce) of Cd2+ and Pb2+ respectively. The total amount of Pb2+ and Cd2+ adsorbed per unit mass of soil at equilibrium and the adsorption efficiency values were calculated using equations 1 and 2, respectively.
qe = V(Co-Ce)/M 16 (“> 1)
AE (%) = V(Co-Ce)/Co X 100 (2)
Where Co, Ce, V, M, and qe are the initial concentrations of adsorbate solutions (mg/L), equilibrium concentrations (mg/L), volume of adsorbate (mL), mass of adsorbent (g), and amount of adsorbate adsorbed by the adsorbent (mg/g), respectively. AE is the adsorption efficiency (%).
Results and Discussion
Soil Characterization
The soils physicochemical properties are presented in Table 1. The pH values were essentially in the acidic region (4.8-5.8), values obtained for soil organic matter (SOM) were in the range of 2.18 – 2.47%. ODG and UNN had the highest cation exchange capacities (CEC) compared to ONY. Value of 11.60 to 18.0 (me/100g) were obtained for the cation exchange capacities, exchangeable acidity (H+) values ranged from 1.2 to 2.0 (me/100g), Na+ was 0.04 to 0.06(me/100g), K+ value was from 0.03 to 0.06 (me/100g), Ca2+ gave 2.6 to 3.4 (me/100g) and values of 1.2 to 2.3 (me/100g) were obtained for Mg2+. Clay contents varied from 13.04 to 25.42%. The textural classification (Table 1) is an indication that the soils are classified as sandy clay loam (UNN, ODG) and sandy loamy (ONY).
Table 1: Mean of Physicochemical parameters of studied soils.
| Parameters | University of Nigeria Nsukka (UNN) |
Onuiyi (ONY) |
Odenigbo (ODG) |
| Clay (%) | 21.04 ± 0.02 | 13.04 ± 0.03 | 25.42 ± 0.02 |
| Silt (%) | 7.28 ± 0.01 | 11.67 ± 0.02 | 6.46 ± 0.01 |
| Fine sand (%)Coarse sand (%) | 26.16 ± 0.0245.52 ± 0.02 | 20.74 ± 0.0254.94 ± 0.02 | 27.92 ± 0.0240.20 ± 0.03 |
| Textural Class | SCL | SL | SCL |
| pH (H2O)pH (KCl) | 5.10 ± 0.074.80± 0.07 | 4.80 ± 0.074.40 ± 0.07 | 5.80 ± 0.075.40 ± 0.07 |
| CEC (me/100g) | 14.66 ± 0.02 | 11.60 ± 0.02 | 18.00 ± 0.02 |
| Organic Carbon (%) | 1.35 ± 0.04 | 1.25 ± 0.02 | 1.43 ± 0.01 |
| Organic matter (%) | 2.33 ± 0.04 | 2.18 ± 0.02 | 2.47 ± 0.07 |
| EA (me/100g) | |||
| H+ | 1.70 ± 0.01 | 1.40 ± 0.01 | 2.20 ± 0.01 |
| Al3+ | 1.20 ± 0.02 | Nil | Nil |
| EB (me/100g) | |||
| Na+ | 0.05 ± 0.01 | 0.04 ± 0.01 | 0.08 ± 0.01 |
| K+ | 0.06 ± 0.01 | 0.03 ± 0.01 | 0.06 ± 0.01 |
| Ca2+ | 2.90 ± 0.02 | 2.60 ± 0.12 | 3.40 ± 0.02 |
| Mg2+ | 1.60 ± 0.07 | 1.20 ± 0.02 | 2.30 ± 0.02 |
SCL: sand clay loam; SL: sand loam; CEC: cation exchange capacity; EA: Exchangeable Acidity; EB: Exchangeable bases.
Adsorption Studies
Effect of pH on Pb2+ and Cd2+ Adsorption
Soils have variable surface charge properties that are pH dependent. The solution pH is an essential parameter in the adsorption process, which affects charges on at the surface of the adsorbent materials and also the extent to which the adsorbate is ionized and specified.19 It has been reported that increase in medium pH of adsorbate leads to an increase in retention of divalent metal ion on the surfaces of the adsorbent via adsorption, inner sphere surface complexation and/or precipitation.20 In the present study, Pb2+ and Cd2+ adsorption follows similar trend of increase in retention of metal ion with increase in pH medium. (Figures 1 and 2). On increasing the pH medium from 3 – 9, there was an equivalent increase in deprotonation of the surface of the soil leading to a reduction in H+ ion on the soil surface. This allows more negative charge constituents on the surface of the soil, which support the adsorption of positively charged constituent as a result of less repulsion between the positively charged species and the positive adsorption sites on the soil surface.21 At initial pH 9, adsorption of Pb2+ and Cd2+ was at its maximum (100 %) for all soils studied, however, efficiency of adsorption decreased to 81 – 87 % for Pb2+ and 66.82 – 70.34 % for Cd2+ at pH 3. The adsorption efficiency of Pb2+and Cd2+ was higher in soils of ODG and UNN relative to ONY soil (Figures 1 and 2). The behaviour of Nsukka urban soil with respect to Pb2+ and Cd2+ adsorption is similar to reports from related studies.8
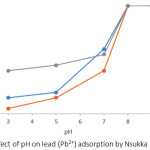 |
Figure 1: Effect of pH on lead (Pb2+) adsorption by Nsukka urban soils. |
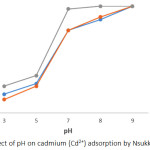 |
Figure 2: Effect of pH on cadmium (Cd2+) adsorption by Nsukka urban soils. |
Effect of Temperature on Pb2+ and Cd2+ Adsorption
A plot showing the effect of varying temperature (298-343 K) on adsorption of Pb2+ and Cd2+ by Nsukka urban soils are presented in Figures 3 and 4. The initial concentrations of heavy metal solution was 48 mg/L at a contact time of 1 hour. It was observed from the plot, that there was a significant increase in the adsorption of Pb2+ and Cd2+ with temperature increase from 298 K to 343 K; this pattern was observed for all soil samples under study. This could be due to an increase in pore sizes of the soil particles. It could also be as a result of expansion within the active surface site thereby creating more surfaces for adsorption of the metal ions. Furthermore, it could be explained, that the movement of the metal ions to the adsorbent increases with temperature increase. Similar trend has been earlier documented.9 The variation of temperature from 298 K to 343 K, resulted in an increase in adsorption efficiency of Pb2+ obtaining maximum adsorption at 99.38 % for ODG, 98.77 % for UNN and 98.15 % for ONY soil samples, while that for Cd2+ reached 99.44 % for ODG, 97.88 % for UNN and 97.33 % for ONY. The variation in the adsorption efficiency values obtained for the soils studied could be attributed to the slight variation in physicochemical parameters of the soil (Table 1). The percent removal follows the sequence Pb2+ > Cd2+.
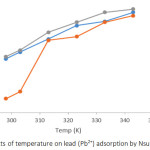 |
Figure 3: Effects of temperature on lead (Pb2+) adsorption by Nsukka urban soils. |
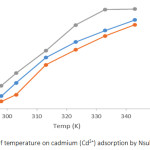 |
Figure 4: Effects of temperature on cadmium (Cd2+) adsorption by Nsukka urban soils. |
Effects of Ccontact Time on Pb2+ and Cd2+ Adsorption
Plots showing effects of contact time on Pb2+ and Cd2+ adsorption by the soils are presented in Figures 5 and 6. The results reveal that the adsorption efficiency for both Pb2+ and Cd2+ by all soils studied was characterized by fast adsorption at initial contact time which was then followed by slow but constant increasing adsorption with increase in contact time. This could be as a result of abundant adsorption sites (active centres) on the soil surface during the first period. After that, the active centres were saturated as a result of the accumulation of the metals on the soil surface. Similar trend has also been reported in related studies.9 Maximum adsorption of 100 % for Pb2+ was reached at contact time of 60 minutes for soils of ODG and UNN and 86 % for ONY soil. The adsorption maxima for Cd2+ at 60 minutes for ODG, UNN and ONY soils are 84 %, 74 % and 67 % respectively. The variation in the adsorption efficiency by the soils studied could be attributed to the slight variation in physicochemical parameters of the soil (Table 1). The adsorption efficiency of the metal ions followed the sequence Pb2+ > Cd2+.
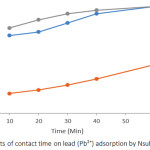 |
Figure 5: Effects of contact time on lead (Pb2+) adsorption by Nsukka urban soils. |
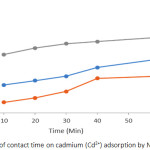 |
Figure 6: Effects of contact time on cadmium (Cd2+) adsorption by Nsukka urban soils. |
Effects of Concentration on Pb2+ and Cd2+ Adsorption
Adsorption rate is dependent on the initial concentration of the adsorbate, therefore it is a vital parameter to be considered. The initial concentration was set at 5, 10, 20, 25, and 50 mg/L and at a contact time of 1 hour. The adsorption efficiency of Pb2+ and Cd2+as presented in Figures 7 and 8 decrease with increase in the initial concentration of Pb2+ and Cd2+ ions. The implication of this is that the number of active centres on adsorbent are limited and at certain concentrations the active centres become saturated.22 However, at equilibrium, the adsorption capacity increases with an increase in initial concentration of Pb2+ and Cd2+ ion. This could be attributed to rising concentration gradient which acts as energy drive to overwhelm the resistances to mass transfer of the metal ions in between the aqueous phase and the solid phase. The present results are similar with results obtained from lead ions adsorption by calcareous soils.23 The adsorption efficiency of Pb2+ was found to be 100% for all soils at 5mg/L initial concentration. However, at 50 mg/L, the adsorption efficiency was found in the range of 40.72 – 50.16 %. Also, the adsorption efficiency for Cd2+ was found to be in the range of 91.4 – 99.6 % for the soils at 5 mg/L initial concentration, while at 50 mg/L adsorption efficiency was 19.74 – 25.10 %.
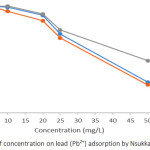 |
Figure 7: Effects of concentration on lead (Pb2+) adsorption by Nsukka urban soils. |
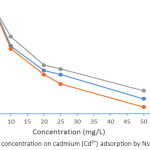 |
Figure 8: Effects of concentration on cadmium (Cd2+) adsorption by Nsukka urban soils. |
Adsorption Isotherm Models
Data obtained from adsorption equilibrium of Pb2+ and Cd2+ at 25°C were fitted to the linearized forms of the Langmuir, Freundlich, and Temkins isotherm models24-26 to know which of the isothermic models best explain the adsorption process. The equations of the isotherm models are outlined in equations (3), (4) and (5) respectively.
Langmuir: Ce/qe = 1/KL qm + Ce/qm (3)
Freundlich: Log qe = Log KF + 1/n log Ce (4)
Temkin: qe = A InKT + B InCe (5)
Where B and A are constants obtainable from RT/b, Ce is the adsorbate concentration at equilibrium (mg/L), qm (mg/g) is the maximum adsorption capacity; qe (mg/g) is the amount of adsorbate adsorbed at equilibrium (mg/g), KL(L/mg) is the Langmuir binding energy constant; KF and n are Freundlich constants related to adsorption capacity and surface heterogeneity respectively; KT (L/g) is equilibrium binding constant, b is adsorption heat, R is universal gas constant (8.314 JK-1) and T is temperature (K).
The monolayer coverage sorption capacity, qm and Langmuir binding constant, KL, values were obtained from the slope and intercept of the plot of Ce/qe against Ce, On the other hand, KF, and the exponent, n, were obtained from the slope and intercept of the plot of Log qe against Log Ce. The constants A (L/g) and B (mg/g) were obtained from the intercept and slope of the plot of qe against lnCe. The adsorption isotherm parameters for Langmuir, Freundlich and Temkin are presented in Table 2.
Table 2: Isotherm parameters for Pb2+ and Cd2+ adsorption by studied soil samples.
| Metals | Sample code | Langmuir | Freundlich | Temkin | ||||||
| qm | KL | R2 | 1/n | KF | R 2 | A | B | R2 | ||
| Pb2+ | UNN | 2.06 | 3.28 | 0.999 | 0.25 | 1 | 0.439 | 38.3 | 0.31 | 0.544 |
| ONY | 2.19 | 3.06 | 0.999 | 0.27 | 1 | 0.453 | 28.14 | 0.34 | 0.572 | |
| ODG | 2.54 | 2.2 | 0.998 | 0.26 | 1.15 | 0.428 | 6.81 | 0.53 | 0.726 | |
| Cd2+ | UNN | 1.07 | 0.53 | 0.993 | 0.11 | 0.65 | 0.91 | 4337 | 0.08 | 0.856 |
| ONY | 1.02 | 0.44 | 0.993 | 0.17 | 0.52 | 0.987 | 92 | 0.12 | 0.96 | |
| ODG | 1.32 | 0.42 | 0.983 | 0.11 | 0.74 | 0.929 | 7828 | 0.09 | 0.839 |
The coefficients of regression (R2) shows that the Langmuir isotherm could be used to describe cadmium and lead adsorption by all soils studied. This gave an indication of monolayer coverage on the sorption sites. The Freundlich and Temkin isotherm data gave a poor fit and hence could not be used to describe the adsorption process. The maximum adsorption capacity for Pb2+ varied from 2.06-2.54 (mg/g), while that for Cd2+ varied from 1.02-1.32 (mg/g), the affinity observed from these values is in the order of Pb2+ > Cd2+ and this order is reflected in the Langmuir bonding energy coefficient, Ka which reflects the energy of the adsorption process. The preponderance of Langmuir isotherm model at describing Pb2+ and Cd2+adsorption of the studied soils is in concordance with report from related study.27
The behavioural dissimilarities of the metal ions in solution could be ascribed to the observed trend of adsorption in the present study.
Table 3: Maximum adsorption capacities for cadmium and lead ions by different adsorbents.
| Adsorbents | Metals | Qmax (mg/g) | Isotherm |
Reference |
| Clay soil | Cd | 0.40 | Langmuir | 28 |
| Pb | 0.10 | |||
| Soil around industrial waste | Cd | 0.63 | Langmuir | 29 |
| Pb | 3.64 | |||
| Manganoxide mineral | Cd | 98.0 | Langmuir | 30 |
| Pb | 6.80 | |||
| Calcite | Cd | 18.52 | Langmuir | 31 |
| Pb | 19.92 | |||
| Almond shells | Cd | 7.00 | Langmuir | 32 |
| Pb | 9.00 | |||
| Aquatic plant (Ruppia maritima) | CdPb | 0.560.64 | Freundlich | 33 |
| Aquatic plant (Echinodorus amazonicu) | CdPb | 0.480.78 | Freundlich | 33 |
| Natural goethite | Cd | 1.05 | Langmuir | 34 |
| Pb | 2.40 | |||
| Ultisol soil | Cd | 1.32 | Langmuir | Present study |
| Pb | 2.54 |
Qmax = Maximum adsorption capacity.
Table 3 shows maximum adsorption capacities for both cadmium and lead ions by different adsorbents as reported by other workers,28-34 and values obtained from the soil under study. The adsorbents showed adsorption capacity in the order Pb2+ > Cd2+ except manganoxide mineral30 and clay soil.28 For most of the adsorbents, the adsorption process was best described by Langmuir isotherm.28-32,34 The adsorbents from aquatic plants33 however had their adsorption process best described by the Freundlich isotherm. The soil in the present study had better adsorption capacity when compared with natural goethite,34 almond shell,32 aquatic plants of (Echinodorus amazonicu) and (Ruppia maritima),33 clay soil,28 while almond shells,32 manganoxide mineral30 and calcite31 had higher adsorption capacity than the soils in the present study.
Adsorption Kinetic Model
The kinetic mechanism involved in the sorption of Pb2+ and Cd2+ by the studied soils, was ascertained by evaluating the data obtained from the effect of time in the experiments using three kinetic models; pseudo-first order, pseudo-second order and intra-particle diffusion kinetics models35,36,37;
The equations in their linearized forms are stated as follows;
Pseudo-first order: In (qe – qt) = In qe – k1t (6)
Pseudo-second order: t/qt = 1/k2qe2 + t/qe (7)
Intra-particle diffusion: qt= Kid t1/2 + I (8)
where qe and qt are the amounts of lead adsorbed (mg/g) at equilibrium and at time t, respectively and k1 is the Lagergren rate constant of first order adsorption (min-1), while k2 is the rate constant of second order adsorption (g/mg/min). k2 and qe values were computed from a plot of t/qt against t, I and Kid are the intercept and rate constant of the intra-particle diffusion.
From results presented in Table 4, it is obvious that the mechanism of the adsorption process for both Pb2+ and Cd2+ for all soils studied could not be described using pseudo-first order kinetics model since a poor fit to the kinetics data was obtained. This is indicated by the low regression (R2) values which range from 0.301-0.459, for both Pb2+ and Cd2+ adsorption by all soils studied.
Furthermore, the inappropriateness of the pseudo-first order kinetics model at describing the adsorption kinetics was also as a result of deviation in values of qe calculated from experimental qe as presented in Table 4, and likewise as a result of a non-linearity of the plots.
Also, the pseudo-first order kinetics data was poorly fitted as compared to the pseudo-second order kinetics which gave a better fit. In comparison of these two kinetic models, the values of the coefficients of regression (R2) of the pseudo-second order kinetics was found to give a better correlation (0.995–0.999). Also, the estimated sorption capacity (qe) values of the pseudo-second order kinetic showed closer proximity to the (qe) values obtained from the experiment (Table 4). Hence, these results gave an indication that the pseudo-second order kinetic could satisfactorily be used to describe the adsorption process. The implication of the suitability of this model in describing the mechanism of the adsorption process is that chemisorption is the rate determining step of the adsorption process. Similar observation from previous related works has been reported.8,23
Table 4: Kinetic parameters for Pb2+ and Cd2+ adsorption by studied soil samples.
| Sample code | Pseudo-first order | Pseudo-second order | Intraparticle diffusion | |||||||||||
| qe (cal) |
qe (exp) | R2 | qe (cal) | qe (exp) | R2 | qe (cal) | qe (exp) | I | R2 | |||||
| UNN | 0.02 | 1.20 | 0.305 | 1.22 | 1.20 | 0.999 | 1.05 | 1.20 | 1.05 | 0.962 | ||||
| Pb2+ | ONY | 0.02 | 1.04 | 0.452 | 1.06 | 1.04 | 0.998 | 0.89 | 1.04 | 0.89 | 0.931 | |||
| ODG | 0.09 | 1.20 | 0.300 | 1.26 | 1.20 | 0.995 | 0.82 | 1.20 | 0.82 | 0.980 | ||||
| UNN | 0.01 | 1.00 | 0.341 | 1.02 | 1.00 | 0.999 | 0.88 | 1.00 | 0.88 | 0.888 | ||||
| Cd2+ | ONY | 1.43 | 0.82 | 0.713 | 0.85 | 0.82 | 0.996 | 0.54 | 0.82 | 0.54 | 0.911 | |||
| ODG | 0.05 | 0.89 | 0.303 | 0.93 | 0.89 | 0.996 | 0.64 | 0.89 | 0.64 | 0.072 | ||||
The kinetic model of Weber and Morris intraparticle diffusion was used to ascertain whether film diffusion or intra-particle diffusion governs the rate limiting step of the adsorption process. The inclination from this model, suggests that for the sorption mechanism of a reaction to be intra-particle diffusion, a linear plot will be obtained when qt versus t1/2 is plotted, and if the plot passes via the origin, it gives an indication that this model will be the sole rate-limiting step.38 However, in this study, a plot of qt versus t1/2 was non-linear and also, there was a deviation from the origin, an indication that the sorption process was not governed by intra-particle diffusion and that the reaction comprised of more than one mechanism. The deviation from origin observed could be attributed to the rate of mass transfer differences that could have occurred between the initial and final step of the process during adsorption. Hence, this stipulates the existence of some effect associated with boundary layer and further affirmed that intraparticle diffusion model was not the only rate limiting step.
The values obtained for I (mg g-1) for intra-particle diffusion model in this study is a pointer to the thickness of boundary layer of Pb2+ and Cd2+ (sorbate) on the surface of the soil (sorbent). The qe values obtained from the experiment was greater than the I (mg g-1) values calculated (Table. 4) and this suggests that the sorption of Pb2+ and Cd2+ on these Nigerian tropical soils comprised of both adsorptions at the soil surface and partitioning within soil compositions like the organic / humic matter and clay.
Conclusion
The adsorption capacities of Nsukka urban soils in South-Eastern Nigeria for cadmium and lead was studied using batch technique. This research revealed that adsorption capacity of the soils for Cd2+ and Pb2+ increased with increasing pH, concentration, temperature and contact time. Cd2+ and Pb2+ adsorption data generated showed a highly significant fit to Langmuir isotherm. Comparatively, Langmuir adsorption isotherm has a better fit than Freundlich and Temkins adsorption isotherm. The adsorption ranking derived from the adsorption capacities of the soil obtained in this study showed that the performance of Nsukka urban soils in adsorbing the metal ions is in the order: Pb2+ > Cd2+. The adsorption mechanisms for both metals in all soils studied were satisfactorily described by the pseudo-second order kinetic model. The adsorption capacities observed in the study gave an indication of the soils degree of attraction for Pb2+ and Cd2+.
Acknowledgements
The authors are thankful to Energy Research Centre, University of Nigeria, Nsukka, and Project Development Agency, Enugu, Nigeria for making their research facilities available for some analysis.
Conflict of Interest
The authors declare that there is no conflict of interest regarding the publication of this article.
References
- Hegazi, A. H. HBRC Journal, 2013, 9, 276-282.
- Monisha, J.; Tenzin, T.; Naresh, A.; Blessy, B. M.; Krishnamurthy, N. B. Interdiscip. Toxicol. 2014, 7(2), 60–72.
- Jomova, K.; Valko, M. Toxicology, 2010, 283, 65–87.
- Tokar, E.J.; Benbrahim-Tallaa, L.; Waalkes, M.P. Metal Ions on Life Science, 2011, 8, 375-401.
- Caporale, A.G.; Violante, A. Current Pollution Report 2016 2(1): 15-27
- Ramachandran, V.; Souza, S. F. D. Journal of Soil Science and Plant Nutrition, 2013, 13(1), 165-173.
- Suruchi; Pankaj K. Research Journal of Environmental Toxicology, 2011, 5, 162-179.
- Das, B.; Mondal, N. K.; Bhaumik, R.; Roy, P. Int. Journal of Environ. Sci. Technol., 2014, 11, 1101-1114.
- Noppadol, S.; Pongsakorn, P. Polish Journal of Environmental Studies, 2014, 23(3), 853-865.
- Mellis, E. V.; Pessoa da Cruz, M. C.; Casagrande, J. C. Scientia Agricola, 2004, 61, 190-195.
- Al-Hamdan, A.Z.; Reddy, K.R. Geotechnical and Geological Enginering, 2006, 24, 1679-1693.
- IUPAC- International Union of Pure and Applied Chemistry, Pure and Applied Chemistry, 1997, 69(6), 1349-1371.
- McLean, E. O.; In: Miller R. H.; Keeney, D. R. (Eds). ASA and SSSA, 1982, 2, 199-224.
- Nelson, D. W.; Sommers, L. E. Proceedings of the Indiana Academy of Science, 1975, 84, 456 -462,
- Gee, G. W.; Bauder, J. W.; In: Klute, A. (Eds), 1986, ASA, 377- 382.
- Chapman, H. D.; in Black, C.A. (Ed.) Am. Soc. Of Agon. Inc., 1965, 9, 891-901.
- Soil Survey Staff, United States Department of Agriculture, Natural Resources Conservation Service, 2006, 10, 331,
- Fontes, M. P. F.; Gomes P. C. Applied Geochemistry, 2003, 18, 795-804.
- Imamoglu, M.; Tekir, O. Desalination, 2008, 228(1–3), 108–113.
- Appel, C.; Lena, M. Journal of Environmental Quality, 2002, 31, 581 – 589.
- Ofomaja, A. E.; Unuabonah E. I.; Oladoja, N. A. Bioresourc Technol, 2010, 101(11), 3844–3852.
- Tsai, W. T.; Chen, H. R. Journal of Hazardous Materials, 2010, 175(1-3), 844-849.
- Das, B.; Mondal, N. K. Universal Journal of Environmental Research and Technology 2011, 1(4), 515-530.
- Langmuir, I. Journal of American Chemical Society, 1916, 38(11), 2221-2295.
- Freundlich, H. M. F. Journal of Physical Chemistry, 1906, 57, 385-471.
- Tempkin, M. I.; Pyzhev, V. ActaPhysicaChemica, 1940, 12, 327-356.
- Salami, N.; Adekola, F. A. African journal of science and technology, 2005, 6(2), 55-66.
- Budianta, W. J. SE Asian Appl. Geol., 2011, 3(1), 72-75.
- Zakari, H. A.; Ahmad, S. R. International Journal of Scientific and Research Publications, 2015, 5(11), 612-619.
- Sönmezay, A.; Öncel,S.; M.; Bektaş, N. Trans. Nonferrous Met. Soc. China, 2012, 22, 3131−3139.
- Yavuz, Ö.; Guzel, R., Aydin, F., Tegin, I., Ziyadanogullari, R. Polish J. of Environ. Studies, 2007, 16(3), 467-471.
- Mehrasbi, M. R.; Farahmandkia, Z.; Taghibeigloo, B.; Taromi, A. Water Air Soil Pollut, 2009, 199, 343–351.
- Deng, P. Y.; Liu, W.; Zeng, B. Q., Qiu, Y. K., Li, L. S. Int. J. Environ. Sci. Technol., 2013, 10, 559–566.
- Abdus-Salam, N.; Adekola, F. A. African Journal of Science and Technology, 2005, 6(2), 55 – 66.
- Ho, Y.; McKay, G. Process Biochem.1999, 34(5), 451–465.
- Ho, Y. S. Journal of Hazardous Materials. 2006, 136, 681-689.
- Weber, W. J.; Morris, J. C. Journal of the Sanitary Engineering Division- American Society of Civil Engineering, 1963, 89, 31-60.
- Olu-Owolabi, B. I., Diagboya, P. N., Adebowale, K. O. Geoderma, 2015, 239–240, 179–185.

This work is licensed under a Creative Commons Attribution 4.0 International License.
![]()
A New Edition of Web of Science
Journal Impact Factor
2022: 0.5
Five Year: 0.8
Journal is Indexed in

Cabells Whitelist
![]()


