Bacterial Cellulose Based Biocomposite from Guava Fruit Reinforced with Bamboo Microfibrillated Cellulose Through Impregnation Method
S. Silviana*1 and Siti Susanti2
1Department of Chemical Engineering, Faculty of Engineering, Diponegoro University, Semarang, Indonesia.
2Food Technology Division, Department of Agriculture, Faculty of Animal and Agricultural Sciences, Diponegoro University, Semarang, Indonesia.
Corresponding Author E-mail: silviana@che.undip.ac.id
DOI : http://dx.doi.org/10.13005/ojc/350315
Article Received on : 21-02-2019
Article Accepted on : 01-05-2019
Article Published : 06 May 2019
Commercial plastics synthesized from fossil oil can significantly affect the environment due to its non-biodegradable property. It is an attempt to minimize the use of the plastics substituted with biodegradable plastics such as biocomposite. Biocomposite matrix can be synthesized from cellulose. A potential cellulose source can be obtained from bacterial cellulose. The bacterial cellulose observed in this study was extracted from guava. Bamboo microfibrillated cellulose was used as reinforcement agent. The objectives of this paper are to obtain optimum condition of bacterial cellulose from guava reinforced with microfibrillated cellulose of bamboo and to identify the characteristics of the biocomposite product such as its mechanical (tensile strength), morphological (SEM), thermal (DSC and TGA) and structural properties (FTIR and TGA). The results show that optimal conditions of the modified biocomposite was achieved at 5%-w/v of bamboo microfibrillated cellulose with tensile strength of 59.81±4.81 MPa. Furthermore, the biocomposite had good thermal stability. It was confirmed by TGA analysis with glass transition temperature of 150°C higher than that of guava bacterial cellulose without the reinforcement of bamboo microfibrillated cellulose, i.e at 110°C.
KEYWORDS:Bacterial Cellulose; Bamboo; Biocomposite; Guava; Microfibrillated Cellulose
Download this article as:| Copy the following to cite this article: Silviana S, Susanti S. Bacterial Cellulose Based Biocomposite from Guava Fruit Reinforced with Bamboo Microfibrillated Cellulose Through Impregnation Method. Orient J Chem 2019;35(3). |
| Copy the following to cite this URL: Silviana S, Susanti S. Bacterial Cellulose Based Biocomposite from Guava Fruit Reinforced with Bamboo Microfibrillated Cellulose Through Impregnation Method. Orient J Chem 2019;35(3). Available from: https://bit.ly/2LoLpPz |
Introduction
Plastic consumption is still dominated by product packaging about 65%, almost 60% of the use of plastic packaging in the food and beverage industry.1 Plastics are made from petroleum polymers polluting the environment because they cannot be degraded.2 Biocomposites denotes as one of the alternative solutions to overcome the plastic problem.
Cellulose-based biocomposite as both the matrix and reinforcement has also been developed.3 However, there are constraints in term of cellulose isolation from biomass regards with impurities such as hemicellulose and lignin. Furthermore, it consequently takes more time and chemicals to prepare pure cellulose. Therefore, pure cellulose produced from bacteria called bacterial cellulose (BC) has been used to substitute pure cellulose preparation. Currently, BC is widely used as control-release material, wound dressings and conducting materials,4 cellulose biocomposite with addition of glycerol, chitosan, and silver nanoparticle,5 bacterial cellulose (BC)-based hydrogel materials with modification and crosslinked BC.6 Thus, the opportunity for the development of biocomposite comprised of BC matrix reinforced with bamboo cellulose is substantial and potential way to cut off the complicated cellulose preparation from biomass. The production of biocomposites can be done in several different methods such as impregnation method, filament winding method and pultrusion method. The method used in this research is impregnation method due to easy and inexpensive pretreatment process.7
In previous studies, starch,8 and chitosan9 were used to strengthen BC matrixed biocomposite. The disadvantage of the biocomposites produced was having weak mechanical properties with tensile strength of 26.72 ± 0.68 MPa8 and 49.55 ± 1.40 MPa.9 Hence the use of reinforcing agent generating higher mechanical properties is desirable. Biocomposites have been widely developed from various matrices and reinforcements, such as poly lactic acid (PLA) biocomposites reinforced by microfibrillated cellulose (MFC) from wood fibers10 and bamboo fibers.11 Several studies have used MFC as a composite reinforcement material of various types of matrixes such as chitosan,8 gelatin,9 reinforced sago starch-based biocomposite.12,13 reinforced cassava bagasse starch.14 The mechanical properties of bamboo fiber produced is comparable to glass fibers. The bamboo fiber such as microfibrillated cellulose (MFC) is a form of cellulose refined from plants. MFC has a Young’s modulus of about 2.0 – 2.3 GPa, fracture strain of about 3.1%, and tensile strength of about 39 MPa.15 MFC can be obtained from the extraction of various non-wood sources including banana, mulberry, wheat straw and also bamboo.16 Since bamboo is huge available in Indonesia, then this material was selected to provide the MFC for this paper.
Guava (Psidium guajava) is a fruit grow in tropical and subtropical areas such as in Indonesia. The rate production achieves 220,202 tons per year. Overall composition of nutrient in 100 g of guava can be seen in Table 1.
Table 1: Nutrient contents in Guava fruit (per 100 g).17
| Energy | 68 kkal |
| Protein | 2.55 g |
| Fat | 0.95 g |
| Carbohydrate | 14.32 g |
| Glucose | 8.92 g |
| Vitamin C | 228.3 mg |
| Water | 80.80 g |
Bacterial cellulose (BC) is a cellulose with high purity produced by several types of bacteria and characteristically flexible. BC can be produced from the fermentation process on the substrate containing sugar and nitrogen at pH around 4 – 4.5. Technically, BC can be made from a mixture of various media, since the growth of the Acetobacter xylinum bacteria requires sugar (glucose), organic acids and minerals. Generally, BC can be produced with several media in static and agitation cultures using several carbon sources with supplementary materials employing many kind of microorganism.18 Guava was selected to be a raw material of bacterial cellulose due to potential purpose as edible biocomposite consisting with high vitamin C. Therefore, the paper studies guava-based bacterial cellulose reinforced microfibrillated cellulose through impregnation method.
Materials and Method
Bamboo used in this study was obtained from a plantation in Sragen, Central Java, while the guava fruit and Acetobacter xylinum bacteria were purchased from Semarang. The chemicals used to isolate microfibrillated cellulose were n-Hexane (99.9%), alcohol (96%), NaOH (99.99%), H2O2 (50%) supplied from PT. Brataco along with aquadest. The production of bacterial cellulose used vinegar ((25% of glacial acetic acid content), MgSO4 (99%) and KH2PO4 (98.5%) from PT. Brataco, and urea (46%) purchased from local chemical store at Semarang.19x
Methods
Pretreatment of Bamboo
Bamboo was cut into smaller pieces with a length of 10 cm, then stripped of its skin. The slices of bamboo skin were chopped to form flakes to ease the grinding process releasing powder.
Extraction of Bamboo Cellulose Fibre
This process referred to previous research of microfibrillated cellulose12-14 consisting in several stages. First, the bamboo powder was washed at 90°C of water to remove dust and other impurities. Then, it was dewaxed using n-hexane and ethanol (2:1) in Soxhlet for 6 h. Furthermore, the bamboo powder was mixed with 2M sodium hydroxide (NaOH) at 78°C for 4 h. For every 20 g of bamboo the process was repeated twice. The product of this process was then washed with aquadest to achieve pH of 7. The delignified product was then mixed with hydrogen peroxide (H2O2) 4% at the temperature of 83°C for 3 h. This step was done in two times. Prior heating, the pH of the solution was set to be 11.5 by NaOH. The extracted solid was washed with aquadest until the filtrate was neutral or pH of 7. The MFC later was grounded with high energy milling (HEM) equipment into micron powder with homogeneous sized powder (100 mesh). Bamboo MFC solution was made according to predetermined variables. This solution was prepared by mixing a percentage of weight of MFC with water and introduced an ultrasonic homogenizer to obtain homogenous solution.
Pretreatment of Guava
At this stage, one and a half of guava fruit with a diameter of ± 7 cm was washed first and then cut into pieces. The fruit pieces then inserted into a blender and was mixed with 600 mL of water. The juice was later filtered using a filter cloth to separate the juice with the pulp.
Preparation of Bacterial Cellulose (BC)
As much as 600 mL of the guava solution was added with 10 g of urea, 12 g of KH2PO4, 6 g of MgSO4 and glucose as much as 20 %-w. The solution was then boiled to sterilize the solution. The solution was acidified using acetic acid with a pH of 4.5. Then Acetobacter xylinum as much as 20 %-v was added as a source of bacteria. The end step, the media was incubated for 6 days.
Preparation of Biocomposite through Impregnation
Bacterial cellulose (BC) produced was first rinsed by water and soaked with sodium hydroxide solution for 2 h. The impregnation method was carried out by immersing bacterial cellulose in MFC solution at certain concentration. The impregnation process was done for as long as 7 days. Afterwards, the impregnated BC was introduced a manual hot press at temperature of 70°C for 2 h to make dry and thickness of 0.2 mm. Impregnated BC was then called as biocomposite for this paper. Samples consisted of 5 different composition of bamboo MFC and BC weight. Detail information of the biocomposites can be seen in Table 2.
Table 2: Composition of the biocomposites.
|
Sample |
BC mass (g) |
MFC concentration (%-w/v) |
|
G0 |
0.53 |
0 |
|
G1 |
0.48 |
1 |
|
G2 |
0.42 |
3 |
|
G3 |
0.53 |
5 |
|
G4 |
0.61 |
8 |
|
G5 |
0.76 |
10 |
Tensile Strength Analysis
The biocomposite sample tested was cut into size of 0.5 x 5 cm and analyzed in the Texture Analyzer Brookfield CT3 with normal stretching and a tensile strength test was performed.
Structural and Functional Groups Analysis
This qualitative analysis was aimed to find out the changes of biocomposite molecular structure using IRPrestige-21 Fourier Transform Infrared Spectroscopy (FTIR) instrument, Shimadzu (Japan) at Advanced Mineral and Materials Laboratory of Malang State University.
Morphology Analysis
The product was analyzed for surface topography and fracture behavior using SEM emission with tensile mode. SEM observations used voltage acceleration of 5kV from Scanning Electron Microscope (SEM) Inspect S50 (FEI).
DSC Analysis
This analysis was to determine the glass transition temperature of the bioplastic samples and the degradation temperature of the samples using the DSC-60 PLUS tool at the Integrated Research and Testing Laboratory of Gadjah Mada University. The operating conditions of the test were carried out at temperature of 30°C – 300°C, temperature rate of 10 °C, and flow rate of nitrogen of 30 mL/min.
TGA Analysis
The tested samples were used to predict the thermal stability of a bioplastic using a DTG-60 TGA Analyzer instrument. The operating conditions of the test were carried out at temperature of 30°C – 300°C, temperature rate of 10°C, and flow rate of nitrogen of 30 mL/min.
Crystalline Analysis
This analysis used Xaltical XRD tool, Xpert Pro (Ultrecht, Netherland) at the Advanced Mineral and Materials Laboratory of Malang State University. This analysis was aimed to see the phase formed on biocomposite materials. This analysis used 40 kV and 30 mA currents. Results from XRD were recorded at 2θ angles in the 10°C to 70°C range.
Discussions
Biocomposite Mechanical Properties
Bacterial cellulose significantly affects tensile strength of biocomposite. The results of the samples tensile strength test can be seen in Figure 1. The tensile strength of pure BC biocomposite (G0) was found to have an average of 33.54 ± 3.50 MPa. This value was smaller than the BC biocomposite reinforced with MFC. The highest measurement of tensile of biocomposite was achieved in sample of G3 reinforced MFC of 5 %-w/v at 59.81 ± 4.81 MPa. Meanwhile, the lowest tensile strength was found in sample of G5 (MFC of 10 %-w/v), i.e 39.76 ± 5.24 MPa. The dispersed nanocellulose in another cellulose matrix will form a fiber network in the cellulose and can form bonds between the nanocellulose and the cellulose matrix through hydrogen bonds.3 In the case of this research, the MFC was denoted as dispersed phase, while bacterial cellulose acted as the matrix phase. The cellulose molecules have the ability to form hydrogen bonds in one polymer chain as well as across the polymer chain. The hydrogen bond between the molecules causes the adjacent cellulose chains to be clumped and intertwined to form larger fibers.20
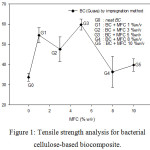 |
Figure 1: Tensile strength analysis for bacterial cellulose-based biocomposite. |
In the G4 reinforced MFC of 8 %-w/v the tensile strength of the biocomposite decreased to 36.36 ± 13.14 MPa and in the G5 sample the tensile strength of biocomposite was 39.76 ± 5.24 MPa resulted from the addition of MFC exceeded the optimum limit. The more MFCs are added, the MFC will become more susceptible to aggregation.21
DSC Analysis
In this measurement the sample was heated to 300°C with a temperature rate of 10°C/ min. The DSC measurement results can be seen in Figure 2. It can be seen that BC biocomposite reinforced MFC can change a significantly in Tg point. Tg is the temperature at which the sample may change texture from elastic to rigid or glass-like. Biocomposites without the reinforcement of MFC attained Tg of 110°C while Tg of bioplastic reinforced MFC increased to 150°C. The change was possible due to the fact that the reinforcement of MFC changes cellulose biocomposite structure resulting in the change of resistance to heat.22 High Tg is highly advantageous for biocomposites because at storage temperatures melting or decomposition of the material can be minimum.23 High Tg values also indicate the thermal stability of biocomposites. Fig. 4 shows the degradation temperature of the G0 and G3 biocomposites. Biocomposite G0 achieved a degradation temperature at 206°C while the degradation temperature of the G3 sample was too high to be determined. This shows that the G3 degradation temperature was higher than the sample G0.
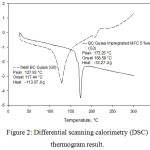 |
Figure 2: Differential scanning calorimetry (DSC) thermogram result. |
FTIR Analysis
Structural analysis was performed on the same biocomposites as in the morphological analysis. The results of functional group analysis using FTIR was obtained by interpreting transmittance peaks from the infrared spectrum. Figure 3 displays results of FTIR analysis of G0 and G3 samples. The graph shows transmittance peaks in certain wavenumbers. It is observed that transmittance peaks of the G0 (bacterial cellulose) sample is the same as the transmittance peaks of the G3 sample (reinforced MFC of 5 %-w/v). The results show that the addition of MFC can alter not only the chemical bonding between bacterial cellulose as matrix and MFC as disperse phase but also can increase the intensity of each bond.
A strong transmittance peak lies in wavenumber range of about 3050 cm-1 – 3700 cm-1 indicating the presence of a stretching –OH bond.24 In that range the intensity of transmittance peak of G3 was higher than G0 sample resulted by the addition of MFC. This result indicated that the addition of MFC can increase the amount of hydrogen bond in the biocomposite.3 In addition, measurements with FTIR also show a peak in an area of approximately 890 cm-1. This region indicates the presence of a stretching C–O–C bond [25]. The C–O–C groups presented in the biocomposites are derived from the glycosidic bonds of the pyranose ring belonging to the saccharide type including cellulose.25 Furthermore, peak also appears in the 1800 cm-1 range showing C=O bond.8 In Figure 3 the intensity of the C=O and C–O–C groups increase with the presence of an MFC in bacterial cellulose. In general, the both the C=O and C–O–C groups make up the cellulose structure.
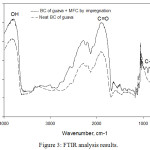 |
Figure 3: FTIR analysis results. |
LOI = A1430 / A896 Eq. 1
HBI = A3350 / A1318 Eq. 2
Based on FTIR results, the value of Lateral Order Index (LOI) and Hydrogen Bond Intensity (HBI) can also be obtained. LOI is determined by the absorbance ratio at peak between 1430 cm-1 (A1430) or 1420 cm-1 (A1420) and 896 cm-1 (A896), calculated based on the Eq. 1. While HBI is determined by absorbance ratio at peak 3350 cm-1 and 1318 cm-1, calculated according to the Eq. 2.26
The calculation of LOI of G0 and G3 samples achieved different results. LOI for sample G0 is 1.46 % while G3 has LOI value of 1.66%. LOI increased due to the addition of MFC to the G3 sample. The results are in accordance with previous research conducted that the addition of MFC will increase the LOI value of cellulose.3 Meanwhile, the calculation of HBI gave G0 sample a value of 1.05% that decreased with the addition of MFC to 0.98% in G0 sample. The decrease of HBI value is because the addition of MFC will increase the concentration OH bond as described previously. HBI from biocomposites is also influenced by the water contained. The larger the HBI value the smaller the water content in the biocomposite. HBI calculations show that the water content in the G3 sample is larger than the G0 sample. This correlates with the results of TGA analysis where in the G3 sample there was a large water evaporation compared to water evaporation that occurred in G0 sample.
TGA Analysis
In this analysis, the sample tested were samples of G0 and G3. The sample weights analyzed was 10 mg for sample G0 and 2 mg for sample that were heated to 300°C. The TGA analysis results are shown in Fig. 4.
Fig. 4(a) shows the decomposition of G0 sample. Throughout the heating process from room temperature to 135°C reduction of mass did not occur in the biofilm. The decrease in mass occurred when the heating temperature reached 135°C. When the temperature reached 180°C, the mass of the sample decreased by 87%. The drastic decrease in mass occurred because at the temperature of 135°C – 180°C there had been depolymerization of the bacterial cellulose of the guava juice.27
Fig. 4(b) shows that the G3 sample till the temperature of 300°C experienced two stages of mass reduction. The first stage occurred at temperature range of 65°C – 140°C due to evaporation of water in the biocomposite, perpetrated by the hydrophilic characteristic of the fibers.28 Up until this stage there was a mass decrease of 5%. The second stage occurred from the temperature of 250°C until the final temperature of heating. This is the degradation stage caused by the breakdown of the glycosidic bond, which leads to the formation of CO2 and H2O.29 At a temperature of 300°C, the G3 sample had not been fully decomposed thus its mass reduction was not optimum. This transpired because the decomposition temperature of sample G3 was at temperatures above 300°C.
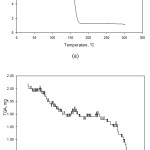 |
Figure 4: TGA Thermogram of: (a) Guava BC (G0) Biocomposite; (b) Guava BC with 5% of MFC (G3) Biocomposite. |
The decrease in mass due to the evaporation of water content in biocomposites was more evident in G3 sample than G0 sample. This is because the G3 sample has been added with MFC. MFC has the tendency to absorb water.22 Since MFC was dispersed in water and experienced water evaporation, it can be said that when the added MFC underwent the impregnation process it absorbed water from the outside. The cellulose decomposition of G0 sample occurred at 135°C – 180°C. Whereas in G3 sample, the decomposition occurred at a temperature range of 250°C – 300°C. This evidence indicates that the addition of MFC as a reinforcing agent to the biocomposite can also increase the decomposition temperature of the biocomposite. This result correlates with previous study that with the addition of cellulose powder such as MFC as reinforcement will increase the thermal stability of the biocomposite.21
XRD Analysis
The sample measurements were performed at room temperature with CuKα radiation (λ = 1.54 Å) recorded at an angle of 2θ in the 10°C to 70°C range with an increase of 0.02, a voltage of 40 kV and a current of 30 mA.
In Figure 5(a), it can be seen that the MFC powder at an angle of 2θ = 22.5°C has a peak that is not sharp and widened. This indicates that the MFC used in the study is amorphous.
Fig. 5(b) displays that the G0 biocomposite G0 has a sharp and widened peak at an angle of 2θ = 20°C– 22°C. The presence of the peak signifies the presence of cellulose type I in the biocomposite.22 In addition, there is also a peak with a weak intensity at an angle of 15.5°. This weak peak indicates that there is cellulose type II in G0 sample.30
Fig. 5(c) shows the result of XRD analysis of the G3 biocomposite. The XRD analysis result demonstrates that there is a peak with a fairly sharp intensity at an angle of 22.17°C indicating the presence of cellulose type I in the biocomposite. From the results of the XRD analysis conducted, it can be said that the G3 sample contents cellulose type I same as MFC and G0 sample. This indicates that there is a match between the bacterial cellulose as the matrix and the MFC as reinforcing agent, resulting in a good interaction between the two.3 Based on the comparison of Figures 5(b) and 5(c) it can be seen that there is a difference of intensity at the angle of 20°C – 22°C between the pure BC biocomposite (G0) and the BC MFC-reinforced biocomposite. The difference in intensity indicates that G0 is more crystalline than G3. This happens because in G3 sample, the crystalline bacterial cellulose reacted with amorphous MFC. The addition of amorphous MFC can disrupt natural bindings of BC fibers and affect the crystalline structure of bacterial cellulose31 as proven by the FTIR analysis of both samples. This caused the crystalline intensity of bacterial cellulose to decrease after MFC was added.
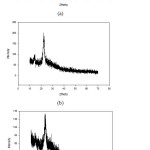 |
Figure 5: Result of X-ray Diffraction (XRD) analysis of: (a) MFC powder; (b) Guava BC (G0) Biocomposite; (c) Guava BC with 5% of MFC (G3) Biocomposite. |
Conclusion
Bacterial cellulose-based biocomposite derived from guava fruit has a tensile strength of 33.54 ± 3.50 MPa and impregnated by bamboo microfibrillated cellulose of 5%-w/v. It was obtained a tensile strength of 59.81 ± 4.81 MPa. Microfibrillated cellulose can improve the thermal stability of the biocomposite by increasing the point of glass transition and decomposition temperature of the biocomposite, increasing the concentration of cellulose constituents. It can also affect the morphology and crystal structure of the bacterial cellulose.
Acknowledgements
Acknowledgments and gratitude are addressed to the Advanced Materials Laboratory (AMaL) and coworkers at Department of Chemical Engineering, Diponegoro University for support to accomplish this research.
Confilict of Interest
There is no confilict of interest.
References
- Sanchis, Y.; Yusá, V.; Coscollà, C. J. of Chromatography A. 2017, 1490, 22-46.
- Berto, D.; Rampazzo, F.; Gion, C.; Noventa, S.; Ronchi, F.; Traldi, U.; Giorgi, G.; Cicero, A. M.; Giovanardi, O. Chemosphere. 2017, 176, 47-56.
- Wang, W.; Liang, T.; Bai, H.; Dong, W.; Liu, X. Carbohydr Polym. 2018, 179, 297-304.
- Sulaeva, I.; Henniges, U.; Rosenau, T.; Potthast, A. Biotechnol Adv. 2015, 33, 1547-1571.
- Rohaeti, E.; Laksono FX, E.W.; Rakhmawati, A. Orient j. chem. 2018, 34, 3, 1341-1349.
- Chaiyasat, A.; Jearanai, S.; Moonmangmee, S.; Moonmangmee, D.; Christopher, L.P.; Alam, M.N.; Chaiyasat, P. Orient j. chem. 2018, 34, 4, 1735-1740.
- Martínez, I.; Partal, P.; Garsía-Morales, M.; Guerrero, A.; Gallegos, C. J. of Food Eng. 2013, 117, 247-257.
- Wan, Y. Z.; Luo, H.; He, F.; Liang, H.; Huang, Y.; Li, X. L. Compos Sci Tech. 2009, 69, 1212-1217.
- Xuejiao, W.; Xie, Y.; Ge, H.; Chen, L.; Wang, J.; Zhang, S.; Guo, Y.; Li, Z.; Feng, X. Carbohydr Polym. 2018, 179, 207-220.
- Tingaut, P.; Zimmermann, T.; Lopez-Suevos, F. Biomacromolecules. 2010, 11, 454-464.
- Zhang, J.; Song, H.; Lin, L.; Zhuang, J.; Pang, C.; Liu, S. Biomass and Bioenergy. 2012, 39, 78-83.
- Silviana, S.; Hadiyanto, H. AIP Conf. Proc. 2017, 1855, 030024-1 – 030024-5.
- Silviana, S.; Didi Dwi, A. Adv. Sci. Lett. 2017, 23, 3, 2591-2594.
- Silviana, S.; Susanti, S.; Subagio, A., MATEC Web Conf. 2018, 156, 01019-1 – 01019-5.
- Dastidar, T. G.; Netravali, A. ACS Sustain. Chem. Eng. 2013, 1, 1537-1544.
- Nguyen, H. D.; Mai, T. T. T.; Nguyen, N. B.; Dang, T. D.; Le M. L. P.; Dang, T. T.; Tran, V. M. Adv Nat Sci: Nanosci Nanotech. 2013, 4, 015-016.
- Ninga, K. A.; Sengupta, S.; Jain, A.; Desobgo, Z. S. C.; Nso, E. J.; De, S. J. of. Food Eng. 2018, 221, 158-166.
- Shah, N.; Ul-Islam, M.; Khattak, W.A.; Kon Park, J. Carbohydr Polym. 2013, 98, 1585-1598.
- Gea, S.; Billoti, E.; Reynolds, C.T.; Soykeabkeaw, N.; Peijs, T. Mater. Lett. 2010, 64, 901-904.
- Moon, R. J.; Martini, A.; Nairn, J.; Simonsen, J.; Youngblood, J. Chem. Soc. Rev. 2011, 40, 3941-3994.
- Zhao, J.; He, X.; Wang, Y.; Zhang, W.; Zhang, X. Carbohydr. Polym. 2014, 104, 143-150.
- Cozzolino, C. A.; Campanella, G.; Ture, Hasan.; Olsson, R. T.; Farris, S. Carbohydr. Polym. 2016, 143, 179-187.
- Mishra, S.; Pal, S. J. o Non Crys. Solids. 2018, 500, 249-259.
- Kumar, T. S. M.; Rajini, N.; Reddy, K. O.; Rajulu, A. V.; Siengchin, S.; Ayrilmis, N. Int. J. Biol. Macromol. 2018, 122, 1310-1315.
- Vanitjinda, G.; Nimchua, T.; Sukyai, P. Int. J. of Biological Macromolecules. 2019, 122, 503-516.
- Khai, D. M.; Nhan, P. D.; Hoanh, T. D. Vietnam J. of Sci. and Tech. 2017, 55, 452-460.
- Xiong, R.; Han, Y.; Wang, Y.; Zhang, W.; Zhang, X.; Lu, C. Carbohydr. Polym. 2014, 113, 264-271.
- Jaganathan, G.; Manivannan, K.; Lakshmanan, S.; Aithique, M. A. Sustain. Chem. and Pharm. 2018, 10, 27-32.
- Elanthikkal, S.; Gopalakrishnapanicker, U.; Varghese, S.; Guthrie, J. T. Carbohydr. Polym. 2010, 80, 852-859.
- Harini, K.; Ramya, K.; Sukumar, M. Carbohydr. Polym. 2018, 201, 329-339.
- Wang, Y.; Chen, L. Carbohydr. Polym. 2011, 83, 1937-1946.

This work is licensed under a Creative Commons Attribution 4.0 International License.
![]()
A New Edition of Web of Science
Journal Impact Factor
2022: 0.5
Five Year: 0.8
Journal is Indexed in

Cabells Whitelist
![]()


