Atalantia Monophylla Acted as Eco-Friendly Inhibitor for Mild Steel in 1N HCl Media
R. Jeevitha1, M. J. Judithaa1, T. Sunder Selwyn2 and A. P. Srikanth*1
1Department of Chemistry, Government Arts College (Autonomous), Coimbatore-18, TN, India.
2Principal, Prince Dr. K. Vasudevan College of Engineering and Technology, Chennai, Tamil Nadu 600127, India.
Corresponding Author E-mail: apsrikanth8@gmail.com
DOI : http://dx.doi.org/10.13005/ojc/350321
Article Received on : 28-03-2019
Article Accepted on : 15-05-2019
Article Published : 18 Jun 2019
The eco-friendly inhibitor is used to safeguard the environment as well as the industrial equipments where corrosive acids are used for cleaning purposes. The inhibition ability of Atalantia monophylla leaves (AML) on the deterioration of mild steel (MS) in acid medium was investigated by mass loss and electrochemical techniques. The inhibition capability raised with rising the concentration of AML extract from weight loss method, immersion period and temperature studies. Electrochemical studies data explained in which AML inhibitor performed like cathodic and anodic type of inhibitor in corrosive medium. The adsorbed layer formed on the metal due to AML extract fulfilled the Langmuir adsorption isotherm. The formation of the protective film on the MS surface was acknowledged by SEM, EDS and FTIR. All the techniques proved AML as acceptable corrosion inhibitor in 1N HCl medium.
KEYWORDS:Atalantia Monophylla Leaves; AML Extract; FTIR; Mild Steel; SEM-EDS
Download this article as:| Copy the following to cite this article: Jeevitha R, Judithaa M. J, Selwyn T. S, Srikanth A. P. Atalantia Monophylla Acted as Eco-Friendly Inhibitor for Mild Steel in 1N HCl Media. Orient J Chem 2019;35(3). |
| Copy the following to cite this URL: Jeevitha R, Judithaa M. J, Selwyn T. S, Srikanth A. P. Atalantia Monophylla Acted as Eco-Friendly Inhibitor for Mild Steel in 1N HCl Media. Orient J Chem 2019;35(3). Available from: https://bit.ly/2FgufhH |
Introduction
The degradation of metal with their surroundings is called as corrosion. Mild steel is mostly used for industrial purposes because of their low cost.1-4 Using MS in acid medium caused corrosion which might contaminate the products manufactured. The acids were used in industries for various processes such as derusting and descaling.5-6 Inhibitors at present play an important role in MS protection against corrosion in acid medium.1-4 To escape from the undesirable alloy dissolution, inhibitors were added to HCl solution.5-6 Corrosion inhibitors were chemical compounds, when small quantity was added to fluid phase, protects the metal surface. The word “ecofriendly corrosion inhibitors” were talking about the compounds that are bio compatible, because these were organic origin. They were not affecting health and the environment in contending corrosion.7-15 The purpose of the work was to analyse the inhibition effect of Atalantia monophylla on the MS specimen in acid medium. Corrosion resistance was studied using various methods.
Materials and Method
Preparation of the Specimens
A large sheet of mild steel of about 0.1 cm thickness was press cut into pieces using a machine. The MS specimen mainly containing iron of about 99.62 %, C and Mn are about 0.25 % and 0.176 % and remaining elements constituents about 0.025 % was used for present corrosion studies. The area of the specimen was about 5*2*.1 cm (1cm2). The impurities were removed using emery sheet, cleaned with doubly distilled water and finally ungreased with acetone.
Preparation of Plant Extracts
The newly plucked leaves of Atalantia monophylla were cleaned, dried at 30°C. The dehydrated leaves were crushed well. 25 g of these crushed leaves were mixed with 500 mL of doubly distilled water and boiled for 3 hours. After that, solution was refluxed overnight. The extract was filtered and the filtrate was diluted to 500 mL which was used for further corrosion studies.16
Weight Loss Measurement
Weight loss measurement was conducted by submerging the MS specimen vertically inorder to evaluate the IE as well as CR. The experiment was carried out for 24 hours with and without the inhibitor. The various immersion period (1, 3, 5, 7, 24 hrs) and corrosion inhibition studies were also carried out at various temperature ranges of (313-353 K). Inhibition efficiency and corrosion rate were calculated using this formula,
Where, the value of constant K is found to be 8.76×10⁴ , D is the density in which the value is 7.86 gm/cm3, W is the weight loss in grams and A is the area in cm2.
The formula used to calculate the inhibition efficiency (%) was,
Where, Wi and W0 are the weight loss of the metal with and without the inhibitor.17
FTIR Analysis
FTIR spectra was analysed using Bruker ALPHA 8400 S spectrophotometer. The pellets were made using KBr and the spectra obtained was used to identify the functional groups present in the plant.
Potentiodynamic Polarization Method (PDP)
The electrochemical analyser was used to carry over the Potentiodynamic polarization measurements. The working electrode (MS) was coated with Teflon. Counter electrode and reference electrode were platinum and saturated calomel electrode dipped in 1N HCl solution and OCP was reached after 30 min. The polarization curves for MS specimens in the presence and absence of the inhibitor were reported at scan rate of 1 mVs-1 potential condition.18 The IE% was determined by using the formula,

Where, Icorr (blank) as Current density with blank, Icorr (Inhibitor) as Current density with inhibitor.
Electrochemical Impedance Method (EIS)
The impedance method was performed as such PDP studies expressed above. The real (Z’) and imaginary (Z”) part were deliberated at different frequency range of 100 KHZ to 10 MHZ. The graph was plotted at Z’ vs Z”. The charge transfer resistance (Rct) were calculated from plot. The double layer capacitance (Cdl) were calculated using this formula,19
Surface Investigation
SEM and EDS were used to check out the surface morphological conversion of MS immersed in the inhibited and uninhibited acid solution. The MS surface which was made into a shiny surface before immersion in the test solution for one day. The MS stripes were rinsed with deionised water, dried and tested for their surface morphology and energy dispersive spectra [EDS] using Scanning electron microscopy.20
Phytochemical Screening
Various tests were carried out so as to find out the secondary metabolites present in the plant extract. The various constituents tested includes Alkaloids, Phenolic compounds, Saponins, Tannins etc.
Result and Discussion
Weight Loss Measurement
Weight loss was a simple and common method, generally used for identifying corrosion of metal in the disposed medium. Inhibition efficiency and corrosion rate from immersion time and various temperature studies were tabulated in Table 1 & 2. It was explained from the table that the existence of phytochemical constituent in the plant extract were observed as a huge molecule to screen a wide surface area on adsorption. In the metal surface, the corrosion inhibitor acted as an adsorbing agent. But in temperature studies the IE declined with enhancing the temperature which expressed the inhibitor coated is having the defensive character at greater degree on account of desorption of the phytochemicals.21-25 This concluded that the plant extract is performed as a most potential anticorrosive properties.
Table 1: Inhibition efficiency of AML extract in various immersion time.
|
Conc. of AML (mL) |
Inhibition efficiency (%) |
||||
|
1h |
3h |
5h |
7h |
24h |
|
|
5 |
75.8 |
61.13 |
73.02 |
38.03 |
95.35 |
|
10 |
83.2 |
67.88 |
78.97 |
47.64 |
96.80 |
|
15 |
84.7 |
69.61 |
79.64 |
49.46 |
97.67 |
|
20 |
86.6 |
74.72 |
82.93 |
59.72 |
97.96 |
|
25 |
87.4 |
77.28 |
85.22 |
61.85 |
98.19 |
Table 2: Inhibition efficiency and corrosion rate of AML extracts at various temperatures.
|
Conc. of AML(mL) |
313K |
323K |
333K |
343K |
353K |
|||||
|
CR (mmpy) |
IE (%) |
CR (mmpy) |
IE (%) |
CR (mmpy) |
IE (%) |
CR (mmpy) |
IE (%) |
CR (mmpy) |
IE (%) |
|
|
Blank |
328.77 |
* |
775.97 |
* |
3184.6 |
* |
3760.0 |
* |
6071.25 |
* |
|
5 |
222.90 |
32.20 |
154.63 |
80.07 |
365.0 |
88.53 |
660.34 |
82.43 |
355.24 |
94.14 |
|
10 |
156.30 |
52.74 |
143.49 |
81.50 |
281.41 |
91.16 |
397.04 |
89.44 |
239.61 |
96.05 |
|
15 |
136.52 |
58.47 |
128.16 |
83.48 |
215.93 |
93.21 |
338.53 |
90.99 |
220.11 |
96.37 |
|
20 |
135.13 |
58.89 |
115.62 |
85.09 |
162.99 |
94.88 |
295.34 |
92.14 |
139.31 |
97.05 |
|
25 |
132.34 |
59.74 |
112.84 |
85.45 |
130.95 |
97.20 |
256.33 |
93.18 |
122.59 |
97.98 |
FTIR Measurements
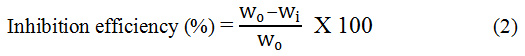
The FTIR spectroscopy was not at all able to confirm the predominant structure of the inhibitor, but expecting what type of generous functional group was present. The crucial IR absorption bands of inhibitors were specified in Fig 1. For AML, bands at 3394.72 cm-1 could be designated to O-H (or) N-H groups. The absorption band at 2924.09 cm-1 was due to C-H str. frequency. The peak observed at 1739.79 cm-1 might be C=O (Aldehyde or ketone) group. The C=C (or) C=N str. frequencies were arrived at 1627.92 cm-1. The peak at 1458 cm-1 was due to C-H bending group. The peaks below 1000 cm-1 were due to aliphatic C-C, C-H group. The occupancy of all these groups revealed that the plant extract acted as an excellent inhibitor by the way of the absorption or protective layer developed on the metal surface.26,27
 |
Figure 1: FTIR spectrum of AML. |
Potentiodynamic Polarization Method (PDP)
The tafel curves of potentiodynamic polarization of MS in 1N HCl of inhibited and uninhibited by the extract were shown in Fig.2 and the values were summarized in table 3. The corrosion parameter were shown in table 3. It was evident that there would be lowering of Icorr by raising the concentration of the inhibitor. The highest IE% was noticed at 20 mL of AML extract. This proved that the extract acted as mixed type of corrosion inhibitor.28
Table 3: The various parameters of PDP for AML extract.
|
Conc. of AML (mL) |
Ecorr (mV) vs (SCE) |
Icorr (mA/cm2) |
CR (mmpy) |
bc (mV/dec) |
ba (mV/dec) |
IE (%) |
|
Blank |
-485 |
2.804 |
1.280 |
189 |
130 |
* |
|
5 |
-485 |
0.5974 |
0.2728 |
171 |
105 |
78.69 |
|
10 |
-474 |
0.3486 |
0.1592 |
153 |
89 |
87.56 |
|
15 |
-484 |
0.3334 |
0.1522 |
162 |
95 |
88.10 |
|
20 |
-485 |
0.2319 |
0.1059 |
155 |
128 |
91.72 |
|
25 |
-485 |
0.2393 |
0.1093 |
159 |
116 |
91.46 |
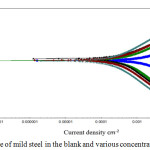 |
Figure 2: Tafel slope of mild steel in the blank and various concentration of AML extract. |
Electrochemical Impedance Method (EIS)
The Nyquist interpretation conducted on MS in 1N HCl inhibited and uninhibited were shown in Table 4. and Fig 3. It was detected that the Rct values had improved, the Cdl values had reduced with rise in concentrations of AML extract. Due to the increasing value of Rct, these might be decrease and increase of dielectric constant and thickness of electrical double layer concluded the deposition of protective film on the MS specimen. The charge transfer resistance improved the anticorrosive nature of MS specimen. By increasing the concentration of the extract the diameter of the semicircle fully developed. The phytochemicals present in the inhibitor got adsorbed on the surface of the metal was thus proved by the reduction in the double layer capacitance values. Besides, the restoration of aquatic fragments on the MS surface combined with the organic inhibitor might be caused by the reduced Cdl values. The semi-circle arch of impedance expressed that the deterioration of MS specimen was mostly composed by charge transfer process.29
Table 4: Measurement of impedance with blank and various concentrations of plant extract in 1N HCl.
|
Conc. of AML (mL) |
Cdl (μF cm-2) |
Rct Ω cm2 |
IE (%) |
|
Blank |
3.833×10⁻⁵ |
7.937 |
* |
|
5 |
2.839×10⁻⁵ |
21.09 |
62.37 |
|
10 |
3.759×10⁻⁵ |
27.1 |
70.71 |
|
15 |
3.152×10⁻⁵ |
28.94 |
72.57 |
|
20 |
3.473×10⁻⁵ |
56.56 |
85.97 |
|
25 |
3.703×10⁻⁵ |
51.04 |
84.44 |
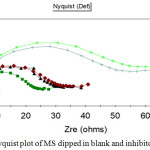 |
Figure 3: Nyquist plot of MS dipped in blank and inhibitor. |
From the bode plot it was revealed that there was a raise in the phase angle proved the inhibiting character of the plant extract. This could be shown in the Fig.4.30
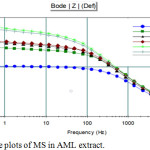 |
Figure 4: Bode plots of MS in AML extract. |
Surface Analysis Study
SEM Analysis
The SEM image in Fig (5a) showed that the surface of MS was deeply corroded without the inhibitor, but Fig (5b) evidently showed that the active sites of MS surface were blocked by AML extract, formed as a layer on MS surface. It was subjected for the corrosion inhibition.31
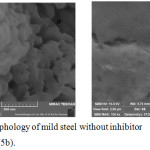 |
Figure 5: SEM morphology of mild steel without inhibitor (5a) with inhibitor (5b). |
EDX Analysis
The elemental distribution on the MS specimen could be explained with the help of EDX analysis which was shown in Fig.6 in inhibited and uninhibited solution after 24 hours of holding was given in table.5. It was pointed out that the Fe peaks were substantially restrained in the blank solution correlated to inhibited MS plane. By correlating the 1N HCl solution with the optimum concentration (25 mL) of the plant extract, it was found that the atomic oxygen content was only slight change, expressed that only limited destruction had taken place due to the evolution of defensive coating of inhibitor. Peaks for Niobium (Nb) was detected in the presence of inhibitor which was not present in 1N HCl was conspicuous that defensive coating of AML extract was formed.32,33
Table 5: Element composition (Atomic %) of MS stripes with and without the inhibitor.
|
Inhibitors/elements |
C |
O |
Fe |
Cl |
Nb |
|
Mild steel in 1N HCl |
9.25 |
71.55 |
15.60 |
3.60 |
– |
|
Mild Steel in AML extract |
11.16 |
69.80 |
18.51 |
– |
0.53 |
 |
Figure 6: (6a) mild steel uninhibited, (6b) mild steel inhibited with plant extract. |
Adsorption Isotherm
It is defined as the adsorption of the plant inhibitor on the metal surface. The Langmuir adsorption isotherm was applied by using this equation,
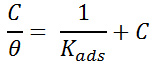
Where, C represents the concentration of the extract, θ is meant for surface coverage and Kads is indicating adsorption equilibrium constant.
A graph was plotted between C/θ vs C which was a straight line, proved that the adsorption of phytochemical constituent on the mild steel has taken place.
The correlation coefficient (R2) values ate tailored in Langmuir adsorption isotherm. The R2 values from 0.9802 to 0.999 for 313 K to 353 K. The straight line obtained in the graph and R2 values are coinciding with Langmuir adsorption isotherm model.34
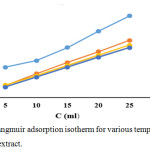 |
Figure 7: Langmuir adsorption isotherm for various temperatures with AML extract. |
Phytochemical Analysis
Phytochemical screening was tested by the aqueous extract to the ordinary phytochemical method derived by Harborne.35 The AML extract inhibited the corrosion process due to the existence of some chemical constituent such as Alkaloids, Carbohydrate, Triterpenoids, Phenolic compounds, Flavonoids, Saponins and Tannins.
Table 6: Phytochemical screening of AML extract.
|
Phytochemical Test |
AML extract |
|
Alkaloids |
+ |
|
Carbohydrates |
+ |
|
Triterpenoids |
– |
|
Phenolic compounds |
+ |
|
Flavanoids |
+ |
|
Saponins |
+ |
|
Tannins |
+ |
(+) Presence (-) Absence
Conclusion
The AML extract acted as good and effective anti-corrosive agent for MS in acid medium by mass loss and electrochemical studies. The corrosion rate is decreased with increase of concentration of AML extract. The inhibitor obeys the Langmuir adsorption isotherm. FTIR results reveals that it is an excellent inhibitor by the way of the absorption or protective layer developed on the metal surface. PDP studies referred it as a mixed type of inhibitor. The SEM and EDS study revealed the formation of protective layer on MS specimen had shown highly the inhibitive effect of the inhibitors.
Acknowledgements
The researchers are thankful to their management and Dr.A.P.Srikanth, Assistant Professor in PG and Research Department of Chemistry, Government Arts College (Autonomous), Coimbatore, for providing his valuable ideas and moral support for their work. We thank The Management, Principal and All the Faculty Members of Chemistry (S & H) PSG College of Technology, Peelamedu, Coimbatore and Avinashilingam Institute for Home science and Higher Education for Women, Coimbatore, for their Moral Support.
Conflict of Interest
There is no conflict of interest.
References
- Fouda, A.S.; Diab, M.A.; Fathy, S. Int. J. Electrochem. Sci. 2017, 12, 347–362.
- Tribak, Z.; Kandri Rodi, Y.; Elmsellem, Y. H.; Abdel-Rahman, I.; Haoudi, A.; Skalli, M. K.; Kadmi, Y.; Hammouti . B, Ali Shariati, M.; Essassi, E. M. J. Mater. Env. Sci. 2017, 8(3), 1116-1127.
- Nnabuk, O.; Eddy, O.; Yahaya, H. M.; Oguzie, E. E. J. Adv. Res. 2015, 6(2), 203-217.
- Ezhilarasi, M. R.; Prabha, B.; Santhi, T. J. Chem. Sci. 2015, 5(5),1-12.
- Hussin, M H.; Kassim, M J.; Razali, N N.; Dahon, N H.; Nasshorudin, D. Arabian Journal of Chemistry, 2011 (press) doi:10.1016/j.arabjc.2011.07.002.
- Eddy, N. O. Portugaliae Electrochimica Acta. 2009, 27(5), 579-589.
- El-Etre, A. Y. Materials Chemistry and Physics. 2008, 108(2-3), 278-282.
- AmithaRani, B.; Basu, B. International Journal of Corrosion. 2012, 4(4), 178.
- Oafor, P.; Ebenso, E.; Ekpe, U. Int. J. Electrochem. Sci. 2010, 5, 978.
- Dahmani, M.; Et-Touhami, A.; Al-Deyab, S.; Hammouti, B.; Bouyanzer, A. Int. J. Electrochem. Sci. 2010, 5, 1060.
- Noor. E. Int. J. Electrochem. Sci. 2007, 2, 996.
- Abdel-Gaber, A.; Abd-El-Nabey, B.; Saadawy, M, Corros. Sci. 2009, 51, 1038.
- da Rocha, J.; da Cunha Ponciano Gomes, J.; D’Elia, E. Corros. Sci. 2010, 52, 2341.
- Kanojia, R.; Singh, G. Surf. Eng. 2005, 21, 180.
- Ostovari, A.; Hoseinieh, S.; Peikari, M.; Shadizadeh, S.; Hashemi, Corrosion Science. 2009, 51, 1935–1949.
- Mesbah, A.; Juers, C.; xLocouture, C.; Mathieu, S.; Rocca, E.; Francois, M.; Steinmetz, J. J.Solid state sci. 2007, 9, 322-328.
- Sivakumar, P. R.; Srikanth, A. P.; Muthumanikam, S. International Journal of ChemTech Research. 2017, 12, 386-398.
- Karuppusamy, M.; Sivakumar,P.R.; Perumal,S.; Elangovan,A.; Srikanth, A. P. J. Environ. Nanotechnol. 2015, 4(2), 09-15.
- Sivakumar, P. R.; Vishalakshi, K.; Srikanth, A. P. Journal of Applicable Chemistry. 2016, 5 (5), 1080-1088.
- Sunday, O.; Ajeigbe1; Norazah Basar; Muhammad, A.; Hassan; Madzlan Aziz. ARPN Journal of Engineering and Applied Sciences, 2017, 12 (9), 2763-2771.
- Raja, P.B.; Rahim, A.A.; Osman, H.; Awang, K. Physico chimica sinica. 2010, 26, 2171-2176.
- Sarmila, A.; Prema, A.A.; Sahayaraj, P.A. Rasayan J Chem, 2010, 3, 74-81.
- Velazquez-Gonzalez, M. A.; Gonzalez-Rodriguez, J. G.; Valladares-Cisneros, M. G.; Hermoso-Diaz, I.A. Amer J Anal Chem, 2014, 5, 55-64.
- Ehteram Noor, A. J Appl Electro chem. 2009, 39, 1465-1475.
- Patel, N.S.; Jauhariand, S.; Mehta, G.N.; Al-Deyab, S.S.; Warad. I.; Hammouti, B. Int J. Electro chem Sci. 2013, 8, 2635-2655
- Sivakumar, P.R.; Srikanth, A.P. Asian Journal of Chemistry. 2018, 30( 3), 513-519.
- Ghadah, M.; Al-senani.; sameerahi.; Al-saeedi.; rasmiahalmufarij. Oriental journal of chemistry, 2015, 31 (4), 2077-2086.
- Ajmal, M.; Mideen, A.; Quraishi, M. Corros Sci. 1994, 36,79–84.
- Subbaian Aejitha, P K.; Kasthuri, P.; Geethamani, P. Che Sci Rev Lett. 2014, 2(7), 566–573.
- Sivakumar, P. R.; Karuppusamy, M.; Jeevitha, R.; Judithaa, M. J.; Srikanth, A. P. Journal of Applicable Chemistry. 2019, 8 (1), 366-374.
- Rosaline, J.; Vimala.; Leema Rose, A.; Raja, S. Der Chemica Sinica. 2012, 3(3), 582-588.
- Nnaji, N J.; Obi-Egbedia, N O.; Nnabugwu M A. Int J Chem Sci. 2012, 10(1), 182–194.
- Umoren, S A. J Adhes Sci Technol. 2016, 30 (17), 1858–1879.
- Olusegun, S. J.; Oluwasina, O. O.; Alaneme, K. K.; Olubambi, P. A. J. Mater. Environ. Sci. 2016, 7(4), 1086-1097.
- Harborne, J.B. Phytochemical Methods. A guide to modern techniques of plant analysis, Chapman and Hall, London (1998).

This work is licensed under a Creative Commons Attribution 4.0 International License.
![]()
A New Edition of Web of Science
Journal Impact Factor
2022: 0.5
Five Year: 0.8
Journal is Indexed in

Cabells Whitelist
![]()


