Visible Spectrophotometric Determination of Gemigliptin using Charge Transfer Complex
Giri Prasad Gorumutchu1, Venkata Nadh Ratnakaram*2 and Kishore V. N. V3
1Department of Chemistry, Acharya Nagarjuna University, Nagarjuna Nagar-522510, India.
2GITAM University – Bengaluru, Karnataka-562163, India.
3Department of Chemistry, AG and SGS College, Vuyyuru-521165, India.
Corresponding Author E-mail: doctornadh@yahoo.co.in
DOI : http://dx.doi.org/10.13005/ojc/350226
Article Received on : 09-12-2018
Article Accepted on : 09-02-2019
Article Published : 18 Apr 2019
A visible spectrophotometric method was developed and validated for the determination of gemigliptin present in bulk drug and tablet formulation. It involves an indirect method of charge transfer complex formation in presence of NBS, metol and suphanilic acid. Gemigliptin was subjected to oxidation with excess amount of oxidant (NBS) and the unconsumed NBS oxidizes metol to give p-N-methylbenzoquinone monoamine (PNMM) which in turn forms a charge transfer complex with sulphanilic acid. Then validated the above developed method as per the current ICH guidelines. An excellent correlation coefficient (> 0.999) was found for the obtained regression equation (y = –0.0302x + 0.928) in the range of 2.0–30.0 μg mL-1. The method was found to be simple and rapid because it does not involve any solvent extraction. The recovery levels of the drug were in the range 99.92 – 100.08.
KEYWORDS:Charge Transfer Complex; Determination; Gemigliptin; Metol; Validation
Download this article as:| Copy the following to cite this article: Gorumutchu G. P, Ratnakaram V. N, Kishore V. N. V. Visible Spectrophotometric Determination of Gemigliptin using Charge Transfer Complex. Orient J Chem 2019;35(2). |
| Copy the following to cite this URL: Gorumutchu G. P, Ratnakaram V. N, Kishore V. N. V. Visible Spectrophotometric Determination of Gemigliptin using Charge Transfer Complex. Orient J Chem 2019;35(2). Available from: https://bit.ly/2Gxq02t |
Introduction
Gemigliptin is a selective, competitive and potent anti-hyperglycemic agent which is useful in the treatment of type 2 diabetes. It belongs to DPP-4 (dipeptidyl peptidase-4) inhibitor class.1 Secretion of glucagon is decreased by it. Either as a monotherapeutic agent or in combination with metformin, it is effective.2 It is administered orally. C18H19F8N5O2 is the molecular formula and molecular weight is 489.36. (3S)-3-amino-4-(5,5-difluoro-2-oxopiperidino)-1-[2,4-di(trifluoromethyl)-5,6,7,8-tetrahydropyrido[3,4-d]pyrimidin-7-yl]butan-1-one (Figure 1) is its IUPAC name. At initial stages, it was developed by LG Life Sciences (LGLS) and later Double-Crane Pharmaceutical Company joined for the development of final product. It was marketed together in china. License was issued to Stendhal (Mexico) and Sanofi (Paris) to market it in 104 countries. Gemiglo® and LC-150444 are the other names of it.3
Literature survey reveals that HPLC-Isocratic4-5 and LC/MS-MS6 methods were developed for the assay of gemigliptin. However, visible spectrophotometric method was not proposed. Hence, a visible spectrophotometric method is developed and validated in the present study for the determination of gemigliptin with the help of a chromogen like metol.
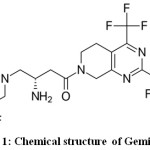 |
Figure 1: Chemical structure of Gemigliptin. |
Material and Methods
Preparation of Standard Gemigliptin Solution
The standard drug of gemigliptin (50 mg) was weighed accurately and transferred to 50 mL volumetric flask. It was dissolved properly and diluted up to the mark with methanol to obtain a final concentration of 1000 µg mL–1 (stock solution). This solution was further diluted suitably.
Metol (0.2%): 200 mg of metol (N-methyl-p-aminophenol) was dissolved in 100 mL water.
Sulphanilic acid (0.2%): 200 mg of sulphanilic acid was dissolved in 100 mL water.
Buffer (pH 1.5): Equal volumes of hydrochloric acid (one normal) and sodium acetate (one normal) were mixed and pH was adjusted to 1.5 with variation of either of them.7
N-bromosuccinimide (1 mg mL-1): About 0.5 grams of NBS was dissolved in hot water. After filtration the solution was made up to mark in 250 mL volumetric flask to get ~ 0.01M NBS solution. Then standardised the solution by iodometry.8 It was diluted appropriately to obtain a working solution of 1 mg mL-1. The solution was stored in a refrigerator.
Recommended Analytical Procedure
The important step in the present study is the fixation of upper concentration limit of oxidant. It was established by the treatment of various concentrations of oxidant with metol as well as sulphanilic acid. Into a sequence of 10 mL volumetric flasks, transferred different aliquots (0.2 – 3.0 mL) of standard gemigliptin solution (100 µg mL-1) with the help of a micro burette. Then diluted to 3 mL by the addition of water. Then added one mL each of buffer (pH 1.5) and NBS (1 mg mL-1) using micro burettes. Mixed the contents well and kept aside for about ten minutes with occasional shaking. In a sequence, added one mL each of metol (0.2%) and sulphanilic acid (0.2%) with a time gap of one minute. Made up to the mark with water and shaken well. Measured the absorbance against blank at 631 nm after 10 minutes but before 90 minutes.
Chemicals and Instrumentation
Analytical grade chemicals were used throughout the study and solutions were prepared using distilled water. A double beam spectrophotometer (Shimadzu UV-1700) was used along with Shimadzu UV-Probe 2.10 software. Standard quartz cuvettes were used for analysis.
Results and Discussion
Chromophore Formation and Chemistry
Out of the various reactions involved in spectrophotometric assay of pharmaceutical drugs, charge transfer reaction is proved to be highly sensitive as well as acceptable method, in addition to reactions involving to ion pair9-15 and oxidation.16-20 The complex formed between electron donor and acceptor compound yields a new absorption band with a precise λmax pertaining to that complex. The reaction between oxidized form of metol and pharmaceutical drugs forms n–π* charge transfer complex.21 In general the oxidized form of metol (N-methyl-p-aminophenol sulfate) acts as π- acceptor and forms a chromophore with primary aromatic amine containing drugs (n-donor) through a charge transfer reaction.21-24 According to Amin et al,25 a ternary complex is formed between oxidant, metol and primary aromatic amine. The amine involved in ternary complex felicitates the transfer of electrons between oxidant and metol. In acidic medium, the role of primary aromatic amine is evident from the accomplishment of reaction in its presence only.24 Literature survey shows that many drugs bearing nitro group were reduced to concerned amines and then allowed to form a charge-transfer complex with the oxidised form of metol.21,26-29 Similarly, Hydrolysis of amide group resulted in to corresponding amines and then allowed to react with oxidized form of metol.29
Formation of charge transfer complex between oxidized form of metol and drugs containing aromatic amine group can be adopted when the drug is not oxidizable.25 However, gemigliptin is easily oxidizable. Hence, an indirect method is adopted. In this method, a known amount of excess oxidant is added to gemigliptin in buffer medium where the drug is subjected to oxidation. The amount of unconsumed oxidant is determined by allowing it to interact with metol and sulphanilic acid, a primary aromatic amine. By the addition of gemigliptin in the order of increasing concentration to a fixed amount of oxidant, consumption of oxidant and hence, results in a consequent reduction in concentration of oxidant. Therefore, an increase of gemigliptin concentration causes a relative decrease in absorbance values. The mechanism involved in the present case corroborates with that of previous researchers.26,28,30-31 The plausible mechanism is shown in Fig. 2, which involves the in situ generation of p-N-methylbenzoquinone monoamine (PNMM) by the oxidation of metol. PNMM acts as an excellent electron acceptor and participates in the formation of a charge transfer complex with an electron donor like aromatic amines.
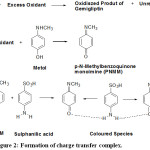 |
Figure 2: Formation of charge transfer complex. |
Simultaneous overlapping of orbitals of two PNMM molecules with a primary amine molecule is facilitated by the possible hydrogen which brings them closer. Formation of a charge transfer complex can be attributed to the transfer of electrons from HOMO (π) of aromatic primary amine to the LUMO (π*) of PNMM, the oxidized form of metol.32-33
The coloured charge transfer complex shows λmax at 631 nm and the absorption spectrum is shown in Fig.3.
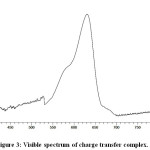 |
Figure 3: Visible spectrum of charge transfer complex. |
Validation of Method
Linearity and Range
An increase of gemigliptin concentration causes a decrease in concentration of unconsumed NBS leading a decrease in amount of formed PNMM. Hence, a decrease in absorbance was observed with an increase in gemigliptin concentration to give a linear curve with negative slope in the concentration range of 2.0 – 30.0 μg mL-1 (Table 1, Fig. 4). The obtained linear regression equation y = -0.0302x + 0.928 possess a high correlation coefficient (> 0.999), indicating the linearity of the proposed method for determination of gemigliptin. Different parameters (optical and regression) are listed out in Table 2.
Table 1: Calibration values of gemigliptin.
|
Concentration (µg mL-1) |
Absorbance* |
|
2.0 |
0.8822 |
|
5.0 |
0.7728 |
|
10.0 |
0.6124 |
|
20.0 |
0.3248 |
|
25.0 |
0.1688 |
|
30.0 |
0.0312 |
*Average of three determinations.
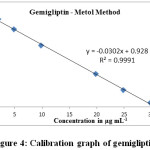 |
Figure 4: Calibration graph of gemigliptin. |
Table 2: Optical, regression and validation parameter values.
|
S. No. |
Parameter |
Observation |
|
Optical characteristics |
||
|
1. |
Apparent molar absorptivity (l mol-1 cm-1) |
1.5 × 10⁴ |
|
2. |
Sandell’s sensitivity (µg cm–2A-1) |
0.0317 |
|
Regression analysis |
||
|
1. |
Slope |
-0.0302 |
|
2. |
Intercept |
0.928 |
|
3. |
Regression coefficient (r) |
0.9991 |
|
Validation parameters |
||
|
1. |
λmax (nm) |
631 |
|
2. |
Beer’s Law Limit (Linearity, μg mL-1) |
2.0 – 30.0 |
|
3. |
Limit of detection (μg mL-1) |
0.010 |
|
4. |
Limit of quantitation (μg mL-1) |
0.033 |
|
5 |
Stability period (min) |
90 |
Accuracy
Accuracy of the current method was confirmed by determining % recovery values. In order to study various recovery levels at 50%, 100% and 150%, different amounts of gemigliptin (4.0, 8.0 and 12.0 µg mL-1) respectively were added to a nominal amount of (8.0 µg mL-1). Table 3 shows that 99.92 – 100.08 is range of % recovery values. Low values for SD and %RSD reveal the acceptable level of accuracy.
Table 3: Recovery of gemigliptin.
|
Level of recovery (%) |
Amount of drug recovered (µg mL-1) (Practical) |
Statistical evaluation
|
% Recovery = Practical x 100/ Theoretical |
|
|
50 |
12.01 |
Mean |
12.00 |
100.08 |
|
11.99 |
SD |
0.008 |
99.92 |
|
|
12.00 |
%RSD |
0.068 |
100.00 |
|
|
100 |
15.98 |
Mean |
15.99 |
99.88 |
|
15.99 |
SD |
0.012 |
99.94 |
|
|
16.01 |
%RSD |
0.077 |
100.06 |
|
|
150 |
20.00 |
Mean |
20.00 |
100.00 |
|
20.01 |
SD |
0.008 |
100.05 |
|
|
19.99 |
%RSD |
0.040 |
99.95 |
|
Nominal concentration used (a): 8.0 µg mL-1
Amount of drug added (b): 4.0, 8.0 and 12.0 µg mL-1 respectively for 50%, 100% and 150% recovery levels.
Theoretical amount: Total amount of drug (a + b) = 12.0, 16.0, 20.0 µg mL-1 respectively for 50%, 100% and 150% recovery levels.
Precision
Precision studies (intraday as well as inter-day) were studied by selecting three diverse gemigliptin concentrations in the linearity range (2.0 – 30.0 μg mL-1). Table 4 shows the compilation of the six values measured each on the same day as well as successive days. Since the %RSD values are within tolerable limit (below 1%), the current method is validated in terms of both for intraday and inter-day precision studies.
Table 4: Precision data.
|
Concentration |
Concentration* |
|||
|
Intraday (Mean ± SD) (μg mL-1) |
% RSD |
Inter-day (Mean ± SD) (μg mL-1) |
% RSD |
|
|
14.98 |
14.981±0.002 |
0.013 |
14.988±0.0021 |
0.014 |
|
20.01 |
20.012±0.005 |
0.025 |
20.018±0.053 |
0.265 |
|
30.02 |
30.028±0.008 |
0.027 |
30.028±0.084 |
0.280 |
*Average of six determinations.
Ruggedness
Three dissimilar gemigliptin concentrations were chosen with in the linearity range (2.0 – 30.0 μg mL-1) by two separate analysts on different days to carry out the experiments. The reproducible assay values are the evidence for ruggedness of the proposed method (Table 5).
Table 5: Ruggedness data.
|
Test Concentration of Drug (μg mL-1) |
Concentration* |
|
|
Analyst change |
||
|
Mean ± SD (μg mL-1) |
% RSD |
|
|
14.98 |
14.981±0.038 |
0.254 |
|
20.01 |
20.018±0.055 |
0.275 |
|
30.02 |
30.028±0.062 |
0.206 |
Detection Limits Determination
Signal to noise ratio values were used to calculate both the limits for quantification as well as detection.30 LOQ as well as LOD for gemigliptin determination using the current method was done using values of S (calibration curve slope) and σ (response standard deviation).31
LOD = 3.3 × σ /S = 0.010 μg mL-1 and
LOQ = 10 × σ /S = 0.033 μg mL-1
Pharmaceutical Formulations Analysis
API present in tablet formulation (ZEMIGLO®) was extracted by sonnicating for a period of 10 minutes in presence of methanol. The above developed method was adopted to determine the API amount (Table 6). As visible spectrophotometry is preferred one in QC laboratories of developing countries,36-37 current method can be implemented for routine assay of gemigliptin in pure and tablet formulations.
Table 6: Assay of Pharmaceutical Formulation.
|
Formulation |
Labeled amount (mg) |
Amount found* (mg) |
% Drug Recovered |
%RSD |
|
ZEMIGLO® |
50 |
50.0128±0.0036 |
100.03 |
0.007 |
*Average of three determinations.
Conclusions
An indirect method of charge transfer complexation was successfully applied for the determination of gemigliptin. The proposed method was validated as per the existing guidelines of ICH. Being a substitute to the other expensive and sophisticated instrumental methods involving HPLC / LCMS-MS, current method can be adopted for routine assay of gemigliptin (bulk drug and tablet formulation) in quality control laboratories.
References
- Lim, K.S.; Kim, J.R.; Choi, Y.J.; Shin, K.H.; Kim, K.P.; Hong, J.H.; Cho, J.Y.; Shin, H.S.; Yu, K.S.; Shin, S.G.; Kwon, O.H. Clinical therapeutics. 2008. 30(10), 1817-1830.
- Kim, S.H.; Lee, SH.; Yim, H.J. Arch. Pharm. Res. 2013, 36: 1185. https://doi.org/10.1007/s12272-013-0171-x
- Kim, S.H.; Yoo, J.H.; Lee, W.J.; Park, C.Y. Diabetes metab. j. 2016. 40(5), 339-353.
- Shailesh, V.L.; Kajal, R.P.; Jani, G.K.; Sachin, B.N. J. Pharm. Sci. Bioscientific. Res. 2016, 6(3), 338-346.
- Krishna Y.; Kedhareshwari, R.; Harikha, Y.; Harikrishna, V.; Gopi, M.K. J. Pharm. Biomed. Anal. 2016, 4(2), 93–99.
- Shailesh, V.L.; Harshi, A.P.; Jani, G.K.; Malairajan, P. European j biomed pharm. 2017, 4, 488-501.
- European pharmacopoeia, 4.1.3. Monograph on Buffer Solutions 7.0. 2010, 2, 489-494.
- Berka, A.; Vulterin, J.; Zyoka, J. Newer Redox Titrants, Pargamon Press, New York, NY, USA., 1965.
- Prasad, G.G.; Nadh, R.V.; Kiran, K.K. Asian J. Pharm. Clinical Res., 2019, 12(3) 1-5. DOI:10.22159/ajpcr.2019.v12i3.29289
- Prasad, G.G.; Nadh, R.V. Int. J. Appl. Pharmaceutics., 2019, 11(1) 168-173. 10(1) 117-124. DOI: 10.26452/ijrps.v10i1.1787
- Kiran, K.K.; Nadh, R.V.; Nagoji, K.E.V. Oriental. J. Chem. 2013, 29(1), 263-269,
- Berka, A.; Vulterin, J.; Zyoka, J. Newer Redox Titrants, Pargamon Press, New York, NY, USA, 1965.
- Prasad, G.G.; Nadh, R.V.; Kiran, K.K. Int. J. Res. Pharm. Sci., 2019, 10(1).DOI:10.13005/ojc/290142.
- Kiran, K.K.; Nadh, R.V.; Nagoji, K.E.V. Oriental. J. Chem. 2014, 30(2), 905-10, DOI:10.13005/ojc/300272.
- Prasad, G.G.; Nadh, R.V.; Sireesha, M. Asian J. Pharm., 2018, 12 (4) (Suppl) S1390- S1396; DOI: 10.22377/ajp.v12i04.2940
- Prasad, G.G.; Nadh, R.V. Res. J. Pharm. Techn., 2019, 12(3).
- Prasad, G.G.; Nadh, R.V. Int. J. Green Pharm., 2018, 35(1) 363-369. http://dx.doi.org/10.13005/ojc/350145
- Prasad, G.G.; Nadh, R.V.; Sireesha, M. Oriental. J. Chem., 12(1); 2019, 209-212. DOI: 10.5958/0974-360X.2019.00038.6
- Prasad, G.G.; Nadh, R.V. Res. J. Pharm. Techn. 2019, 12(1).
- Sudhir, M.S.; Nadh, R.V. Oriental. J. Chem. 2013, 29(4), 1507-1514, DOI:10.13005/ojc/290429.
- Hadi, H. Iraqi J. Pharm. Sci. 2015, 24(1), 25-32.
- Unnisa, A.; Manasa, N.; Ravali, P.L. E-J. Chem. 2011, 8(4), 1815-1819.
- Prasad, U.V.; Rao, K.E.; Sastry, C.P. Food Chem. 1985, 17(3), 209-213.
- İslimyeli, S.; Üstün, M. Marmara Pharm. J, 1989, 5(1), 65-69.
- Amin, A.S.; Ragab, G.H. Spectrochimica Acta Part A: Mol. Biomol. Spectrosc. 2004, 60(12), 2831-2835.
- Sastry, C.S.P.; Aruna, M.; Rao, A.R.M. Talanta. . 1988, 35(1), 23-26.
- Al Bratty, M. Int. J. Pharm. Res. Allied Sci. 2016, 5(3), 157-163.
- Sastry, B.S.; Rao, J.V.; Rao, T.T.; Sastry, C.S. Mikrochim. Acta. 1992, 108(3-6), pp.185-193.
- Sastry, C.S.; Rao, T.T.; Sailaja, A.; Suryanarayana, M.V. Anal. lett. 1991. 24(6), 947-959.
- Basavaiah, K.; R Anil Kumar, U. E-J. Chem, 2007, 4(2), 173-179.
- Sastry, C.S.P.; Sailaja, A.; Rao, T.T.; Krishna, D.M. Talanta, 1992, 39(6), 709-713.
- Al-Abachi, M.Q.; Hadi, H. J. Al-Nahrain University-Sci. 2007, 10(2), 1-6.
- Sastry, C.P.; Rao, B.G.; Reddy, B.S. 1981. J. Anal. Chem. 1981, 305(5), 415-416.
- Sethi, P.D. HPLC quantitative analysis of pharmaceutical formulations, CBS publications, India. 2001.
- ICH guidelines, Validation of Analytical Procedures: Text and Methodology. 2015, Q2 (R1), 8-13
- Sudhir, M.S.; Nadh, R.V. Res. J. Pharm. Biol. Chem. Sci., 2013, 4(1), 609-617.
- Sudhir, M.S.; Mohan, P.M.; Nadh, R.V. Oriental. J. Chem. 2013, 29(1), 235-240. DOI:10.13005/ojc/290137

This work is licensed under a Creative Commons Attribution 4.0 International License.
![]()
A New Edition of Web of Science
Journal Impact Factor
2022: 0.5
Five Year: 0.8
Journal is Indexed in

Cabells Whitelist
![]()


