Optimization of Oil Production from Cassava Pulp and Sugarcane Bagasse using Oleaginous Yeast
Phakamas Rachamontree1, Malinee Sriariyanun2, Surapun Tepaamorndech3 and Issaraporn Somboonwatthanakul*1
1Department of Biotechnology, Faculty of Technology, Mahasarakham University, Kantarawichai, Maha Sarakham 44150, Thailand.
2Department of Mechanical and Process Engineering, The Sirindhorn International Thai-German Graduate School of Engineering (TGGS), King Mongkut's University of Technology North Bangkok (KMUTNB), Bangkok 10800, Thailand.
3Food Biotechnology Research Unit, National Center for Genetic Engineering and Biotechnology, Pathumthani, 12120 Thailand.
Corresponding Author E-mail: issaraporn.s@msu.ac.th
DOI : http://dx.doi.org/10.13005/ojc/350222
Article Received on : 06-02-2019
Article Accepted on : 03-04-2019
Article Published : 29 Apr 2019
Microbial oil is one of alternative sources for biofuel and value-added chemical production in biorefining process of lignocellulosic biomass. The bottleneck of this process is the low conversion rate of lignocellulose biomass to the target product. This research aims to optimize microbial oil production as raw material for biorefining process from agricultural waste by using Plackett–Burman (PB) design and Response Surface Methodology (RSM). Acid-hydrolysates of cassava pulp and sugarcane bagasse were converted to bio-oil by fermentation activities of two oleaginous yeasts, designated as MSU2 and Ka28. The fermentation parameters were screened by PB design to identify their impacts on oil yield, and the condition of each parameter was optimized by RSM to maximized oil yield. The predicted optimal condition obtained from RSM provided the highest lipid yield at 34.56 and 21.85% from hydrolysates of cassava pulp and sugarcane bagasse, respectively. Then, fatty acid compositions in oil were analyzed by GCMS, and our results demonstrated that palmitic acid and oleic acid were the major constituents at 72.95 and 195.01 mg/g-crude lipid, respectively. These fatty acid distribution profiles were suitable for application in biodiesel production and suggested the utilization of agricultural waste in biorefining process.
KEYWORDS:Agricultural Waste; Biorefinery; Biodiesel; Lignocellulosic Biomass; Microbial Oil; Oleaginous Yeast
Download this article as:| Copy the following to cite this article: Rachamontree P, Sriariyanun M, Tepaamorndech S, Somboonwatthanakul I. Optimization of Oil Production from Cassava Pulp and Sugarcane Bagasse using Oleaginous Yeast. Orient J Chem 2019;35(2). |
| Copy the following to cite this URL: Rachamontree P, Sriariyanun M, Tepaamorndech S, Somboonwatthanakul I. Optimization of Oil Production from Cassava Pulp and Sugarcane Bagasse using Oleaginous Yeast. Orient J Chem 2019;35(2). Available from: https://bit.ly/2vrTJU0 |
Introduction
Biorefining is the process of production of various products, for example biofuels and value-added chemicals from biomass. Biofuels produced from low cost feedstocks are necessary as a sustainable supply for industry and green economy.1 At present, biodiesel is mainly produced by transesterification of edible and some inedible vegetable oils, wasted cooking oils and animal fats. This process leads to debates in competitions between needs for human foods and animal feeds and industrial activities, and leads to the development of secondary generation biodiesel produced from agricultural waste residues. In general, various biorefining process has four common steps, including pretreatment, hydrolysis, catalytic conversion or fermentation and extraction or recovery.2 To make a process become economical and practical feasible, it is necessary to develop the conversion process with high efficiency and high flexibility.
Lignocellulosic biomass is one of the most abundant raw materials for biorefining process. In agricultural fields, after harvesting seasons, leftover residues have been disposed on sites or burned down, causing serious environmental problems. In 2016, In Thailand, 29.83% of electricity (2,814.7 MW) and 90.60% of heat (6.507 MT crude oil equivalent) of renewable energy were produced from agricultural biomass suggesting the growing potential of this type of biomass.3 Currently, cassava pulp and sugarcane bagasse, composing of lignocellulosic biomass, are produced as by-products of tapioca starch and sugar processing industry. Both of them are also obtained from bioethanol production plants as they are the main raw-materials in Thailand.
Although, cassava pulp and sugarcane bagasse composed of lignocellulose biomass, they contain different profiles of heterogeneous complexes of carbohydrate polymers. In addition, each biomass also contains different chemicals that may inhibit catalytic conversion or fermentation. Therefore, it is important to select an appropriate microbes or catalysts to obtain the maximal conversion of biomass. In Thailand, biodiesel gains more market share and need due to growing trends of diesel engine in transportation sectors. Microbial oil has gained much attention as an alternative raw material for biodiesel production. The major benefits of using microbes for oil production are due to their flexibility to consume various types of biomass under specific condition and their high catalytic activities to convert biomass to the target products.4
Oleaginous microorganisms, such as yeast, fungi, bacteria, and microalgae, are defined as microorganisms with oil accumulation excess of 20% biomass weight.5,6 The eukaryotic oleaginous microorganisms, including yeast, can synthesize triacylglycerols (TAGs), which has similar compositions with vegetable oils, making them become appropriate feedstock for the biodiesel production.4 In this study, two oleaginous yeasts were screened and selected from various industrial waste deposits. The advantages of using yeasts as lipid producers with other microorganisms like filamentous fungi and microalgae include the shorter duplication time, higher growth rates of yeasts and easier scale up of lipid production.7 The yeast oil productions from cassava pulp and sugarcane bagasse were optimized based on mathematic modeling methodology. The fatty acid compositions of yeast oils were analyzed to assess the appropriateness to apply these products to biodiesel production.
Materials and Methods
Preparation of Cassava Pulp and Sugarcane Bagasse Hydrolysates
Cassava pulp and sugarcane bagasse were air-dried, milled and sieved through a 0.5 mm mesh. Dried biomass was added in 2% (v/v) diluted sulfuric acid at a solid loading of 10% (w/v), and the mixtures were autoclaved at 121°C for 30 min. After cooling, the mixed biomass was separated by vacuum filtration and centrifugation at 10,000 rpm for 10 min, and then stored at 4°C. The liquid hydrolysate fractions of cassava pulp and sugarcane bagasse were analyzed for the content of total sugar by using 3,5-dinitrosalicylic acid (DNS) method8 and sugar compositions by using HPLC.
Isolation and Screening of Oleaginous Yeast
Ten grams of samples (ex. cassava pulp waste, sugarcane bagasse waste, factory wastewater, soil) were subjected to 90 mL of MGYP medium containing (g/L): glucose, 10; peptone, 5; yeast extract, 5; malt extract, 3; KH2PO4, 1 and MgSO4•7H2O, 0.5 in a 250 mL Erlenmeyer flask.9 Ampicillin (50 mg/L) and streptomycin (50 mg/L) were added to minimize bacterial growth.10 The samples were incubated at 30°C for 48 h, at 200 rpm. The enriched cultures were serially diluted in sterile distilled water and spreaded on MGYP agar plates. Each isolate on MGYP agar was cultured on media containing cassava pulp and sugarcane bagasse hydrolysates as main carbon sources that supplement with 5 g/L of yeast extract and incubated at 30°C for 72 h. Then, the lipid content of selected isolate was examined by growing it in hydrolysates broth (20 g/L of initial total sugar) that supplement with 5 g/L of yeast extract and incubated at 30°C using shaken mode for 120 h at 180 rpm.
Identification of Yeast Isolates by Sequencing of 26S rDNA Gene
Genus and species of the selected yeast isolates were identified based on the similarity of D1/D2 domain of 26S ribosomal DNA sequence. The genomic DNA was used as a template in a PCR reaction to amplify a fragment of the 26S rDNA gene by using thermal cycler machine. The PCR mixture was amplified with primers NL-1 (5’-GCA TAT CAA TAA GCG GAG GAA AAG-3’) and NL4 (5’-GGT CCG TGT TTC AAG ACG G-3’)13 and sequenced by ABI PrismTM BigDyeTM Terminator Cycle Sequence Ready Reaction Kit (Applied Biosystems, USA) according to Thailand Bioresource Research Center (TBRC)’s instruction.
Optimization of Lipid Production
Plackett–Burman Design
The selected yeast isolate was investigated to suitable nitrogen source by cultured in cassava pulp and sugarcane bagasse hydrolysates broth (20 g/L of total sugar) that supplement with 5 g/L of different nitrogen sources (yeast extract, peptone, urea, ammonium sulfate and ammonium nitrate) and incubated at 30°C using shaken mode for 120 h at 180 rpm. To identify significant variables for lipid production based on Plackett–Burman (PB) design, six culturing parameters, including total sugar, nitrogen content, supplemented nutrient (g/L; MgSO4•7H2O 0.4 g, KH2PO4 2 g, MnSO4•H2O 0.003, CuSO4•5H2O 0.001 g),11 initial pH, inoculum size and temperature were tested at these two levels (-1 and +1).12,13 The main effect was calculated as a difference between the average measurements of each variable at a high level (+1) and a low level (−1).12 This design screened and identified variables based on a first-order model:
![]()
Where, Y is the response (lipid content), βº is the model intercept and β1 is the linear coefficient, and is the level of the independent variable.
Box-Behnken Design
A Response Surface Methodology (RSM) in the form of a Box-Behnken design (BBD)14,15,16 was selected to statistically optimize lipid production in three factor levels (−1, 0, +1) based on the main effect of lipid content obtained from PB. The response surface regression procedure was used to predict the optimal point by using the following second-order polynomial equation:
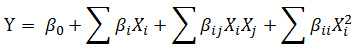
Where, Y is the predicted response, βº is a constant, β1 is the linear coefficients, βij is the two factors interaction coefficient, is the quadratic coefficient, and Xi, Xj are the independent variables.
Analysis of variance (ANOVA) was calculated to verify the fitted statistical model. The decency of the second-order polynomial model was expressed by coefficient of determination (R2), and its statically significance was checked by F-test using the Design-Expert 7.0.0 Demo version (Stat-Ease. Inc., MN, USA). Three-dimensional response surface plots were drawn to represent the interaction and influence of variables on responses.13,17
Analysis
The concentrations of glucose, xylose, arabinose, 5-hydroxymethylfurfural (HMF), and furfural in hydrolysates were determined by HPLC (Shimadzu LC-20AD, Shimadzu, Japan) equipped with Refractive Index Detector. The chemical compounds seperated on an Aminex HPX-87H cation-exchange column (300 × 7.8 mm, Bio-Rad, CA, USA) and oven was maintained at 65°C. The mobile phase was 0.005 M sulfuric acid with a flow rate of 0.5 mL/minute with isocratic elution and injection volume was 20 μL. Concentration of each compound was calculated based on external standard.18
For lipid content analysis, the yeast cell pellet was harvested by centrifugation, washed twice with distilled water and dried at 60°C for 72 h. The dried yeast cells were treated with 2 M HCl, incubated at 60°C for 2 h, and centrifuged at 10,000 rpm, 4°C for 10 min.19 The liquid fraction was extracted according by Bligh-Dyer’s method using chloroform (CHCl3) and methanol (CH3OH) with ratio 2:1 as solvents.20 The solvent was evaporated and dried to constant weight. The lipid content is expressed as a percentage of gram lipid per gram dried biomass.
The fatty acid methyl esters (FAMEs) contents of crude lipid were determined by GCMS, model GCMS-QP2010 (Shimadzu, Japan). Separation was performed on a Rtx-5MS (Restek, USA) fused silica capillary column (30 m × 0.25 mm, 0.25 μm film thickness). The carrier gas was helium with flow rate of 1.0 mL/min. The column temperature was programmed from 120 to 250°C at the rate of 10°C/min. The temperature of both injector and detector was set at 250°C. A sample volume of 1 μL crude lipid in CHCl3 was injected using a split mode, with the split ratio of 1:24. The mass spectrometer was set to scan in the range of m/z 50-550 in electron ionization mode (EI) at 70 eV.21 Each peak area was verified to the standard curve of FAME Mix, C14-C22 (Sigma-Aldrich, USA).
Results and Discussion
Composition of cassava pulp and sugarcane bagasse hydrolysates
Cassava pulp was discarded from tapioca processing industry with starch remains up to 50-60%24 and sugarcane bagasse from sugar processing industry with carbohydrate remains up to 60-70%.25 Cassava pulp and sugarcane bagasse was hydrolyzed by 2% sulfuric acid for 30 min, then compositions, including total sugars, glucose, xylose, arabinose and inhibitor components (HMF and furfural), of their liquid hydrolysates were analyzed by HPLC (Table 1). The diluted acid hydrolysis of these lignocellulosic biomass at the proper temperature could transform lignocellulose into soluble sugars, which microorganisms can utilize as a carbon source. The results showed that glucose (48.63 g/L) and xylose (24.49 g/L) was the major hydrolysis products of cassava pulp and sugarcane bagasse, respectively. This analysis noted the importance on selection of types of biomass for the process due to big variation on the products. Additionally, the chemical inhibitors of fermentation, such as HMF and furfural, were differentially generated from cassava pulp and sugarcane bagasse under the same hydrolysis condition. This is due to the decomposition of hexoses to 5-hydroxymethyl furfural (HMF) and pentose to furfural.26 The highest HMF and furfural concentrations in sugarcane bagasse were 0.37 and 0.38 g/L, respectively, while furfural was undetected in cassava pulp hydrolysate. Previously, it was demonstrated that some yeast strains could resist of HMF and furfural at concentration of 1 and 3 g/L,11 thus it is not necessary to detoxify cassava pulp and sugarcane bagasse hydrolysates to remove these inhibitors before fermentation.
Table 1: Composition of cassava pulp and sugarcane bagasse after diluted acid hydrolysis.
|
Concentration (g/L) |
Dilute acid hydrolysate |
|
|
Cassava pulp |
Sugarcane bagasse |
|
| Total sugar |
80.86±5.32 |
59.68±13.34 |
| Glucose |
48.63±0.10 |
15.08±0.34 |
| Xylose |
18.13±0.09 |
24.49±0.43 |
| Arabinose |
7.22±0.04 |
8.84±1.08 |
| HMF |
0.30±0.02 |
0.37±0.01 |
| Furfural |
nd |
0.38±0.01 |
nd: not detected
Isolation and Screening of Oleaginous Yeast
The oleaginous yeast was screened for the lipid production from cassava pulp and sugarcane bagasse hydrolysate. A total of 113 yeast isolates was isolated from various local resources in Kalasin province, Thailand, including cassava pulp, sugarcane bagasse, wastewater, soil. Thirty two isolates had ability to grow in medias containing sole carbon sources as cassava pulp and sugarcane bagasse hydrolysates. Among those isolates, two yeast isolates, MSU2 and Ka28, that collected from tapioca processing industry produced the highest lipid contents (more than 20% of biomass) from cassava pulp and sugarcane bagasse hydrolysate broth, respectively. Thus, these 2 isolates were selected for optimization experiments for microbial oil production. To select the nitrogen sources for these 2 isolates, five types of nitrogen sources, including yeast extract, peptone, urea, ammonium sulfate and ammonium nitrate, were supplemented in broth. The results showed that peptone and yeast extract were suitable nitrogen sources for MSU2 and Ka28, respectively. To identify these selected yeast candidates, the D1/D2 domain of 26S ribosomal DNA of each isolate was amplified by PCR, and the fragment product was sequenced, then aligned using BLAST in NCBI database (https://www.ncbi.nlm.nih.gov/). The BLAST analysis identified that MSU2 and Ka 28 were as Hanseniaspora uvarum CBS:314 (KY107844.1) 99.8% and Meyerozyma guilliermondii CBS:2030T (KY108542.1) 100%.
Optimization of Lipid Production
Screening of Significant Parameters for Lipid Production by PB
The PB design was conducted to screen the parameters that have effect on lipid production in MSU2 and Ka28 (Table 2 and 3). The effect value of each factor indicated the degree of its effect to the response factor. The positive or the negative sign of each effect value indicated that each tested parameter influenced to get the greater lipid yield when the level of tested parameters was high or low level, respectively. In MSU2, X1 (total sugar concentration), X3 (nutrient 10X), X4 (initial pH) and X5 (inoculum size) had positive effect, in contrast, X2 (peptone concentration) and X6 (temperature) had negative effect on lipid production. However, only pH, inoculum size and temperature had p-value of less than 0.05 that suggested a significant effect of these variables on lipid production. Likewise, in Ka28, the positive parameters on lipid production based on effect value were X1 (total sugar concentration), X3 (nutrient 10X), X4 (initial pH) and X5 (inoculum size), while the negative parameters were X2 (yeast extract concentration) and X6 (temperature). Again, with p-value<0.05, only total sugar concentration, yeast extract concentration and nutrient 10X were significant parameters. Therefore, these three variables of each yeast isolate were selected for RSM experiment to find optimal condition for lipid production.
Table 2: Level of variables, estimated effect, regression coefficient and corresponding F and P values for lipid content by MSU2 in PB.
|
Code |
Variable |
Low level (-1) |
High level (+1) |
Coefficient |
Effect |
F-value |
P-value Prob > F |
|
X1 |
Total sugar (g/L) |
20 |
60 |
2.48 |
4.97 |
3.65 |
0.0925 |
|
X2 |
Peptone (g/L) |
5 |
10 |
-0.72 |
-1.45 |
0.31 |
0.5932 |
|
X3 |
Nutrient 10X (mL/100mL) |
1 |
10 |
0.085 |
0.17 |
0.00 |
0.9495 |
|
X4 |
Initial pH |
5 |
7 |
2.93 |
5.86 |
5.08 |
0.0543 |
|
X5 |
Inoculum size (%) |
1 |
10 |
5.46 |
10.93 |
17.66 |
0.0030 |
|
X6 |
Temperature (°C) |
25 |
35 |
-7.00 |
-13.99 |
28.96 |
0.0007 |
Table 3: Level of variables, estimated effect, regression coefficient and corresponding F and P values for lipid content by Ka28 in PB.
|
Code |
Variable |
Low level (-1) |
High level (+1) |
Coefficient |
Effect |
F-value |
P-value Prob > F |
|
X1 |
Total sugar (g/L) |
20 |
40 |
1.53 |
3.06 |
5.62 |
0.0419 |
|
X2 |
Yeast extract (g/L) |
5 |
10 |
-2.40 |
-4.81 |
13.83 |
0.0048 |
|
X3 |
Nutrient 10X (mL/100mL) |
1 |
10 |
1.90 |
3.80 |
8.63 |
0.0166 |
|
X4 |
Initial pH |
5 |
7 |
0.99 |
1.99 |
2.37 |
0.1580 |
|
X5 |
Inoculum size (%) |
1 |
10 |
0.28 |
0.56 |
0.19 |
0.6768 |
|
X6 |
Temperature (°C) |
25 |
35 |
-1.30 |
-2.59 |
4.03 |
0.0758 |
Optimization of significant factors by RSM for lipid production
To find the optimal level of tested parameters to maximize the lipid production, the RSM experiments with Box–Behnken design were conducted in MSU2 (Table 4) and Ka28 (Table 5) using cassava pulp and sugarcane bagasse hydrolysates as main carbon sources, respectively. In MSU2, three selected independent factors i.e. initial pH, inoculum size and temperature obtained from PB were varied in three levels (-1, 0, +1) with a total of 16 experimental runs. While, in Ka28, total sugar content, yeast extract content and nutrient 10X were selected. The results of actual experimental lipid content with the observed and predicted values were shown in Table 4 and 5 for MSU2 and Ka28, respectively. Based on the experimental runs, the lipid content of MSU2 and Ka28 ranged from 13.39 to 35.83% (Table 4) and 14.06 to 21.53% (Table 5), respectively.
Table 4: RSM design with the observed and predicted values of MSU2.
|
run |
Variable/ Levels |
Response |
||||||
|
Initial pH |
Inoculum size (%) |
Temperature (°C) |
Lipid content (%) |
|||||
|
X1 |
Actual |
X2 |
Actual |
X3 |
Actual |
Observed |
Predicted |
|
|
1 |
0 |
7 |
-1 |
10 |
-1 |
25 |
13.39 |
17.25 |
|
2 |
+1 |
8 |
0 |
20 |
+1 |
30 |
12.07 |
14.32 |
|
3 |
-1 |
6 |
0 |
20 |
+1 |
30 |
25.20 |
28.47 |
|
4 |
0 |
7 |
0 |
20 |
0 |
27.5 |
34.59 |
33.95 |
|
5 |
0 |
7 |
-1 |
10 |
+1 |
30 |
17.87 |
16.21 |
|
6 |
0 |
7 |
0 |
20 |
0 |
27.5 |
30.60 |
33.95 |
|
7 |
-1 |
6 |
0 |
20 |
-1 |
25 |
29.65 |
27.40 |
|
8 |
0 |
7 |
+1 |
30 |
-1 |
25 |
25.36 |
27.02 |
|
9 |
+1 |
8 |
+1 |
30 |
0 |
27.5 |
19.40 |
21.00 |
|
10 |
+1 |
8 |
-1 |
10 |
0 |
27.5 |
17.66 |
17.07 |
|
11 |
0 |
7 |
0 |
20 |
0 |
27.5 |
34.76 |
33.95 |
|
12 |
0 |
7 |
+1 |
30 |
+1 |
30 |
20.76 |
16.91 |
|
13 |
-1 |
6 |
-1 |
10 |
0 |
27.5 |
24.87 |
23.27 |
|
14 |
+1 |
8 |
0 |
20 |
-1 |
25 |
29.81 |
26.54 |
|
15 |
-1 |
6 |
+1 |
30 |
0 |
27.5 |
29.22 |
29.81 |
|
16 |
0 |
7 |
0 |
20 |
0 |
27.5 |
35.83 |
33.95 |
Table 5: RSM design with the observed and predicted values of Ka28.
|
run |
Variable/ Levels |
Response |
||||||
|
Total sugar (g/L) |
Yeast extract (g/L) |
Nutrient 10X (mL/100mL) |
Lipid content (%) |
|||||
|
X1 |
Actual |
X2 |
Actual |
X3 |
Actual |
Observed |
Predicted |
|
|
1 |
+1 |
50.00 |
+1 |
5.00 |
0 |
20.00 |
19.56 |
19.54 |
|
2 |
-1 |
30.00 |
0 |
3.00 |
+1 |
30.00 |
14.09 |
14.06 |
|
3 |
0 |
40.00 |
-1 |
1.00 |
-1 |
10.00 |
19.36 |
19.49 |
|
4 |
-1 |
30.00 |
-1 |
1.00 |
0 |
20.00 |
16.27 |
16.29 |
|
5 |
0 |
40.00 |
+1 |
5.00 |
+1 |
30.00 |
16.84 |
16.71 |
|
6 |
+1 |
50.00 |
0 |
3.00 |
+1 |
30.00 |
20.02 |
20.35 |
|
7 |
0 |
40.00 |
+1 |
5.00 |
-1 |
10.00 |
17.48 |
17.47 |
|
8 |
-1 |
30.00 |
0 |
3.00 |
-1 |
10.00 |
15.85 |
15.69 |
|
9 |
0 |
40.00 |
0 |
3.00 |
0 |
20.00 |
18.85 |
18.61 |
|
10 |
0 |
40.00 |
-1 |
1.00 |
+1 |
30.00 |
18.87 |
18.88 |
|
11 |
+1 |
50.00 |
0 |
3.00 |
-1 |
10.00 |
20.06 |
20.09 |
|
12 |
0 |
40.00 |
0 |
3.00 |
0 |
20.00 |
18.51 |
18.61 |
|
13 |
0 |
40.00 |
0 |
3.00 |
0 |
20.00 |
18.56 |
18.61 |
|
14 |
+1 |
50.00 |
-1 |
1.00 |
0 |
20.00 |
21.70 |
21.53 |
|
15 |
-1 |
30.00 |
+1 |
5.00 |
0 |
20.00 |
13.92 |
14.09 |
|
16 |
0 |
40.00 |
0 |
3.00 |
0 |
20.00 |
18.51 |
18.61 |
The fit response surface model of MSU2 and Ka28 was judged by analysis of variance (ANOVA) (Table 6 and 7). In MSU2 dataset (Table 6), the F-value and p-values (Prob>F) for the model are 5.78 and 0.0224, respectively, which suggested that the quadratic model is highly significant. In addition, the coefficient of determination (R2) of the model is 0.8966, explaining 89.66%of variability in the response suggesting a high significance of the model. The estimated optimal conditions from the equation (1) revealed that pH 6.57, 22.84% of inoculum size and temperature of 26.28°C provided the highest lipid content at 34.56%. For term model analysis, only initial pH (X1) had a p-value less than 0.05 indicating a significant effect on lipid production. According to Cui et al., pH values of the culture medium had an important role on lipid production up to 33.58% in Cryptococcus curvatus at the optimum pH of 6.0.27 On the other hand, in Ka28 dataset (Table 7), the F- and p-values (Prob>F) for the model are 210.65 and <0.0001, respectively and the R2 of the model is 0.9968 suggested that the quadratic model is highly significant. The estimate optimum conditions from the equation (2) revealed 53.52 g/L of total sugar content, 1.25 g/L of yeast extract content and 21.86 mL/100 mL of nutrient 10X could get lipid content at 21.85%. The significant term model with p-value<0.05 for lipid production are yeast extract content (X2) and nutrient 10X (X3).
Table 6: ANOVA and results of regression analysis of Box–Behnken design for lipid production by yeast isolate MSU2.
|
Source |
Sum of squares |
df |
Mean squares |
F value |
p-value Prob > F |
| Model |
766.20 |
9 |
85.13 |
5.78 |
0.0224 |
| -Initial pH |
112.50 |
1 |
112.50 |
7.64 |
0.0327 |
| -Inoculum |
54.86 |
1 |
54.86 |
3.72 |
0.1019 |
| -Temperature |
62.22 |
1 |
62.22 |
4.22 |
0.0856 |
|
1.70 |
1 |
1.70 |
0.12 |
0.7454 |
|
|
44.16 |
1 |
44.16 |
3.00 |
0.1341 |
|
|
20.61 |
1 |
20.61 |
1.40 |
0.2816 |
|
|
39.94 |
1 |
39.94 |
2.71 |
0.1507 |
|
|
255.84 |
1 |
255.84 |
17.37 |
0.0059 |
|
|
174.37 |
1 |
174.37 |
11.84 |
0.0138 |
|
| Residual |
88.38 |
6 |
14.73 |
||
| Lack of Fit |
72.56 |
3 |
24.19 |
4.59 |
0.1214 |
| Pure Error |
15.82 |
3 |
5.27 |
||
| Cor Total |
854.59 |
15 |
Table 7: ANOVA and results of regression analysis of Box–Behnken design for lipid production by yeast isolate Ka28.
|
Source |
Sum of squares |
df |
Mean squares |
F value |
p-value Prob > F |
| Model |
70.29 |
9 |
7.81 |
210.65 |
<0.0001 |
| -Total sugar |
1.856E-005 |
1 |
1.856E-005 |
5.006E-004 |
0.9829 |
| -Yeast extract |
0.33 |
1 |
0.33 |
8.81 |
0.0250 |
| -Nutrient 10X |
0.79 |
1 |
0.79 |
21.41 |
0.0036 |
|
0.90 |
1 |
0.90 |
24.34 |
0.0026 |
|
|
0.011 |
1 |
0.011 |
0.30 |
0.6052 |
|
|
5.625E-003 |
1 |
5.625E-003 |
0.15 |
0.7103 |
|
|
1.78 |
1 |
1.78 |
47.89 |
0.0005 |
|
|
0.61 |
1 |
0.61 |
16.52 |
0.0066 |
|
|
0.025 |
1 |
0.025 |
0.67 |
0.4446 |
|
| Residual |
0.22 |
6 |
0.037 |
||
| Lack of Fit |
0.14 |
3 |
0.047 |
1.78 |
0.3241 |
| Pure Error |
0.080 |
3 |
0.027 |
||
| Cor Total |
70.51 |
15 |
Three-dimensional surface responses were plotted to determine the optimum level of tested parameters and to observe the interactions of two tested parameters at a time on the lipid production (Fig. 1 and 2). The results of MSU2 showed that the lipid content could be the highest when the tested level were mid-level, i.e. the initial pH (pH 7), inoculum size (20%) and temperature (27.5°C), further increased or decreased of these three variables resulted in slightly lower lipid content (Fig. 1). In Ka28, the effects of tested factors, yeast extract content and nutrient 10X were less sensitive to changes compared to total sugar. In addition, yeast extract content and nutrient 10X had a negative effect, while total sugar had a positive effect on lipid production (Fig. 2). According to the previous research reported that the organic nitrogen improves cell growth and lipid accumulation in oleaginous yeast, Cryptococcus curvatus O3, while inorganic nitrogen is most beneficial in biomass accumulation.28 Moreover, Tsigie et al. reported that the nitrogen source is essential for proteins and nucleic acids synthesis, but this will be repressed when nitrogen source is depleted and carbon source will be channeled to lipid accumulation in Yarrowia lipolytica Po1g.29 Therefore, the limited nitrogen is effective to enhance the lipid accumulation in oleaginous yeast.
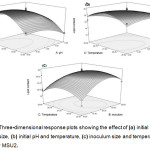 |
Figure 1: Three-dimensional response plots showing the effect of (a) initial pH and inoculum size, (b) initial pH and temperature, (c) inoculum size and temperature on lipid content by MSU2. |
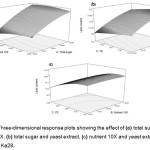 |
Figure 2: Three-dimensional response plots showing the effect of (a) total sugar and nutrient 10X, (b) total sugar and yeast extract, (c) nutrient 10X and yeast extract on lipid content by Ka28. |
Identification of yeast FAME compositions of lipid
The FAME compositions of accumulated lipids by MSU2 and Ka28 using cassava pulp and sugarcane bagasse as carbon sources, respectively were analysed. Each peak area corresponds to a FAME content was verified by running the standards under identical experimental conditions and comparing the respective retention time data. Under the optimized condition, the fatty acid profiles were primarily composed of myristic (C14:0), palmitic (C16:0), stearic (C18:0), oleic (C18:1), linoleic (C18:2) and arachidic acid (C20:0) (Table 8). Palmitic and oleic acid were dominated the fatty acid components in total crude lipids of all optimized batches by MSU2 and Ka28, respectively. According to Huang et al., the lipid production by Trichosporon fermentans using bagasse hydrolysate as carbon source, mainly composed of palmitic, stearic, oleic, linoleic acid, and unsaturated fatty acids.30 Moreover, the GCMS peak area comparison of fatty acid profile as percentages have the dominant oleic acid of 48.77 and 63.03% were produced by MSU2 and Ka28, respectively. According to Yu et al., reported that Rhodotorula glutinis and Cryptococcus curvatus were produced the same dominant oleic acid of 43.4 and 47.7%, respectively.11 A comparative result with vegetable oils such as palm oils, which have the dominant fatty acids including palmitic (32-46.3%) and oleic acid (37-53%).30 MSU2 and Ka28 were generally synthesized lipids comprising of C16 and C18 fatty acids, which were highly similar to vegetable oils. These two yeast isolates could be used as feedstock for biodiesel production with the catalysis either by lipase or chemical catalyst.30,31,32
Table 8: FAMEs composition of lipid by MSU2 and Ka28.
|
Yeast strain |
Fatty acid content (mg/g crude lipid) |
|||||
|
Myristic |
Palmitic |
Stearic |
Oleic |
Linoleic |
Arachidic |
|
|
C14:0 |
C16:0 |
C18:0 |
C18:1 |
C18:2 |
C20:0 |
|
| H. uvarum MSU2 |
4.53 |
72.95 |
4.74 |
16.92 |
nd |
4.18 |
| M. guilliermondii Ka28 |
2.19 |
87.59 |
44.16 |
195.01 |
27.28 |
nd |
nd: not detected.
Conclusion
The present report describes the optimization of lipid production from lignocellulosic agricultural wastes by two oleaginous yeast strains via PB and RSM. The process investigated low cost medium, containing cassava pulp and sugarcane bagasse hydrolysate. These are potential low-cost substrates for yeast lipid production. The newly isolate yeasts H. uvarum MSU2 and M. guilliermondii Ka28 could grow and accumulate lipids, which their fatty acid composition profiles were similar to vegetable oils suggesting their potential application in biodiesel production and biorefining process.
Acknowledgements
This study was supported by Department of Biotechnology, Faculty of Technology, Mahasarakham University, Thailand.
Conflict of Interest
The authors declare that there are conflicts of interest.
References
- Fontanille, P.; Kumar, V.; Christophe, G.; Nouaille, R.; Larroche, C. Biores. Technol., 2012, 114, 443-449.
- Rodiahwati, W.; Sriariyanun, M. KMUTNB Int. J. Appl. Sci. Technol., 2016, 9, 289-298.
- Junnienkul, N.; Douzou, T.; Yasurin, P.; Asavasanti, S.; Sriariyanun, M. KMUTNB Int. J. Appl. Sci. Technol., 2018, 11, 199-207.
- Liang, M.H.; Jiang, J.G. Prog. Lipid Res., 2013, 52, 395-408.
- Meng, X.; Yang, J.; Xu, X.; Zhang, L.; Nie, Q.; Xian, M. Renew. Energ., 2009, 34, 1-5.
- Ma, Y.L. Chin. J. Bioprocess Eng., 2006, 4(4), 7–11.
- Poontawee, R.; Yongmanitchai, W.; Limtong, S. Proc. Biochem., 2017, 53, 44-60.
- Miller, G., 1959. Anal. Chem., 1959, 31, 426-428.
- Sankh, S.; Thiru, M.; Saran, S.; Rangaswamy, V. Fuel, 2013, 106, 690–696.
- Thabet, H. M.; Pasha, C.; Ahmed, M.; Linga, V. R. Jordan J. Biol. Sci., 2012, 5(4), 301–306.
- Yu, X.; Zheng, Y.; Dorgan, K. M.; Chen, S. Biores. Technol., 2011, 102(10), 6134–6140.
- Karlapudi, A.P.; Krupanidhi, S.; Reddy, E.R.; Indira, M.; Bobby, Md. N.; Venkateswarulu, T.C. Beni-Suef Univ. J. Basic Appl. Sci., 2018, https://doi.org/10.1016/j.bjbas.2018.06.006.
- Saraphirom, P.; Reungsang, A. Inter. J. Hydrogen Energy, 2010, 35, 13435-13444.
- Amnuaycheewa, P.; Hengaroonprasan, R.; Rattanaporn, K.; Kirdponpattara, S.; Cheenkachorn, K.; Sriariyanun, M. Ind. Crop. Prod., 2016, 84, 247-254.
- Amnuaycheewa, P.; Rodiahwati, W.; Sanvarinda, P.; Cheenkachorn, K.; Tawai, A.; Sriariyanun, M. KMUTNB Int. J. Appl. Sci. Technol., 2017, 10, 107-117.
- Sriariyanun, M.; Yan, Q.; Nowik, I.; Cheenkachorn, K.; Phusantisampan, T.; Modigell, M. Kasetsart J. Nat. Sci., 2015, 49, 146-154.
- Fachel, F.N.S.; Medeiros-Neves, B.; Prá, M.D.; Schuh, R.S.; Veras, K.S.; Bassani, V.L.; Koestera, L.S.; Henriques, A.T.; Braganhol, E.; Teixeira, H.F. Carbohyd. Polym., 2018, 199, 572-582.
- Liang, Y.; Jarosz, K.; Wardlow, A. T.; Zhang, J.; Cui, Y. App. Biochem. Biotechnol., 2014, 173(8), 2086–2098.
- Xavier, M. C. A.; Coradini, A. L. V.; Deckmann, A. C.; Franco, T. T. Biochem. Eng. J., 2017, 118, 11–19.
- Tampitak, S.; Louhasakul, Y.; Cheirsilp, B.; Prasertsan, P. App. Biochem. Biotechnol., 2015, 176(6), 1801–1814.
- Tariq, M.; Ali, S.; Ahmad, F.; Ahmad, M.; Zafar, M.; Khalid, N.; Khan, M. A. Fuel Process. Technol., 2011, 92(3), 336–341.
- Kurtzman, C.P.; Robnett, C.J. Identification and phylogeny of ascomycetous yeasts from analysis of nuclear large subunit (26S) ribosomal DNA partial sequences. A. van Leeuw., 1998, 73, 331–371.
- Miller, G. L. Use of Dinitrosalicylic Acid Reagent for Determination of Reducing Sugar. Anal. Chem., 1959, 31(3), 426–428.
- Sriroth, K.; Chollakup, R.; Chotineeranat, S.; Piyachomkwan, K.; Oates, C. G. Biores. Technol., 2000, 71(1), 63–69.
- Vargas Betancur, G. J.; Pereira, N. Electron. J. Biotechn., 2010, 13(3), 1–9.
- Cheng, K.K.; Cai, B.Y.; Zhang, J.A.; Ling, H.Z.; Zhou, Y.J.; Ge, J.P.; Xu, J.M. Biochem. Eng. J., 2008, 38, 105–109.
- Cui, Y.; Blackburn, J.W.; Liang, Y. Biom. Bioen., 2012, 47, 410-417.
- Zhang, J.; Fang, X.; Zhu, X.L.; Li, Y.; Xu, H.P.; Zhao, B.F.; Chen, L.; Zhang, X.D. Biom. Bioen., 2011, 35, 1906-1911.
- Tsigie, Y.A.; Wang, C.Y.; Kasim, N.S.; Diem, Q.D.; Huynh, L.H.; Ho, Q.P.; Truong, C.T.; Ju, Y.H. J. Biomed. Biotechnol., 2012, doi:10.1155/2012/378384.
- Huang, C.; Wu, H.; Li, R. feng; Zong, M. hua. New Biotechnol., 2012, 29(3), 372–378.
- Li, Q.; Du, W.; Liu, D. App. Microbiol. Biotechnol., 2008, 80, 749–756.
- Dasgupta, D.; Sharma, T.; Bhatt, A.; Bandhu, S.; Ghosh, D. Biocatal. Agric. Biotechnol., 2017, 10, 308-316.

This work is licensed under a Creative Commons Attribution 4.0 International License.
![]()
A New Edition of Web of Science
Journal Impact Factor
2022: 0.5
Five Year: 0.8
Journal is Indexed in

Cabells Whitelist
![]()


