Estimation the Sorption Capacity of Chemically Modified Chitosan Toward Cadmium Ion in Wastewater Effluents
Eman A. Alabbad*
Department of Chemistry, College of Science, Imam Abdulrahman Bin Faisal University, P.O. Box 1982, Dammam 31441, Saudi Arabia.
Corresponding Author E-mail: ealabbad@iau.edu.sa
DOI : http://dx.doi.org/10.13005/ojc/350236
Article Received on : 11-12-2018
Article Accepted on : 23-03-2019
Article Published : 27 Apr 2019
This study aimed to investigation of Cd(II) ion removal from wastewater using chitosan-vanillin as sorbent I and chitosan-ortho-vanillin as sorbent II under various experimental conditions. The influence of pH, initial Cd(II) ion concentrations and isotherm studies, temperature and thermodynamic studies, adsorbent mass, adsorption time and kinetic studies on the sorption process have been studied using different experiments. The residual ion quantity is estimated through atomic absorption spectrometry. The maximum Cd(II) ion removal is obtained at pH 6 with highest uptake of ions after agitation for 2 hours. Langmuir isotherm model represented the most suitable for the experimental data and the maximum adsorbing capacity was 20.704 mg g-1 and 51.020 mg g-1 for sorbents I and II, respectively. Results of this study suggest that chemisorption is a step of rate-determining and the thermodynamic studies revealed that the nature of uptake sorption process is endothermic and spontaneous.
KEYWORDS:Adsorption; Chitosan Based Sorbent; Chelating Polymer; Cadmium Removal; Wastewater Treatment
Download this article as:| Copy the following to cite this article: Alabbad E. A. Estimation the Sorption Capacity of Chemically Modified Chitosan Toward Cadmium Ion in Wastewater Effluents. Orient J Chem 2019;35(2). |
| Copy the following to cite this URL: Alabbad E. A. Estimation the Sorption Capacity of Chemically Modified Chitosan Toward Cadmium Ion in Wastewater Effluents. Orient J Chem 2019;35(2). Available from: https://bit.ly/2DExQFr |
Introduction
Water is considered an important element for most economic social and economic works.1,2 The rapidly growing of economic development and population growth have resulted in significant environmental damage, severe water pollution and severe water resource shortages. In addition, water is often wasted or used in the wrong way, increasing the likelihood of a serious water crisis on the planet. But recently it has been recognized that the overall efficiency of the water system involves the use of water and reprocessing of used water and wastewater. There is therefore a great need and interest in research on water use assessment and wastewater treatment efficiency.3,4
Recently, there has been a great understanding of the understanding of wastewater management and many researchers have explored how to deal with problems related to wastewater in the past. Researchers concluded that there are two main purposes for wastewater treatment. The first and most common purpose is that sanitation results in large quantities of water. Hence the need for safe disposal of this type of water, while adhering to the correct methods of wastewater disposal of large quantities of sewage water flowing into the river can be treated especially at the bottom of the river basin and is suitable for the environment.5
The second objective is the reuse of wastewater in modern ways, a fairly new concept in many societies around the world, although it has been used in a pilot way over 5000 years, a phenomenon occurring in nature along river basins throughout the world. Wastewater reuse and treatment led to the emergence of some technology-based practices in the twentieth century following the implementation of large-scale wastewater treatment around the world, particularly developed countries, as well as the increase in the number of people living in large cities. It is worth mentioning that there are large amounts of treated wastewater reused, and is expected to increase further in the future.6
Several water treatment techniques have been advanced and used for the sorption of heavy metals (HMS) from water including ion exchange (IE),7 membrane filtration,8,9 coagulation-flocculation-sedimentation (CFS) and adsorption.10,11 Adsorption differs from the method described above, being safe, highly effective and low cost. Cadmium is one of the most poisonous metals that have a negative effect on humans, and the rate of its removal from the body is very low and has toxicity with other minerals. Thus, the removal of cadmium from contaminated water is of serious importance.12,13
Cadmium toxicity has been shown in many body systems. Cadmium stimulates tissue injury by creating oxidative stress,14,15 and genetic changes in DNA expression.16,17,18 prepared a polyethylenimine (PEI)-grafted gelatin sponge to remove toxic metals effectively through wastewater irrigation. Depending on the strong ability of water uptake, wastewater stayed in sponge of PEI-grafted gelatin for adequate time for the interaction of heavy metals with the sorbents. Cd (II) ions and Pb (II) ions binding capacities on sponge of PEI-grafted gelatin were 65 mg g−1 and 66 mg g−1, which were more than binding capacities on the gelatin sponge (9.75 mg g−1 and 9.35 mg g−1).
In this paper, we are going to apply the adsorption properties of two sorbents: chitosan-vanillin (sorbent I) and chitosan-ortho-vanillin (sorbent II) toward the uptake of Cd (II) ion from aqueous effluents. We are investigating the equilibrium studies, kinetic and thermodynamic parameters for sorption process.
Materials and Method
Materials and Instruments
All chemical materials are prepared from commercial sources and are used as found. Vanillin (99%), ortho-vanillin (99%), Glacial acetic acid (99%), Sodium acetate anhydrous (99%), Cadmium (II) acetate dihydrate (99%), Chitosan (not less than 85% glucosamine), Ethanol (99%), Methanol (99%), Acetone (99%). are received from commercial sources and are used without further processes.
Orbital shaker (steady shake, 757), Orbital Shaker (Steady Shake, 757), Atomic Absorption Spectrophotometer (Shimadzu, AA-7000), pH meter (Metrohm, 525A) were utilized for performing experimental works. Thermal Gravimetric Analysis (temperature range from 10 to 600°C) (Exstar, TG/ DTA 7300), FTIR (IRAFFINTT-2), SEM (INSPECT S50) were used for characterization studies.
Synthesis of Chitosan-Vanillin Resins; Polymers I-II
Polymers I and II were synthesized according to procedures19,20 which prepared by mixing 5.7 g of chitosan with 90 mmol of a vanillin derivative for each polymer (polymer I and polymer II) in 90 mL of methanol and 9 mL of glacial acetic acid for 10 hour. The obtained polymer were collected and washed away with ethanol and acetone. The purified polymers were obtained after 24 h of soxhlet extraction using acetone and ethanol (1:1 ratio). Finally, the solid polymers (Beige for polymer I, yellow for polymer II) were desiccated at 70°C for 24 h.
Preparation of Buffer Solutions
A series of acetate buffer solutions were prepared from sodium acetate and acetic acid to obtain pH values ranging from 3.0 to 7.0 and checked with pH meter.
Preparing the Solutions of Metal Ion
A Standard solution from Cd(II) ion with a concentration of 1000 mg L-1 has been prepared by solving an appropriate mass of salt metal in distilled water. The working solutions of cadmium ion with (10, 20, 30, 40, 50, 75 and 150) ppm have been handled from the standard solution in distilled water.
Sorption of Cd (II) Ion Onto the Polymer Materials
The sorption behavior of the two substances has been investigated by the batch equilibrium reaction. 0.05 g of adsorbent was suspended in a 100 mL flask containing 25.0 mL of a buffer solution from (pH 3.0 – 7.0) for a period of 2 h with incessant shaking to equilibrate. Then, 25.0 mL of 150 mg L-1 of a cadmium solution was added, the solutions were shaken at 30°C. To measure the effect of time on the metal ion, similar experiments were performed using different time (5, 10, 20, 30, 60, 120, 240, 480, and 1440 s). Then, each sample was filtered and measured the concentration of residual metal ions by using atomic absorption spectrophotometer (FAAS). The same tests have been measured at various values of metal ion concentrations (50, 75, 100, 125, 150, 200 and 300) mg L-1 at different temperatures of (30, 50, and 70°C). The influence of polymer dose has in addition been explored with different massed (0.01, 0.05, 0.1, 0.2, and 1.0 g) of dry polymers and applied the ideal conditions of removal process.
At equilibrium state, the amount of metal ion adsorbed, Qe (mg metal ion / g polymer), was evaluated using the following equation:
![]()
Where Co is the initial metal concentration (mg L-1) Ce is the final concentration at equilibrium. V represents the volume of solution (L), and W is the mass of dry polymer used (g). For the sorption experiments, the value of metal ion removed at several intervals was also studied using the equation:
![]()
Where, Ct (mg L-1) is the metal ion concentration in liquid at diverse periods of time “t”.
Results and Discussion
Preparation and characterization of the two polymers
The Schiff-based sorbents containing imine group are prepared by the reaction of primary amine with carbonyl group. In this study, chitosan represents the primary amine in order to react with vanillin to form polymer I or with o-vanillin to give polymer II.
The obtained surface area of chelating materials can be found in our previous study.20 The formation of imine group was confirmed using IR spectra and it was between (1630-1640 cm-1).21 IR spectra of the two polymers revealed that hydroxyl bands and imine became less intense, sharper and changed to lower frequency which indicates that the binding with cadmium ion occurs across these sites. The strong broad band between 3300 -3500 cm-1 is assigned to the intramolecular hydroxyl stretching vibrations that evidently merged with N-H expansion groups. The bands in the area 3040-3060 cm-1 appeared in the spectra of polymers I and II are assigned to C-H stretching vibrations, where as the peaks allocated between 2870-2960 cm-1 are attributed to the broadness of the aliphatic C-H. The confirmation of the imine (C=N) formation was represented between 1630-1640 cm-1.20
TGA investigation revealed that the polymers had higher degradation temperatures than pure chitosan which may indicate that the imine group with phenolic aromatic rings enhances the thermal stability of the modified chitosan polymers and leads to more firm structures.
SEM micrographs of the two polymers show that the Cd (II)-loaded polymers surface morphology had been changed by sorption of cadmium ion from fractured to less cracked surface, which points out that toxic metal sorption is resulting a physically powerful interaction involving the binding sites of sorbents and metal ions.22
Effect of pH on Cd(II)
The removal progression of toxic metals onto diverse types of adsorbents is pH influenced. The solution acidity powerfully affects on the solubility of ions as well to the characteristics of adsorbent matters. It is well known that point of zero charge (pHPzc) is very essential to describe the interaction among sorbent and solute, so in this study (pHPzc) was applied by using the drift method.23 Chitosan has a pHPzc at 7.6, whereas chitosan-vanillin (Polymer I) sorbent has its value at pH 6.4. Also, chitosan-ortho-vanillin (Polymer II) has its value at pH 5.0. With increase in pH, the surface charge of the sorbent becomes more negatively and sorbs more cations.
This study examined the influence of pH on cadmium uptake onto polymers I and II at pH ranging from 3-7 using continuous shaking at 30°C with an initial concentration equal 40 mg L-1. The results revealed that Cd(II) hydrolysis increases by increasing of pH value. Fig (1) shows the pH- adsorption outlines of polymers I and II. Table (1) shows that the Cd(II) ions uptake increases with pH values increase and attains the highest values at pH 6. At this pH value, the hydroxyl groups can easily lose its protons and turn into negative charge. While, the imine groups’ lone pairs would be more available for binding with Cd ion and therefore, more removal can be occurred.
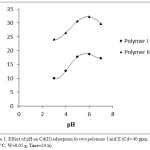 |
Figure 1: Effect of pH on Cd(II) adsorption by two polymers I and II (Cd= 40 ppm, T=30°C, W=0.05 g, Time=24 h). |
In the acidic solution, ionic species are found with 2 or 3 positive charges. In case of low pH value, Cd(II) ions can compete toward the binding sites compared with the hydrogen ions. Therewith, in case of high pH value the metal ion turns into an oxide that doesn’t have any charge and its interaction could be decreased by adsorbents.24
Table 1: Adsorption of pH on Cd(II) adsorption on two polymers I and II.
| pH |
Qe (mg g-1) of polymer I |
Qe (mg g-1) of polymer II |
| 3 |
9.9665 |
23.956 |
| 4 |
12.6799 |
26.389 |
| 5 |
17.6945 |
30.553 |
| 6 |
18.6692 |
32.211 |
| 7 |
17.178 |
29.5923 |
Influence of Cd(II) Ion Concentration and Isothermal Study
The initial concentration of the metal ion in any solution represents the driving force that enables the system to overcome the resistance of mass transport by transferring the metal ions from the solution to the solid phase. This is what happens during the adsorption process.
Table (2) shows the results of the effect of initial Cd (II) ion concentration on the efficiency of adsorption. In this study, the initial concentration of Cd (II) was ranging from (10–150) mg L-1 at agitation time 2 h with 0.05 g adsorbent mass. The results show that with the increase of Cd (II) ion initial concentrations from 10 to 150 mg L-1, the removal capacity of Cd (II) ion by polymers I and II increased from 9.50 to 20.52 mg g-1 and from 9.80 to 49.69 mg g-1, respectively Fig (2).
Table 2: Adsorption of Cd(II) on polymers I and II at different concentrations.
|
Polymer I |
Polymer II |
|||||
|
C0 (mg L-1) |
Ce (mg L-1) |
Qe(mg g-1) |
R% |
Ce (mg L-1) |
Qe(mg g-1) |
R% |
|
10 |
0.50 |
9.50 |
94.97 |
0.20 |
9.80 |
97.99 |
|
20 |
4.67 |
15.33 |
76.67 |
1.47 |
18.53 |
92.63 |
|
30 |
13.69 |
16.31 |
54.37 |
4.16 |
25.84 |
86.12 |
|
40 |
22.59 |
17.41 |
43.52 |
7.03 |
32.97 |
82.43 |
|
50 |
31.04 |
18.96 |
37.91 |
11.97 |
38.03 |
76.07 |
|
75 |
56.56 |
18.44 |
24.59 |
28.11 |
46.89 |
62.52 |
|
150 |
129.48 |
20.52 |
13.68 |
100.31 |
49.69 |
33.13 |
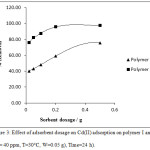 |
Figure 2 : Effect of initial concentration on polymers I and II. |
Explained these results that in case of constant adsorbent mass, when Cd (II) ion concentration increases it takes up more binding sites onto both polymers surface. Also increase of initial concentration leads to increase of the driving force which overcomes the mass transfer resistance of Cd (II) ion between aqueous and solid phases, which may lead to increasing of collisions between Cd (II) ion and the surface of each polymer. Increasing the adsorption capacity by increasing the concentration of Cd (II) ion can result from increased interaction density between the surface of each polymer and Cd (II).25
On contrast, the results also have showed that the total removal percentage is decreased when the initial solute concentrations are increased. When the initial concentration of Cd (II) changed from 10 to 150 mg L-1, the removal efficiency percentage decreased from 94.97 to 13.68 % for polymer I and from 97.99 to 33.13 % for polymer II. It is suggested that the metal removal depends on the initial metal ions concentration because it is proven that at high concentrations the available sites for absorption are low compared to metal ions.
The researcher investigated the experimental data of Cd (II) ion adsorption onto polymers I and polymer II using a linear plot of Langmuir, Freundlich, and Temkin isotherm models.26 The Langmuir equation 3:
Ce/Qe = 1/ (Q0 KL) + Ce/Q0 (3)
where Qe (mg g−1) is the amount of investigated species adsorbed per unit mass of adsorbent, Ce (mg L−1) is the equilibrium concentration of ionic species, and Q0 is the highest sorption capability of the adsorbent (mg g−1) KL (L mg−1) represents the Langmuir equilibrium constant. The plot of 1/Qe versus 1/Ce was applied to resolve Q0 and KL and the results are tabulated in Table (2). Results showed that the most appropriate model explains the adsorption of Cd (II) is Langmuir isotherm where R2 = 0.9976 for polymer I and 0.9989 for polymer II, while the R2 values for Temkin and Freundlich isotherms are very close to Langmuir model R2 values. According to Langmuir data, polymer II has adsorption capacity (51.020 mg g-1) more than polymer I (20.704 mg g-1), and adsorption coefficient (KL) of both polymers I and II are close to each other. The result found that adsorption coefficient (KL) of polymer II is higher than (KL) of polymer I and it could be explained that the adsorption affinity is more convenient for metal ions with polymer II than polymer I. This may be due to the more positive sorption power of Cd (II) with polymer II than polymer I, which reveals that not every binding site could be accessible for Cd (II) ions with polymer I even with more surface area because of its larger hydration energy.27 The BET surface area of polymers I and II are estimated to be 7.570 m2 g-1 and 2.704 m2 g-1, respectively. Whereas the total pore volume for polymer I is 0.6438 cm3 g-1 and for polymer II is 0.2721 cm3 g-1.
Table 3: Langmuir, Freundlich and Temkin isotherm models.
|
|
Langmuir isotherm |
Freundlich isotherm |
Temkin isotherm |
|||||||
|
Q0 (mg g-1) |
KL (L mg-1) |
RL |
R² |
KF (mg g-1)( mg L-1)1/n |
n |
R² |
B (J mol-1) |
A (L g-1) |
R² |
|
| Polymer I |
20.704 |
0.3329 |
0.0852 |
0.9976 |
11.264 |
7.402 |
0.934 |
1.928 |
374.899 |
0.9642 |
| Polymer II |
51.020 |
0.3350 |
0.0848 |
0.9989 |
16.990 |
3.584 |
0.9545 |
7.104 |
14.317 |
0.9867 |
According to the influence of the separation factor ( RL) the average values of RL were indicated to be between 0 < RL< 1, which indicates a sign suggesting the Cd(II) ion uptake by the polymers is a good process.
The Freundlich isotherm model is displayed in equation 4:
![]()
Table (2) reveals that KF that reflects the capacity of adsorption, and 1/n values show that the adsorption process is acceptable indicating that Cd(II) ion removal is enhancing in both polymers used in the study, particularly with polymer II.
The Temkin isotherm model is expressed in equation 5:
Qe = B ln A + B ln Ce (5)
The adsorption process by the two polymers could be explained using Temkin isotherm model which suggests that the energy of adsorption decreased as a result of surface coverage by metal ions increased and the sorption process can be visualized by the regular distribution of the binding energies to a maximum, while the heat of adsorption (B) equals 1.928 and 7.104 J mol-1 for polymers I and polymer II, respectively, on the other hand the maximum binding energy (A) equals 374.899, and 14.317 L g-1, respectively.
Generally, the calculated parameters of Langmuir, Freundlich and Temkin models confirm that Cd(II) ion adsorption onto the two polymers surfaces is a favourable process.28 The studied sorbents revealed higher adsorption capacity to Cd(II) ion comparing to other sorbent materials.
In the study of,29 the maximum adsorption capacity for Cd(II) was 200 mg g−1, as obtained from the Langmuir isotherm. The equilibrium studies of30 showed that Cd(II) adsorption followed Langmuir model. The maximum adsorption capacity for Cd(II) was estimated to be 120 ± 1 mg g-1, which demonstrated CSTU has high adsorption efficiency toward the studied metal ions.31 reported that Langmuir model gave better fit of equilibrium data among adsorption isotherm models.
Effect of Adsorbent Mass
Effect of adsorbent dosage on Cd (II) adsorption on polymer I and II Is demonstrated in Fig (3). Results show that the removal percentage increases with the increase of adsorbent mass. This increase contributed to increased extra adsorption sites availability for metal ions32 It is shown that polymer II has the higher removal effectiveness over the polymer I especially at high concentration.
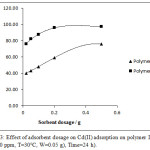 |
Figure 3: Effect of adsorbent dosage on Cd(II) adsorption on polymer I and II. (Cd= 40 ppm, T=30°C, W=0.05 g), Time=24 h). |
When the adsorbent mass increases, the metal ions uptake capacity (Qe) for each unit of sorbent mass tends to decrease. This is due to the low use of sorbent adsorption sites at the upper mass, which may result from overlapping or aggregation of potential absorption sites, resulting in an increase in propagation pathway and reduction of the area available for absorption. In addition, the results showed in Table (3) that the maximum removal of Cd (II) ion was 75.82% for polymer I and 97.49% for polymer II in a mass of 0.05 g. Previous results can be explained by the chemical composition of the second polymer. The metal ion can be strongly suspended across two locations (N, O) at the same time which certainly affects the complex stability obtained.33
Table 3: Adsorbent dosage on Cd(II) adsorption.
| Polymer mass g |
% Removal of polymer I |
% Removal of polymer II |
|
0.02 |
40.11 |
76.11 |
|
0.05 |
43.15 |
82.39 |
|
0.1 |
48.18 |
87.36 |
|
0.2 |
59.00 |
95.83 |
|
0.5 |
75.82 |
97.49 |
Influence of sorption period and kinetic analysis
Fig (4) shows that the influence of absorption time on cadmium ion taken away until there is ultimately rapid uptake by polymer I and II. The rate was high at the beginning due to the presence of empty binding sites on the surface of the adsorbents and the high electrostatic attraction.34 There was gradual expansion in the absorption of Cd (II) ion and achieved equilibrium in 8 hours (92% – 94%) that reflected the occupation of active sites remaining on the adsorbent surface.
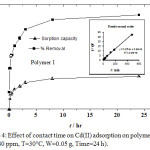 |
Figure 4: Effect of contact time on Cd(II) adsorption on polymer I and II. (Cd= 40 ppm, T=30°C, W=0.05 g, Time=24 h). |
The Kinetic data were processed using two adsorption patterns; pseudo first order kinetic (equation 6) and pseudo second order kinetic model (equation 7). These models best describe the adsorption of transition metal ions onto different sorbents.19
ln (Qe − Qt) = ln Qe − k1 t (6)
![]()
The data in the table show that the experimental values of Qe, calculated from the pseudo first order model, were far from the experimental values, compared to the values calculated from the pseudo second order model. The results indicated that the experimental values were 18.227 g-1 for the polymer I and 33.214 mg-1 for polymer II. The higher correlation coefficient (R2) of the pseudo second-order kinetic model indicates that the experimental data is appropriately controlled by a chemisorption process.
Table 4: Kinetic constant for Pseudo-first order and Pseudo-second order for the adsorption of Cd(II).
|
|
(Qe)Exp (mg g-1) |
Pseudo first-order |
Pseudo second-order |
||||
|
(Qe)Cal (mg g-1) |
K1 (min-1) |
R12 |
(Qe)Cal (mg g-1) |
K2 (g mg-1 min-1) |
R22 |
||
|
Polymer I |
18.227 |
8.619 |
0.00523 |
0.9249 |
17.857 |
0.00315 |
0.9979 |
|
Polymer II |
33.214 |
0.6081 |
0.00230 |
0.7071 |
33.003 |
0.11406 |
0.9999 |
Influence of Temperature and Thermodynamic Investigation
The influence of temperature on the sorption of Cd (II) ion by the two polymers was examined at a temperature of 30-70°C, with an initial concentration of 40 mg L-1 as shown in Fig (5). It is clearly indicated that the adsorption process is more favorable with increasing of temperature.
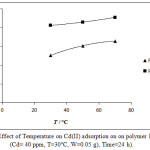 |
Figure 5: Effect of Temperature on Cd(II) adsorption on on polymer I and II. (Cd= 40 ppm, T=30°C, W=0.05 g), Time=24 h). |
The researcher calculated the values of thermodynamic parameters (Table 5) including free energy change (ΔG) of Gibbs, heat content change (ΔH) and entropy change (ΔS). using equation 8 where KL (L mol-1) is Langmuir constant and Mw (g mol-1) is Molecular weight of adsorbate.35
![]()
Table 5: Thermodynamic parameters for the adsorption of Cd(II) for two polymers at different temperatures.
|
|
∆H (KJ mol-1) |
∆S (J mol-1 K -1) |
∆G ( KJ mol-1) |
||
|
T= 30 °C |
T= 50 °C |
T= 70 °C |
|||
|
Polymer I |
13.839 |
45.972 |
-0.0292 |
-1.171 |
-1.850 |
|
Polymer II |
16.256 |
66.033 |
-3.869 |
-4.839 |
-6.541 |
The negativity of Gibbs-free energy change indicates the sorption is rapid, possible and spontaneous at the three temperatures used in the study. Positivity of ∆H values confirms that the removal process is endothermic in nature. The positive values of ∆S confirm the increase of randomness liquid-solid interface.
Conclusion
Schiff base materials were synthesized through condensation reaction of chitosan and 2 vanillin derivatives. The structure of the achieved polymers was confirmed by different spectroscopic methods with improved surface area and thermal stability. The parameters of Langmuir, Freundlich and Temkin models confirm that Cd (II) ion adsorption onto the two polymers surfaces is a favorable process. The studied sorbents revealed higher adsorption capacity to Cd (II) ion comparing to other sorbents. The pseudo second-order kinetic model indicates that the experimental data is appropriately controlled by a chemisorption process. The removal process is spontaneous and endothermic in nature and Langmuir isotherm model represented the most suitable for the experimental data and the maximum adsorbing capacity was 20.704 mg g-1 and 51.020 mg g-1 for polymers I and II, respectively. The study results indicate that investigated polymers are efficient adsorbent for toxic metal ions removal from wastewater.
Conflict of Interest
There is no conflict of interest.
Acknowledgments
Author wishes to acknowledge Imam Abdulrahman Bin Faisal University for providing facilities, and encouragement.
Reference
- Pedro-Monzon’s, M.; Solera, A; Ferrer, J.; Estrela, T.; Paredes-Arquiola, J. J. Hydrol. 2015, 527, 482–493.
- Hanasaki, N.; Fujimori, S.; Yamamoto, T.; Yoshikawa,S.; Masaki, Y.; Hijioka,Y.; Kainuma, M.; Kanamori , Y.; Masui, T.; Takahashi, K.; J. Hydrol. Earth Syst Sci. 2013, 17, 2391-2013.
- Han, D.; Currell, M.J.; Cao, G. J. Environ. Pollut. 2016, 218, 1222–1233.
- Kummu, M.; Ward, P.J.; Moel, H.; Varis, O. J. Environ. Res. Lett. 2010, 5, 1-10.
- Angelakis A.N.; Zheng X.Y. J. Water. 2015, 7, 455–463.
- Salgot, M.; Oron, G.; Cirelli, G.L.; Dalezios, N.R.; Díaz A.; Angelakis, A.N. CRC Press, 2016, 2, 263–280.
- Mahmoud, A.; Hoadley, A.F.A. J. Water Res. 2012, 46, 3364–3376.
- Cheng, Z.; Wu, Y.; Wang, N.; Yang, W.; Xu,T. J. Ind. Eng. Chem. Res. 2010, 49, 3079-3087.
- Gao, J.; Sun, S. P.; Zhu, W.P.; Chung, T.S. J. Water Res. 2015, 63, 252-261.
- El-Samrani, A.G.; Lartiges, B.S.; Villieras, F. J. Water Res. 2008, 42, 951-960.
- Zhou, D.; Zhang, L.; Zhou, J.; Guo, S. J. Water Res. 2004, 38, 2643-2650.
- He. J.; Cai. X.; Chen. K.; Li. Y.; Zhang. K.; Jin, Z.; Meng, F.; Liu, N.; Wang, X.; Kong, L.; Huang, X.; Liu, J. J. Colloid Interface Sci. 2016, 484, 162-172.
- He, J.; Zhang, K.; Wu, S.; Cai, X.; Chen, K.; Li, Y.; Sun, B.; Jia, Y.; Meng, F.; Jin, Z.; Kong, L.; Liu, J. J. Hazard. Mater. 2015, 303, 119-130.
- Matović, V.; Buha, A.; Bulat, Z.; Dukić-Ćosić, D. J. Arh Hig Rada Toksikol. 2011, 62, 65-76.
- Cuypers, A.; Plusquin, M.; Remans, T.; Jozefczak, M.; Keunen, E.; Gielen, H.; Opdenakker, K.; Nair, AR.; Munters, E.; Artois, TJ.; Nawrot, T.; Vangronsveld, J.; Smeets, K. J. Biometals. 2010, 23, 927–940.
- Wang, B.; Shao, C.; Li, Y.; Tan, Y.; Cai, L. J. Curr. Med. Chem..2012, 19, 2611-2620.
- Luparello, C.; Sirchia, R.; Longo, A. J. Cri. Rev. Toxicol. 2011, 41, 75-82.
- Li, B., Zhou, F., Huang, K., Wang, Y., Mei, S., Zhou, Y., & Jing, T. Highly efficient removal of lead and cadmium during wastewater irrigation using a polyethylenimine-grafted gelatin sponge. J. Sci Rep. 2016. 6, 33573.
- Al-Shahrani, H.; Alakhras, F.; Al-Abbad, E.; AL-Mazaideh, G.; Hosseini-Bandegharaei, A.; Ouerfelli, N. J. Global NEST. 2018, 20. In press.
- Alakhras, F; Al-Shahran, H; Al-Abbad, E; Al-Rimawi, F; Ouerfelli, N. J. Pol. Environ. Stud. 2019, 28, 1-12.
- Shukla, S.K.; Mishra, A.K.; Arotiba, O.A.; Mamba, B.B. J. Int. J. Biol. Macromol. 2013, 59, 46-58.
- Al Hamouz, O. C. S. Synthesis and characterization of a novel series of cross-linked (phenol, formaldehyde, alkyldiamine) terpolymers for the removal of toxic metal ions from wastewater. ARAB. J. SCI. ENG. 2016, 41, 119-133.
- Khan, M.N.; Sarwar, A. J. SURF. REV. LETT.2007,14, 461-469.
- Ramos, L.R.; Jacome, L.A.; Barron, M.J.; Rubio, F.L.; Coronado, R.M. J. Hazard. Mater. 2002, 90, 27-38.
- Eser, A.; Tirtom, N.; Aydemir, T.; Becerik, S.; Dinҫer, A. Chem Eng J. 2012, 210, 590-596.
- Ibrahim, M.B.; Sani, S. J. Phys. Chem. 2014, 4, 139-146.
- Shshmohammadi-Kalalagh, S.; Babazadeh, H.; Nazemi, A.H.; Manshouri, M. J. Environ Sci. 2011, 9, 243-255.
- Dada, A.O.; Olalekan, A.P.; Olatunya, A.M.; Dada, O. J. Applied Chemistry. 2012, 3, 38-45.
- Xu, L.; Chen, J.; Wen, Y.; Li, H.; Ma, J.; Fu, D. J. DESALIN WATER TREAT. 2016, 57, 8540-8548.
- Monier, M.; Abdel-Latif, D. A. J. Hazard. Mater. 2012, 209, 240-249.
- Madala, S.; Nadavala, S. K.; Vudagandla, S.; Boddu, V. M.; Abburi, K. Arab. J. Chem. 2017, 10, S1883-S1893.
- Altun, T.; Pehlivan, E. Removal of Copper(II) Ions from Aqueous Solutions by Walnut-, Hazelnut- and Almond-Shells. J. Clean. 2007, 35, 601-606.
- Ngah, W. S.W.; Fatinathan, S. J. Environ. Sci. 2010, 22, 338-346.
- Maleki, A.; Pajootan, E.; Hayati, B. J. Taiwan Inst. Chem. Eng. 2015, 51, 127-134.
- Tran, H.N.; You, S.J.; Hosseini Bandegharaei, A.; Chao, H.P. J. Water Res. 2017, 120, 88-116.

This work is licensed under a Creative Commons Attribution 4.0 International License.
![]()
A New Edition of Web of Science
Journal Impact Factor
2022: 0.5
Five Year: 0.8
Journal is Indexed in

Cabells Whitelist
![]()


