Caffeine Adsorption by Fique Bagasse Biochar Produced at Various Pyrolysis Temperatures
Yaned Milena Correa-Navarro*1,2 , Juan Carlos Moreno-Piraján2, Liliana Giraldo3 and Paola Rodríguez-Estupiñan2
1Research Group in Environmental Studies in Water and Soils. Department of Chemistry, University of Caldas, Calle 65 No. 26-10, Manizales, Colombia.
2Group of Porous Solids and Calorimetry. Department of Chemistry, University of the Andes, Cra 1a No. 18A-10, Bogotá D.C., Colombia.
3Calorimetry group. Department of Chemistry, National University of Colombia, Cra 30 No. 45-03, Bogotá D.C., Colombia.
Corresponding Author E-mail: jumoreno@uniandes.edu.co
DOI : http://dx.doi.org/10.13005/ojc/350205
Article Received on : 08-01-2019
Article Accepted on : 28-03-2019
Article Published : 25 Apr 2019
Biochar obtained from agricultural residues is ever more recognized as a multifunctional porous solid for multiples applications. In this study, fique bagasse biochars were produced at different temperatures and their corresponding deashing. These materials were investigated about physicochemical properties and adsorption capability of caffeine. The pH solution was an influential parameter, and it was determined that a pH =2.0 for washed biochar and pH= 6.0 for not washed biochar were the best conditions for adsorption. Langmuir, Freundlich and Redlich-Peterson isotherms models provided a good fit for the experimental data, indicating a surface and multi-layer adsorption. From the adsorption capacity at equilibrium of fique bagasse biochars it was concluded that pH-dependent interactions, hydrogen bonding and π- π stacking interaction were found to be responsible for caffeine adsorption. The results allow to visualize the biochar obtained from fique bagasse as a sustainable alternative for the waste derived from the production of the cabuya.
KEYWORDS:Aqueous Solution; Contaminant Removal; Emerging Organic Contaminant; Micropollutants; Waste Management
Download this article as:| Copy the following to cite this article: Correa-Navarro Y. A, Moreno-Piraján J. C, Giraldo L, Rodríguez-Estupiñan P. Caffeine Adsorption by Fique Bagasse Biochar Produced at Various Pyrolysis Temperatures. Orient J Chem 2019;35(2). |
| Copy the following to cite this URL: Correa-Navarro Y. A, Moreno-Piraján J. C, Giraldo L, Rodríguez-Estupiñan P. Caffeine Adsorption by Fique Bagasse Biochar Produced at Various Pyrolysis Temperatures. Orient J Chem 2019;35(2). Available from: https://bit.ly/2VjzS84 |
Introduction
The adsorbents derived from carbonaceous materials have been studied for a long time, research carried out in this area in the last two decades have shown the importance that these solids have in the treatment of contaminated environments.1 Biochars are part of this carbon rich porous materials and are defined as materials produced from the thermochemical conversion of biomass in an environment with limited oxygen2; in obtaining them, variables such as raw material, method and temperature have an important effect on product yield and as well as in composition.3 Biochars have long been used in agriculture as a soil supplement; in addition, many studies have shown promising results for the elimination of various types of molecules such as hydrocarbons, organic contaminants and some metallic ions present in municipal or industrial wastewater, which has led to the use of these porous materials in the search for new alternatives for the removal of contaminants from the water. However, these adsorptive properties have only been recognized in recent years and are comparable to those of activated carbon but biochars are cheaper and more sustainable.4
In recent decades a group of compounds called emerging contaminants (EC) have been detected in different aquatic environments at concentrations in the range 1 ng/L – 1 µg/L. This group includes different compounds such as pesticides, hormones, pharmaceuticals and personal care products, among others.5,6,7,8 These contaminants may be natural or synthetic substances that are not routinely monitored in the environment; however, they are known to have known or suspected undesirable effects on the health of humans and ecosystems. These compounds may not be completely removed from water by conventional treatments, which is why studies are required to remove these types of molecules from an aqueous phase in a novel and efficient manner.5,8,9
Caffeine (CFN) is considered an emerging pollutant, and has been found in various studies on surface water and wastewater, perhaps because it is the central nervous system stimulant most consumed worldwide, with an average of 70-76 mg/person/day. This molecule is commonly used in beverages, as an adjuvant to analgesic drugs and in anorectics.10 On the other hand, caffeine is used as an anthropogenic marker11 and has been detected at a concentration of 5.5 µg/L in the Otun river, the water supply system of Pereira city (Colombia).12
The agroindustrial process of fique fiber (Furcraea spp.) generate 15000 tons of bagasse residue per hectare. This material is left in soil, it and its leachates reach the river waters contaminating them. However, due to the physicochemical composition, which indicates that bagasse is a lignocellulosic waste biomass13, it becomes a potential substrate for biochar production.
In the search for new alternatives for the use of fique bagasse, this work aims to evaluate this biomass to production of biochar and its application in the adsorption of the emerging contaminant caffeine. For such, the porous materials obtaining from fique bagasse were used as a adsorbent in six different types. For all adsorbents optimum pH conditions were obtained and adsorption equilibrium isotherms were evaluated.
Materials and Methods
Reagents
Caffeine (CFN) was purchased from Merck in analytical purity (>99%). CFN solutions were prepared by dilution from a stock solution (1000 mg/L) to appropriate concentrations when needed. KBr (grade FTIR) was Panreac and the other chemical reagents used were analytical grade.
Biochar Preparation
Fique bagasse (FB) was collected on a farm in Aranzazu (Caldas, Colombia) after fiber extraction. The FB was dried at 100°C until constant weigh. Biomass were then pyrolyzed at three different temperatures (650, 750 y 850°C) using a horizontal furnace Thermolyne. The experiments were performed under an oxygen free atmosphere by passing nitrogen through the reactor. For each run heating rate and residence time were fixed at 1°C/min for 60 min, respectively. The biochars were left to cool, and a portion of each of the solids obtained were washed with purified water until constant pH, and dried at 120°C, so six solids were obtained. In this work, the biochars washed are labeled as BchL-650, BchL-750, BchL-850 or BchS-650, BchS-750, BchS-850 the not washed.
Biochar Characterization
The topographic and elemental analysis of biochar surface was carried out by scanning electron microscopy (SEM) using a (JEOL, JSM 6490-LV) with an X-ray scattered energy detector (EDS). Biochar samples were gold coated prior to viewing.3 Thermogravimetric analysis (TGA) was performed between 25-900°C at a heating rate of 5°C/min with a (Hitachi, TGA/STA7200). Nitrogen gas was used as an inert purge gas at flow rate of around 100 mL/min.14 The surface functional groups on the biochar were studied by Fourier transform infrared spectroscopy on a spectrometer (Shimadzu, FR-racer-100), the spectra were recorded in the 400–4000 cm-1 wavenumber range. The pellet was prepared by mixing a sample (0.1 mg each) with KBr (100 mg) in a mortar pestle and resultant mixtures were placed in an oven at 105°C for 24 h to prevent interference like water vapor or carbon dioxide molecules.15
pH was measured by preparing a suspension of 10 mg of adsorbent in 20 mL of deionized water and stirred for 24 h, after that the pH was measured with a pH meter (Hanna Instruments, HI 2211).2 The point of zero charge (PZC) of the samples was determined by mass titration method. Slurries of different mass were prepared by mixing the biochar (50-500 mg) with 10 mL of 0.1M NaCl. The pH of the slurries were measured after shaking for 48 h. Plotting the equilibrium pH as a function of solid weight a curve was obtained. The equilibrium pH at the plateau of the curve cis defined to the PZC.16
Surface acidity and basicity of biochars were determined by Boehm’s titration method. In brief, 100 mg of biochar sample were placed in a 50 mL vial with the following 0.05 N solutions: sodium hydroxide NaOH, sodium carbonate Na2CO3, sodium bicarbonate, NaHCO3, or hydrochloric acid HCl. The vials were sealed and shaken in an orbital shaker for 48 h, then 5 ml of each filtrate was taked and the excess of base and acid was titrated with HCl and NaOH, respectively. The number of acidic sites of various types was calculated under the assumption that NaOH neutralize carboxyl, phenolic, and lactonic groups, while Na2CO3 carboxyl and lactonic, and NaHCO3 only carboxyl groups. The number of surface basic sites was calculated from the amount of hydrochloric acid, which reacts with the biochar.17
Adsorption Assays: pH Effect and Isotherm
The effect of pH on CFN sorption by the biochar adsorbents was evaluated. Solutions of CFN at 100 mg/L were used at five different pH: 2.0, 4.0, 6.0, 8.0 and 10.0, pH was adjusted by addition of HCl or NaOH. Studies were performed using 5.0 mL of CFN solution and 50.0 mg of Bchs, which were placed into tubes and shaken in an orbital shaker at 200 rpm. The CFN amount were obtained from a calibration curve, using a Thermo Spectronic Genesys 5 spectrophotometer at maximum wavelength of 273 nm. All studies were carried out in triplicate.
The adsorption equilibrium was carried out using CFN solutions at concentrations from 50 to 500 mg/L at pH = 2.0 and 6.0, and shaking for 72 h. Studies were performed using 5.0 mL of CFN solutions and 50.0 mg of Bchs. The CFN amounts adsorbed at equilibrium time, Qe (mg/g) were determined from the Eq. (1).
Where Cois the initial concentration of CFN (mg/L), Ce is the concentration of CFN at equilibrium, V (L) is the volume of CFN solution and W (g) is the dry mass of Bchs.18
Adsorption Isotherm
Adsorption isotherm models are a significant approach for the interpretation of how the adsorbent such as biochars will interact and bind with the adsorbate such as CFN. Adsorption models give an idea on the adsorption capacity and play an important role in understanding the possible adsorption mechanisms.18 Several isotherms are reported in the literature and three models have been tested in this study including Langmuir (Eq. (2)), Freundlich (Eq. (3)), and Redlich-Peterson (Eq. (4)) models were used to fit experimental equilibrium data, determining their parameters and evaluating adjustment quality through determination coefficient (R2).19,20,21
Where Qe (mg/g) is the equilibrium CFN concentration in the Bchs, Ce (mg/L) is the equilibrium concentration of CFN in the aqueous phase, Qo (mg/g) is the maximum adsorption, and KL (L/g) is the Langmuir equilibrium adsorption constant. KF (L/g) is the Freundlich constant or relative sorption capacity, and n is a constant indicating adsorption intensity. KRP (L/g) and aR (L/mg) are Redlich–Peterson isotherm constants, and B is the exponent.
Sorption of Methylene Blue
Sorption ability of the biochars was performed using methylene blue (MB) solution. 25 mg of each biochar were mixed in 50 mL tubes with 12.5 mL of 20 mg/L MB solution. The slurries, blanks and experimental controls were agitated for 24 h on an orbital shaker. Measurements of MB concentrations in the filtrates were obtained by a Thermo Spectronic Genesys 5 UV–VIS spectrophotometer at a wavelength of 665 nm. The amount of MB adsorbed, (Qe), was determined by Ec. 1.22
Results and Discussion
Surface Properties
Surface Morphology (SEM-EDS Analysis)
The SEM micrograph of biochar presented in Fig. 1 [(a)-(f)] shows the heterogeneous surface and an increase in the porosity which is directly related to the increment in the pyrolysis temperature. The observed pores in these carbonaceous materials are usually large macropores, which are used for adsorbates to pass into microporous system3. Besides, SEM-EDS is a semiquantitative analytical method and could not provide a full quantitative composition of the organometallic complexes, however, calcium, potassium and magnesium can be detected by SEM-EDS in all biochars. Calcium is the most abundant chemical element found in all materials and their quantity increases when pyrolysis temperature increment. This metallic element were not uniformly distributed onto the surface of biochars and they are present because most of the minerals in biomass are not lost during the pyrolysis process and remain on biochar structure.23
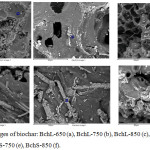 |
Figure 1: SEM images of biochar: BchL-650 (a), BchL-750 (b), BchL-850 (c), BchS-650 (d), BchS-750 (e), BchS-850 (f). |
pH, Point of Zero Charge (PZC) and Boehm Titration
Table 1 shows the results of pH, PZC and Boehm titrations. It is observed that all biochars studied in this work have alkaline character, whose value increases when the temperature augment and it can be deduced that the unwashed materials were more basic. These results are in agreement with those obtained by means of the Boehm titrations, where it was evident that there is a greater presence of basic groups in the unwashed materials than in the washed and that the quantity of these groups increased when the temperature rises in the pyrolysis process. This results are also congruent with the results found through the SEM-EDX measurements, where the alkaline metals, Calcium, Potassium and Magnesium, were detected, which correlate well with the basic character found in these materials. Regarding the presence of acid groups, it was observed that there was a decrease of them as a function of the pyrolysis temperature, which is closely related to the infrared spectra, in which there was a reduction of the bands at 3600 and 1600, characteristics of the O-H and C=O groups. All aforementioned are consistent with that reported by Suliman et al. (2016), who obtained biochars from three different biomasses at six pyrolysis temperatures and in all cases the concentration of the basic groups increased, while the presence of the acid groups decreased with the increment in the working temperature.3
Table 1: pH, PZC and variation in surface acid and total basic functional group of prepared biochars.
| Sample | pH ± 0,1 | PZC± 0,1 | Basic groups (meq/g) ± SD | Carboxylic groups (meq/g) ± SD | Lactonic groups (meq/g) ± SD | Phenolic groups (meq/g) ±SD |
| BChL-650 | 8.48 | 9.96 | 3.40 ± 0.15 | 1.36 ± 0.54 | 0.02 ± 0.01 | 0.76 ± 0.12 |
| BChL-750 | 9.19 | 10.50 | 3.81 ± 0.56 | 1.26 ± 0.50 | 0.03 ± 0.01 | 0.77 ± 0.06 |
| BChL-850 | 10.18 | 10.52 | 4.02 ± 0.42 | 1.44 ± 0.06 | 0.03 ± 0.01 | 0.78 ± 0.10 |
| BChS-650 | 11.87 | 12.94 | 4.68 ± 0.06 | 0.27 ± 0.09 | 0.01 ± 0.01 | 0.21 ± 0.04 |
| BChS-750 | 12.25 | 13.16 | 4.80 ± 0.05 | 0.19 ± 0.06 | 0.01 ± 0.01 | 0.28 ± 0.12 |
| BChS-850 | 13.51 | 13.24 | 5.88 ± 0.05 | 0.09 ± 0.04 | 0.03 ± 0.01 | 0.27 ± 0.14 |
Infrared Spectroscopy
FT-IR spectra of the biochars are shown in Figure 3. The broad band at 3400 ± 15 cm-1, which is present in all the worked materials, is a characteristic of the stretch of the hydroxyl groups that are on the surface of the adsorbents. Small peaks can also be observed at 2930 ± 10 cm-1, which may be due to the stretch of the aliphatic methylene or methyl groups, the latter confirmed by the signal at 1377 cm-1, which is associated with the stretch of the methyl group. The signal at 1630 ± 5 cm-1 corresponds to the vibration stretch of the C = O bonds. Finally, the presence of the C-O bond of the alkoxy, acyl or phenolic groups can be confirmed with the signals at 1103 ± 4 cm-1 and 1022 ± 8 cm-1.24 It was also observed in the infrared spectra that the functional groups found on the surface of the Bchs, did not change with the washing that was carried out on the materials, this was also evidenced in other studies.25
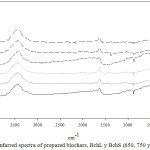 |
Figure 2: Infarred spectra of prepared biochars, BchL y BchS (650, 750 y 850) (1-6). |
Structural Characterization: Thermogravimetric Analysis
Biochar thermograms can be seen in Figure 3, which shows that the Bchs have high thermal stability and exhibits the typical degradation of them. The loss of moisture in the range of 50 – 100°C, the degradation of the functional residual groups between 100 – 350°C and finally the graphite formation above 350°C were observed. These results are consistent with other investigations on these materials.22,26
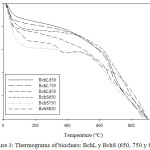 |
Figure 3: Thermograms of biochars: BchL y BchS (650, 750 y 850). |
Caffeine Adsorption Onto Prepared Biochars
Effect of Solution pH on Caffeine Adsorption
pH effect of the solution on the adsorption processes is an important factor because it makes it easy to understand the interaction between adsorbents and adsorbates, since the variation of pH can promote changes on the surface charges of the former and influence the protonation of functional groups that are on the surface of the latter.27 In the case of caffeine, at pHs below 5.5 there is a neutral species and above this pH the negatively charged species begins to appear, being fully present at pHs above 10.0.14 On the other hand, the PZC of the worked Bchs was basic (9.96-13.51), which indicates that positive charges over a wide range of pH values predominate on the surface of these materials. As seen in Figure 4, the highest values of the adsorption capacity (Qe) for the L-series biochars were observed at pH 2.0. These results agree with those reported by Portinho et al. (2017), Couto et al. (2015) and Sotelo et al. (2012), whom using different adsorbent materials, determined that caffeine was removed with greater efficiency, from aqueous acid media,11,28 which is due to the formation of hydrogen bonds between the adsorbate and the adsorbent, preferably given when the surface of the solid is positively charged.29
Mean while, for the biochars S series, the highest Qe values were observed at pH = 10.0; however, these values do not show significant differences with the results at pH = 6.0, thus indicating that the adsorption of caffeine on these biochars do not have a pronounced dependence at neutral or alkaline pH. These results are consistent with those reported by Portinho et al. (2017), who found little influence of pH in the removal of CFN when using activated carbon obtained from grape stem.11 The above mentioned results lead to infer that the CFN is retained on the Bch thanks to the interactions π – π, which can occur between the heterocyclic rings of the CFN and the aromatic rings of the Bch; likewise, hydrogen bridges can be created between the CFN and the superficial groups of the Bch. The above agrees with the results of Beltrame et al. (2018) and what has been stated by Tan et al. (2015), who concluded that in the adsorption of organic pollutants on biochar, hydrogen bonds, Van der Waals forces and π – π donor-acceptor interactions play a key role in the adsorption process.27,30 Based on the results previously exposed, it was decided to evaluate the biochar at pHs 2.0 and 6.0, which implies that the work was done on the caffeine in its neutral form.
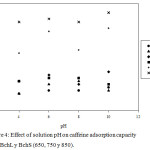 |
Figure 4: Effect of solution pH on caffeine adsorption capacity onto BchL y BchS (650, 750 y 850). |
Adsorption Isotherm
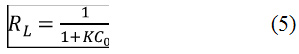
Results obtained in the investigation show that there is a difference in the amount of CFN adsorbed by the BchL (Qe (mg/g) = 1.60-9.00 and 0.40-3.60 at pH = 2.0 and 6.0, respectively) and in the BchS (Qe (mg/g) = 1.40-5.00 and 0.40-6.40 at pH = 2.0 and 6.0, respectively). However, in both cases the maximum adsorbed amount increased with the rise in temperature, which makes it possible to infer that this behavior is associated with the porosity of the materials. This correlates with the results obtained with the methylene blue test, in which the Bch 850 were the ones with the highest adsorption capacity (Figure 6), and with the results of Abdul et al. (2017), which obtained the highest adsorption of the esters of phthalic acids with a temperature rise in obtaining the adsorbent materials.26
Parameters of the used isotherm models are summarized in Table 2. The comparison of the models based on the correlation coefficient R2, made it possible to determine that for the materials worked at pH = 2.0, the models that best fit the experimental data were Freundlich and Redlich-Peterson, while at pH = 6.0 were Redlich-Peterson and Langmuir the better. This also makes it possible to both consider that the adsorption process involved mixed coverage models and infer that the surface of these materials is heterogeneous, with different sites available for adsorption, which have variable adsorption energies.31
Table 2: Parameters of Langmuir, Freundlich and Redlich-Peterson isotherms models for caffeine adsorption onto fique bagasse biochar prepared.
| Sample | pH | Freundlich | Langmuir | Redlich-Peterson | |||||||
| Kf (L/g) | n | R2 | Qo (mg/g) | K (L/mg) | R2 | KRP (L/g) | aR (L/mg) | B | R2 | ||
| BchL650 | 2.0 | 0.9633 | 3.9119 | 0.9377 | 4.4632 | 0.0318 | 0.8081 | 229358 | 209956 | 0.7676 | 0.9345 |
| BchL750 | 0.2877 | 2.0657 | 0.9538 | 7.3836 | 0.0056 | 0.9525 | 0.263700 | 0.666279 | 0.5610 | 0.9623 | |
| BchL850 | 0.4520 | 2.1442 | 0.8724 | 8.6483 | 0.0087 | 0.7594 | 1082.77 | 2395.41 | 0.5336 | 0.8725 | |
| BchS650 | 0.3587 | 2.5215 | 0.9466 | 4.7113 | 0.0094 | 0.9084 | 1.11147 | 2.81934 | 0.6182 | 0.9462 | |
| BchS750 | 0.5591 | 3.1078 | 0.9294 | 4.2788 | 0.0152 | 0.8962 | 0.782642 | 1.24046 | 0.6967 | 0.9292 | |
| BchS850 | 0.8190 | 3.3272 | 0.9468 | 5.3480 | 0.0185 | 0.9279 | 0.348880 | 0.281826 | 0.7641 | 0.9489 | |
| BchL650 | 6.0 | 0.0350 | 1.5158 | 0.9222 | 3,8096 | 0,0023 | 0,9399 | 0.008554 | 0.001334 | 1.0826 | 0.9415 |
| BchL750 | 0.0479 | 1.6379 | 0.9103 | 3,5162 | 0.0028 | 0.9342 | 0.008973 | 0.000618 | 1.2219 | 0.9404 | |
| BchL850 | 0.0605 | 1.4770 | 0.9384 | 4.5263 | 0.0068 | 0.9244 | 0.015829 | 0.001180 | 1.0990 | 0.9623 | |
| BchS650 | 0.0254 | 1,3430 | 0.9778 | 5,9300 | 0.0015 | 0.9847 | 0.087340 | 0.001605 | 0.9839 | 0,9846 | |
| BchS750 | 0.3156 | 2.5932 | 0.9264 | 4.0288 | 0.0086 | 0.9327 | 0.0076397 | 0.099996 | 0.7446 | 0.9329 | |
| BchS850 | 0.4518 | 2.2198 | 0.9302 | 9.1296 | 0.0065 | 0.9603 | 0.051611 | 0.002099 | 1.1579 | 0.9657 | |
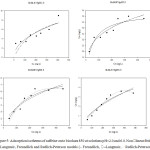 |
Figure 5: Adsorption isotherms of caffeine onto biochars 850 at solutions pH=2.0 and 6.0. Non ◰ linear fittings of Langmuir, Freundlich and Redlich-Peterson models (– Freundlich, ◰ –Langmuir, … Redlich-Peterson). |
Separation factor or equilibrium parameter (RL), a characteristic feature of the Langmuir isotherm, is a dimensionless constant, which can be used to determine whether the adsorption is favorable or unfavorable. This parameter was calculated with equation (5):
In which C0 (mg/L) was the initial concentration of CFN. In the interpretation of the RL it will be considered that the isotherm will be reversible if RL=0, linear if RL=1, favorable if 0˂RL˂1 or unfavorable if RL ˃ 1. In calculating this parameter with all the initial concentrations used of CFN, RL values between 0 and 1 were obtained. Therefore, it was concluded that the adsorption process was favorable under the conditions used in this study. Furthermore, given that the value of n obtained in the Freundlich’s model was greater than 1, it was deduced that the adsorption of CFN in the worked Bchs was favorable.
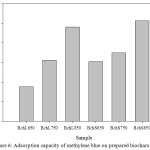 |
Figure 6: Adsorption capacity of methylene blue on prepared biochars. |
Maximum adsorption capacity (Qe) of CFN determined in this work, 9.12 mg/g, was higher than that found for normal and modified grape stem, which were 0.938 and 2.300 mg/g, respectively, and was close to the one obtained with activated carbon obtained from grape stem 19.575 mg/g.11
However, the Qe of the Bchs were lower than that found with activated carbon fibers obtained from pineapple leaves, which was 152.18 mg/g27 and the values obtained with different activated carbons prepared from Dende coconut and Babassuo coconut, 270.20 and 155.18 mg/g, respectively.28 Likewise, in the competitive adsorption of caffeine and natural organic matter by an activated carbon synthesized from peach seeds, Qe of 219.20 mg/g was obtained,14 and in another investigation with Calgon Filtrasorb 400 activated carbon, the obtained Qe was of 326.0 mg/g.32 It is expected that commercial activated carbons have better adsorption capacities than alternative adsorbents. Likewise, the importance of the chemical or physical treatments carried out on the different evaluated solids was demonstrated and changes in surface chemistry or increase in porosity were obtained, with which the adsorption of CFN was promoted.11
Conclusion
Obtained results made it possible to determine that the adsorption of caffeine with the different biochars obtained from the fique bagasse is a complex process, which depends on the adsorbent’s characteristics in terms of porosity and chemical composition. Furthermore, it was evidenced that pH is a determining factor in the elimination of this pollutant from aqueous media and that the predominant forces driving the capture of these contaminants are the formation of hydrogen bonds and the π – π interactions between the CFN and the surface groups that are present in the Bchs.
For the pHs worked in the adsorption of CFN on the fique bagasse Bchs, the model that best adjusted to the experimental data was that of Redlich-Peterson. Owing to the fact that this model is a combination of the Freundlich and Langmuir models, it can be inferred that the process involved mixed models for the adsorbent coverage.
Acknowledgements
Authors thank the Faculty of Ciencias of Universidad de los Andes for the partial funding through the project INV-2018-33-1283 and Universidad de Caldas for studies commission. The authors also appreciate the grant for the funding of research programs for Associate Professors, Full Professors, and Emeritus Professors announced by the Faculty of Sciences of the University of the Andes, 20-12-2019-2020, 2019, according to the project “Enthalpy, free energy and adsorption energy of the activated carbon interaction and solutions of emerging organic compounds”.
Conflicts of Interest
There is no conflict of interest.
References
- Kah, M., Sigmund, G., Xiao, F., Hofmann, T. Water Res. 2017, 124, 673–692.
- IBI. International Biochar Initiative. 2015.
- Suliman, W., Harsh, J. B., Abu-Lail, N. I., Fortuna, A. M., Dallmeyer, I., García-Pérez, M. Biomass and Bioenergy. 2016, 84, 37–48.
- Alhashimi, H. A., Aktas, C. B. Resour. Conserv. Recycl. 2017, 118, 13–26.
- Pal, A., He, Y., Jekel, M., Reinhard, M., Gin, K. Y. H. Environ. Int. 2014, 71, 46-62.
- Chaukura, N., Gwenzi, W., Tavengwa, N., Manyuchi, M. M. Environ. Dev. 2016, 19, 84–89.
- Yang, Y., Ok, Y. S., Kim, K-H., Kwon, E. E., Tsang, Y. F. Sci. Total Environ. 2017, 596–597, 303–320.
- Rodriguez-Narvaez, O. M., Peralta-Hernandez, J. M., Goonetilleke, A., Bandala, E. R. Chem. Eng. J. 2017, 323, 361–380.
- Huerta, B., Jakimska, A., Llorca, M., Ruhí, A., Margoutidis, G., Acuña. V., Sabater, S., Rodriguez-Mozaz, S., Barcelò, D. Talanta. 2015, 132, 373–381.
- Oestreich-Janzen, S. in Encyclopedia of Food and Health. 2016, 556–572.
- Portinho, R., Zanella, O., Féris, L. A. J. Environ. Manage. 2017, 202, 178–187.
- Arrubla, J. P., Cubillos, J. A., Ramírez, C. A., Arredondo, J. A., Arias, C. A., Paredes, D. Ing. e Investig. 2016, 36, 70–78.
- Escalante, H., Guzmán, C., Castro, L. Dyna. 2014, 81, 74–85.
- Álvarez-Torrellas, S., Rodríguez, A., Ovejero, G., Gómez, J. M., García, J. Environ. Technol. 2016, 37, 1618–1630.
- Yakout, S. M. Bioremediat. J. 2015, 19, 171–182.
- Kodama, S., Sekiguchi, H. Thin Solid Films 2006, 506–507, 327–330.
- Boehm, H. P. Univ. Munchen. 2001, 40, 145–149.
- Awad, Y. M., Lee, S-E., Ahmed, M. B., Vu, N. T., Farooq, M., Kim, I. S., Kim, H. S., Vithanage, M., Usman, A. R., Al-Wabel, M., Meers, M., Kwon, E. E.,Ok, Y. S. J. Clean. Prod. 2017, 156, 581–588.
- Langmuir, I. J. Am. Chem. Soc. 1916, 2221–2295.
- Freundlich, H. Phys. Chem. Soc. 1906, 40, 1361–1368.
- Redlich, O., Peterson, D. L. J. Am. Chem. Soc. 1958, 63, 1024–1025.
- Inyang, M., Gao, B., Zimmerman, A., Zhang, M., Chen, H. Chem. Eng. J. 2014, 236, 39–46.
- Aller, M. F. Crit. Rev. Environ. Sci. Technol. 2016, 46, 1183–1296.
- Chen, B., Chen, Z., Lv, S. A. Bioresour. Technol. 2011, 102, 716–723.
- Vardon, D. R., Moser, B. R., Zheng, W. Witkin, K., Evangelista, R. L., Strathmann, T. J., Rajagopalan, K., Sharma, B. K. ACS Sustain. Chem. Eng. 2013, 1, 1286–1294.
- Abdul, G., Zhu, X., Chen, B. Chem. Eng. J. 2017, 319, 9–20.
- Beltrame, K. K., Cazetta, A. L., de Souza, P. S.C., Spessato, L., Silva, T. L. Almeida, V. C. Ecotoxicol. Environ. Saf. 2018, 147, 64–71.
- Couto, O. M., Matos, I., da Fonseca, I. M., Arroyo, P. A., da Silva, E. A., de Barros, M. A. Can. J. Chem. Eng. 2015, 93, 68–77.
- Sotelo, J. L., Rodríguez, A., Álvarez, S., García, J. Chem. Eng. Res. Des. 2012, 90, 967–974.
- Tan, X., Liu, Y., Zeng, G., Wang, X., Hu, X., Gu, Y., Yang, Z. Chemosphere. 2015, 125, 70–85.
- Mahmoud, M. E., Nabil, G. M., El-Mallah, N. M., Bassiouny, H. I., Kumar, S-. Abdel-Fattah, T. M. J. Ind. Eng. Chem. 2016, 37, 156–167.
- Sotelo, J. L., Ovejero, G., Rodríguez, A., Álvarez, S., Galán, J., García, J. Chem. Eng. J. 2014, 240, 443–453.

This work is licensed under a Creative Commons Attribution 4.0 International License.
![]()
A New Edition of Web of Science
Journal Impact Factor
2022: 0.5
Five Year: 0.8
Journal is Indexed in

Cabells Whitelist
![]()


