Arsenic Contamination and Associated Health Risk
Astha Kumari and N. S. Maurya*
Department of Civil Engineering, National Institute of Technology Patna, Patna, India.
Corresponding Author E-mail: nsmaurya@nitp.ac.in
DOI : http://dx.doi.org/10.13005/ojc/350209
Article Received on : 07-03-2019
Article Accepted on : 04-04-2019
Article Published : 28 Apr 2019
The health risk assessment of residents consuming groundwater with high arsenic concentrations has attracted widespread concern. This study therefore is aimed at providing a framework to evaluate the risks imposed to local residents of Simaria Patti Ojha village of Bhojpur district, Bihar. Results showed that the mean values of ADD, HQ and CR were 5.1 µg/(Kg Day) (PTDI- 2.1 µg/(Kg Day), 5-17 (safe range <1) and 0.002-0.007(tolerable range, 10-6-10-4), respectively. Carcinogenic risk value was found as 4.7 × 10⁻³ around 100 times higher than safe range of 10−6–10−4, indicating high risks to the local residents. Hence, this study will help in suggesting suitable implementation measures on ground to deal with the risk of arsenic contamination and diseases caused due to its prolonged exposure.
KEYWORDS:Arsenic; Bihar; Carcinogenic Risk; Drinking Water; Risk Assessment; Semariya Ojhapatti
Download this article as:| Copy the following to cite this article: Kumari A, Maurya N. S. Arsenic Contamination and Associated Health Risk. Orient J Chem 2019;35(2). |
| Copy the following to cite this URL: Kumari A, Maurya N. S. Arsenic Contamination and Associated Health Risk. Orient J Chem 2019;35(2). Available from: https://bit.ly/2V088WP |
Introduction
Arsenic contamination in groundwater can be derived from natural1-4 as well as anthropogenic1,3,5-7 sources, such as from extraction of minerals containing arsenic compounds in the form of pyrites and sulfides, pesticides manufacturing,6,8,9 and its other medicinal uses.10,11 Arsenic mainly exists in inorganic state as arsenite (As(III)) and arsenate (As(V)) in water in the form of very toxic oxyanions.1,12-16 Arsenic contamination in groundwater has affected more than 200 million people worldwide in China, Taiwan, USA, Canada, Brazil, Hungary, Bangladesh, India, Pakistan and Mexico.5,17-29 Southeast and South Asia region alone has accounted for almost more than 100 million people at high risk of As poisoning from groundwater consumption.18,30-34
Therefore, arsenic became the global toxic contaminant, which imposes several acute or chronic risks burdens on human health.1,16,18,33 Exposure to high concentrations may lead to physiological35, morphological36,37 and biochemical38,39,40 disorders in almost all forms of living organisms. Keratosis,38-40 hyper-pigmentation,41-43 dermatological problems, gangrene, and cancer are the major life-threatening diseases.44-47 As it is well proved that it may causes cancer therefore classified as Class I carcinogen.44
Therefore, World Health Organization,48 Bureau of Indian Standards49 and Unites State Environmental Protection Agency50 has therefore set a maximum permissible limit for arsenic consumption as 0.01 mg/L. Due to highly toxic nature of arsenic contamination risks of disease like cancer has been increased to higher extent and raised up noteworthy apprehension in recent years.51-55 Arsenic contamination has various routes of reachability towards mankind such as food, water, and incidental ingestion of arsenic contaminated dust and soils are the most common routes of exposure.19,56-59 Children of age 0-6 years of age usually ingest soil very often therefore this may be an important pathway of exposure for them.36,43,52,60-64
Drinking water is considered as a significant route for arsenic exposure because in comparison with other routes of ingestion of arsenic such as dermal and soil, water ingestion rate is highest.65 Considering this emerging health and environmental threats of As from As-rich groundwater in India, it is imperative to analyze the associated health risks.
This study mainly focuses on evaluating health risk parameters of the population of Ojhapatti Village in semariya Block of Bhojpur District (the village recognized as the first case of groundwater arsenic pollution in Bihar). Historical data of drinking water contamination as well food contamination will be analyzed and correlated with the visible symptoms of arsenic poisoning. These findings, therefore, will help in implementing the sustainable management policies regarding upliftment of groundwater quality status in the study areas.
Material and Methods
Study Area
Study area for this study is Semariya Patti Ojha village in Shahpur Tehsil of Bhojpur district in Bihar, India ( latitude, 25°10″ to 25°40″ and longitude 83°45″ to 84°45″) and situated 193 meters above mean sea level. The district has been divided into three sub-divisions, comprising 14 blocks. The Ganges and the Sone forms the northern and south-eastern boundaries of the district respectively along with the rivers Chher and Banas which ultimately fall into the Ganges. The climate of the district is of moderately extreme type. The village has a maximum/minimum temperature in May (42°C) and December (10°C) with highest and lowest humidity in August (82.5%) and September (80%), respectively. The Semariya Ojhapatti village having an area of 255 hectares with a total population of 5,788 peoples, 3074 males and 2714 females (788 houses) are the sites of study for the risk assessment calculations.
Data Collection
In the present study, arsenic concentrations of deep tube wells in Ojha Patti village at different locations have obtained from the database of National Rural Drinking Water Programme (NRDWP) available online.
Risk Assessment
Among all other routes of exposure including direct ingestion (oral) through soil/water and indirect ingestion (dermal and inhalation) the oral intake of water is assumed to have greater impact.76 Health risk assessment was done by calculating average daily dose (ADD), carcinogenic risk (CR), and non-carcinogenic risk as hazard quotient (HQ).52,66-71 The calculations regarding ADD were adopted from USEPA guideline as follows50,55,63,65,72,73:
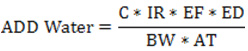
Where, C (mean concentrations of arsenic in water, mg/L), IR (ingestion rate, L/day), EF (exposure frequency, days/year), ED (exposure duration, years), BW (body weight, kg), AT (average time for non-carcinogens, days).
Hazard quotient (HQ) expressed in mg/(kg day), which signifies the non-carcinogenic risk is the ratio of the average daily dose of exposure to its corresponding reference dose (RfD-0.0003 mg/ Kg. Day) for arsenic (III).74,75 Hazard quotient for arsenic can be calculated by using following equation:
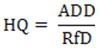
The health risk is generally said to be occur when the HQ values were >1, moderate risk for HQ ranging between 1-10 and very high risk for HQ >10.68
Carcinogenic risk(CR) can be estimated by multiplying the ADD of arsenic with their corresponding slope factors (SF).50,55,77,78
CR = (ADD *SF)
Where CR (carcinogenic risk) is unitless, ADD (average daily dose) in mg/Kg.Day, and SF(slope factor) with a value 1.5 (mg /Kg.Day)-1.
Results and Discussion
Study Area Demographic Details
In present study, we have taken arsenic concentration population and other tube well location data from NRDWP website and assumed the rest data as per suitability
[https://indiawater.gov.in/IMISReports] Shahpur block has 27 deep tube wells which was under the influence of arsenic out of which ojha patti village itself has six deep tube wells affected with arsenic. Since total number of tube wells is unknown, we have assumed that a population of 400 people is being served by these six tube wells that are affected with arsenic.
Table 1: Demographic details of the study area.
| Items | Description/Values | Reference |
| Study area | Semariya Patti Ojha village, Shahpur Tehsil, Bhojpur district, Bihar, India. | Census of India 66 |
| Total population | 5788 (3074 M, 2714 F) | |
| No. of tube wells | Unknown | NRDWP, 2017-18* |
| No. of tube wells affected arsenic | 6 | |
| Range of arsenic concentration | 0.08-0.01 mg/L | |
| Population served per tube well | 65-70 | Assumed |
| Population affected by arsenic | 400 | |
| Children 0-6 years | 94 | |
| Children 6-16 years | 69 | |
| Adult Above 16 | 231 |
*https://indiawater.gov.in/IMISReports/NRDWP_MIS_NationalRuralDrinkingWaterProgramme.html
Parameters Regarding Risk Assessment
An open and closed ended questionnaire method may be adopted to survey the visible health symptoms, including diarrhoea, gastric problems, body itching, and pigmentation on the body as health indicators and initial symptoms of arsenicosis. Personal interview regarding information about age, sex, health, economic status, dietary status, drinking water source and water intake could be done. For this study the values thus selected for respective parameters for risk calculation is listed here in tabular form along with values taken by other researchers.
Table 2: Values adopted from different sources for different risk analysis parameters.
| Parameters for risk analysis |
Value |
Reference |
| Exposure Duration for Adult ED (A) (Year) |
70 |
50, 52, 54, 79 Present study |
| Exposure Duration for Children, ED (C) (Year) |
6 |
63, 69,80 Present study |
|
5 |
81 | |
| Body Weight for Adult, BW (A) (Kg) |
70 |
50 |
|
68 |
39,54,71,82 | |
|
52 |
73Present Study | |
| Body Weight for Children, 6-16 years BW (C) (Kg) |
30 |
66Present Study |
|
24.5 |
74 | |
| Body Weight for Children, 0-6 years BW (C) (Kg) |
15 |
55,56,68,72 Present Study |
| Ingestion Rate for Water -Adult >16 years IR (A) (L/day) |
3 |
10,67,76 Present study |
|
2.9 |
9 | |
| Ingestion Rate for Water children,(6-16 years) IR (C) (L/day) |
1.5 |
10,67,76 Present study |
|
1.7 |
9 | |
| Ingestion Rate for water-Children,0-6 IR (C) (L/day) |
0.78 |
43,7,0–72,81 Present Study |
|
0.64 |
68 | |
| Average Time, AT (Day) |
ED x 365 |
10,67,76 Present study |
| Exposure Frequency, EF (Day/year) |
365 |
10,67,76 Present study |
|
182 |
80 | |
|
350 |
79 | |
| Oral Reference Dose, RfDoral (mg/Kg.day) |
0.0003(AsIII) |
76 Present Study |
|
0.000006(AsV) |
76 |
Health Risk Assessment
Health risk assessment of arsenic contaminated drinking water consumed by human beings is done via three different exposure pathways of exposure (ingestion, inhalation and dermal contact).13,67,81 Among all of the three pathways of exposure drinking water has impacted largely therefore, the oral route is considered critical.10,83 Calculations were based on guidelines by United State Environmental Protection Agency Risk Assessment Guidelines. Risk assessment will involve only oral pathway of exposure in the present study.
Average Daily Dosage (ADD)
The daily intake of total arsenic as an average daily dose (ADD) for 394 persons residing within the ojha patti village was found to be 3.18, 4.79 and 3.69 μg/ (Kg day)for age groups of 0-6, 6-16 and.>16 years respectively. USEPA had provided a provisional tolerable daily intake (PTDI) value of 2.1 μg/(Kg day) of inorganic arsenic.
The results thus obtained were compared to this PDTI value and obtained that 91 out of 94 children of age 0-6, 48 out of 59 children of age between 6-16 year and 201 of 231 adults (>16 years) were found to have ADD above this limit.78
Consuming arsenic contaminated value below the WHO permissible limit (0.01 mg/L) depicts a daily intake of 0.00037 mg/ (Kg. Day), which is below the PTDI value. However, at a concentration level of 0.01-0.05 mg/L, the average daily dose was found to be 0.00231-0.00132 mg/ (Kg. Day). Highly contaminated tube wells having an arsenic value ranging from 0.05 to 0.09 mg/L, have a very high daily dose value of 0.00591-0.00298 mg/(Kg day). Around 83% (n=321) of total residents considered in study consuming arsenic contaminated water >0.01 mg/L found to have higher ADD value than PDTI limit.
Highest ADD observed was 0.01403 mg/kg. day (for age group 0-6) which may be due to consuming water at the locations having higher arsenic contamination levels and highest in children of lower age group. The highest ADD value was estimated for tube well 1(T1), while the lowest was for fourth tube well (T4). As depicted from results obtained, adults had the lower ADD value than children, as 5.1×10⁻⁴ mg/(kg day) for adults and 4.04×10⁻⁴ mg/(kg day) for children which was higher than the reference dose limit (RfD) (3.0 × 10⁻⁴ mg/(kg day)) set by USEPA, (2012).50 As per USEPA reference dose is an estimate of exposure that could cause negligible health risk of arsenic through the whole life expectancy.
Non-Carcinogenic/Carcinogenic Risk
Hazard Quotient (HQ) is the ratio of the exposure level of each toxic to its acceptable Reference Dose (RfD). Simply, HQ is an estimate of daily arsenic exposure to individual that is likely to be without an appreciable risk of deleterious effects during a lifetime. Reference dose values for ingestion is 3.0 × 10⁻⁴ mg/(kg day).66,79,81,83 If the HQ value exceeds the value 1with one can observe noticeable adverse effects. On the contrary, no non-carcinogenic risks are expected at HQ value less than 1.83,38 HQ value >10 indicates that it can cause serious effects on health to local people.9,41,52,65
Hazard quotients (HQ) and their carcinogenic risks (CR) are tabulated in Table 3. In this, the HQ and CR value is calculated and represented on the basis of varying arsenic concentrations in contaminated tube wells which have indicated that 95% of 394 people have high average daily dosage values with 92% of residents with HQ>1. Health problems regarding to the habitations in this study area is likely to be based on the questionnaire dataset values collected from here on a personal interview basis. Carcinogenic risk (CR) can be estimated by multiplying the ADD of arsenic with their corresponding slope factors (SF=1.5 (mg/Kg. Day0)-1.67,79,83
Five out of six tube wells have arsenic concentration between 0.08-0.01 mg/L which showed remarkable variation from T1-T6. Which was a way higher than the WHO, BIS, and USEPA maximum permissible limit of 0.1 mg/L, except for only one tube well among 6 tube wells taken for this study.
Discussion on Current Status of Risk
The result showed that HQ values for all the tube wells were reportedly higher than 10 which itself describes the problem severity. Children up to 6 years of age and adults having age >16 years have shown almost similar kind of hazard quotient values indicating that children between 6-16 years of age are more vulnerable to arsenic exposure when exposed to same environment. Teenagers are at high risk due to their similar eating habits and lower body weight as compared to adults. Literature have also supported that the risk of exposure to arsenic was higher for infants, toddlers and teenagers as compared to adults.7,70–72
Table 3: Variation in carcinogenic as well as non-carcinogenic risk with varying arsenic concentration in tube wells.
| Tube well | As Concentration (mg/L) | ADD (mg/kg.d) | Risk characterization | |
| HQ | CR | |||
| 1 | 0.08 | 0.005124267 | 17.08089 | 0.007686 |
| 2 | 0.07 | 0.003662739 | 12.20913 | 0.005494 |
| 3 | 0.09 | 0.003777073 | 12.59024 | 0.005666 |
| 4 | 0.06 | 0.002296343 | 7.654478 | 0.003445 |
| 5 | 0.04 | 0.002359091 | 7.863638 | 0.003539 |
| 6 | 0.02 | 0.001613485 | 5.378283 | 0.00242 |
It was evident from the results that (Table 4) in all the sites, the carcinogenic risk was a way higher than the recommended limit of 79(10-6–10-4). In both age groups children and adult were at higher risks as the CR value is much beyond the marginal safety limit (10-4) and therefore immediate action is required in areas having arsenic concentration of 0.09mg/L. In tube wells, having mild arsenic concentration, CR value follows the same trend as previous and the possibility of cancerous disease is more and even they are more prone to other short term effects also than adults residing in those areas.
Table 4: Exposure assessment and risk characterization for As in As-enriched sites for different age group of local residents of the study area.
| Age group | Average body weightBW (Kg) | Average Daily DosageADD (mg/kg.d) | Risk characterization | |
| HQ | CR | |||
| 0-6 | 16.023 | 0.003894 | 12.9813393 | 0.005842 |
| Up to 16 | 42.522 | 0.004703 | 15.6781588 | 0.007055 |
| >16 | 65.892 | 0.003642 | 12.1410793 | 0.005463 |
Since, 0-6- and 6-16-years of consumers have considerably lower body weight than adults, and water intake rate is considerably higher as compared to body weight therefore, CR was high in them. CR<10−6 means that the residents are in the safe range, CR value greater than10−4 imparts threshold risk and CR>10−3, depicts a substantial risk. While calculating and assessing human health risk, oxidation state of arsenic and its availability in sources are the very important factors as different arsenic species have different levels of venomousness and bioavailability in water.38,83 Comparing CR value of arsenic among other age groups to the USEPA provided values indicated that all age group had very high values of CR even higher than 10−3 (Table 4).
On this basis of these data thus obtained, it is predicted that almost 86 % people in the study village are residing in areas where more than 99 % of groundwater obtained from tube wells contain arsenic concentrations above the WHO recommended limit of 10 ppb of arsenic in drinking water. Mean hazard index value was calculated by adding individual values of hazard quotients and found to be 11, indicating that the residents of this locality may experience very high and negative non-carcinogenic health effects.
Conclusion
A maximum ADD value of 5.1 µg/(Kg Day) was obtained which is higher than the permissible tolerable daily intake value (PTDI- 2.1 µg/(Kg Day)) provided by USEPA. Now this average daily dose is the main cause of the potential health risks among persons consuming water with elevated level of arsenic concentrations above 0.01 mg/L. Both, infants and adults have a similar trend of non-carcinogenic risk values, in areas having same arsenic levels. It could be easily analyzed and observed that, both the age groups have similar average daily dosage versus body weight ratio as compared with teenagers. This is may be due to lower body weight and comparatively higher water ingestion rate in children of 0-6 years of age. Now the children’s in the age group 6-16 year have a daily intake as an adult and a body weight comparatively lower than adults. Further research regarding practical significance and implementation of these risk studies on ground would be required to understand the long-term exposure assessment in order to take suitable preventive measures to deal with this problem. Results of this study requires the study regarding historical data of places having elevated arsenic levels and their progress in terms of present versus past two or three decade status of actual observed risks symptoms in these areas.
Conflict of Interest
No any conflict of interest with any person and organization.
Acknowledgements
Current work is supported by the National Institute of Technology Patna, India as a part of PhD work.
References
- Shankar, S.; Shanker U,; Shikha. Sci. World J. 2014,304-324.
- Bundschuh, J.; Litter, M.; Ciminelli, V. S. T.; Morgada, M. E.; Cornejo, L.; Hoyos, S. G.; Hoinkis, J.; Alarcón-Herrera, M .T.; Armienta, M. A.; Bhattacharya, P. Water Res. 2010, 44(19),5828-5845.
- Mondal, P.; Bhowmick, S.; Chatterjee, D.; Figoli, A.; Van-der-Bruggen B. Chemosphere. 2013, 92(2),157-170.
- Villaescusa, I.; Bollinger, J. C.; Rev. Env. Sci. Biotechnol. 2008,7, 307-323.
- Matschullat, J. Sci. Total Environ. 2000, 249(1-3),297-312.
- Smedley, P. L. Arsen. Groundw. a World Probl. 1993,1-34.
- Kumar, C. P. Int. J. Earth Environ. Sci. 2015,1(1), 1-10.
- Miraglia, M.; Marvin, H. J.P.; Kleter, G. A.; Battilani, P.; Brera, C.; Coni, E.; Cubadda, F.; Croci, L.; De Santis, B.; Dekkers, S.; Filippi, L.; Hutjes, R.W.A.; Noordam, M. Y.; Pisante, M.; Piva, G.; Prandini, A.; Toti, L.; Vanden-Born, G. J.; Vespermann, A. Food Chem. Toxicol. 2009,47(5),1009-1021.
- Rasheed, H.; Kay, P.; Slack. R.; Yun, Y.; Carter, A. Sci. Total Environ. 2017,631-641.
- Sharma, V.K.; Sohn, M. Environ. Int. 2009, 35(4),743-759.
- Mandal, B. K.; Suzuki, K.T. Talanta. 2002,58(1),201-235.
- Nickson, R.T.; Mcarthur, J.M.; Ravenscroft, P.; Burgess, W. G.; Ahmed, K.M. Appl. Geochemistry. 2000,15(4),403-413.
- Nicomel, N. R.; Leus, K.; Folens, K.;Vander-Voort, P.; Du-Laing, G. Int. J. Environ. Res. Public Health. 2015,13(1),1-24.
- Sarkar, A.; Paul, B. Chemosphere. 2016,158,37-49.
- Sun, H.J.; Rathinasabapathi, B.; Wu, B.; Luo, J.; Pu, L.P.; Ma, L.Q. Environ. Int. 2014,69,148-158.
- Singh, R.; Singh, S.; Parihar, P.; Singh, V.P.; Prasad, S.M. Ecotoxicol. Environ. Saf. 2015,112,247-270.
- Phung, D.; Connell, D.; Rutherford, S.; Chu, C. Chemosphere. 2017,177,167-175.
- Bhaumik, M.; Noubactep, C.; Kumar, V.G.; Mccrindle, Rob. I.; Maity, Arjun. Chem. Eng. J. 2015,271,135-146.
- Chibban, M.; Zerbet, M.; Carja, G.; Sinan, F. J. Environ. Chem. Ecotoxicol. 2012,4(5),91-102.
- Hering, J.G.; Katsoyiannis, I.A.; Theoduloz, G.A.; Berg, M.; Hug, S.J. J. Environ. Eng. 2017,143,1-9.
- Mohan, D.; Pittman, C.U. J. Hazard. Mater. 2007,142(1-2),1-53.
- Figoli. A.; Cassano, A.; Criscuoli, A.; Mozumder, M.S.I.; Uddin, M.T.; Islam, M.A.; Drioli, E. Water Res. 2010,44(1),97-104.
- Avilés, M.; Garrido, S.E.; Esteller, M.V.; De-La-Paz, J.S.; Najera, C.; Cortés, J. J. Environ. Manage. 2013,131,103-109.
- Baig, S.A.; Sheng, T.; Hu, Y.; Xu, J.; Xu, X. Clean – Soil, Air, Water. 2015, 43(1),13-26.
- Bulut, G.; Yenial, Ü.; Emiroʇlu, E.; Sirkeci, A.A. J. Clean. Prod. 2014, 84(1), 526-532.
- Halem, V.D.; Bakker S.; Amy G.L.; Dijk V.J.C. Drink. Water Eng. Sci. 2009, 2(1), 29-34.
- Ng K.; Ujang Z.; Le-clech P. Rev. Environ. Sci. Bio/Technology. 2004,3,43-53.
- Jain, C.K.; Singh, R.D. J. Environ. Manage. 2012,107,1-18.
- Sidhu, M.S.; Desai, K.P.; Lynch, H.N.; Rhomberg, L.R.; Beck, B.D.; Venditti, F.J. Toxicology. 2015,331,78-99.
- Chakraborti, D.; Rahman, M.M. Paul, K. Talanta. 2002,58(1),3-22.
- Kanel, S.R.; Greneche, J-M.; Choi, H. Environ. Sci. Technol. 2006,40,2045-2050.
- Shahid, M.; Khan, N.; Dumat, C. Environ. Pollut. 2018,242,307-319.
- Islam, K.; Haque, A; Karim, R; Fajol, A.; Hossain, E.; Salam, K.A. Ali, N.; Saud, Z.A.; Rahman, M.; Rahman, M.; Karim, R.; Sultana, P.; Hossain, M.; Akhand, A.A.; Mandal, A.; Miyataka, H.; Himeno, S.; Hossain, K. Environ. Hea.l A Glob. Access. Sci. Source. 2011,10(1),1-11.
- MoWR, Ministry of Water Resources, Government of India. 2014,160.
- Navoni, J.A.; Pietri, D.; Olmos, V.; Gimenez, C.; Mitre, G. B.; Titto, E.; Lepori, E.C. Villaamil. Sci. Total. Environ. 2014,499,166-174.
- Saha, J.C.; Dikshit, A.K.; Bandyopadhyay, M.; Saha, K.C. Crit. Rev. Environ. Sci. Technol. 1999,293(293),37-41.
- Ahamed, S.; Kumar, S.M.; Mukherjee, A.; Amir Hossain, M.; Das, B.; Nayak, B.; Pal, A.; Mukherjee, S. C.; Pati, S.; Dutta, R.N.; Chatterjee, G.; Mukherjee, A.; Srivastava, R.; Chakraborti, D. Sci, Total. Environ. 2006,370(2-3),310-322.
- Choong, T.S.Y.; Chuah, T.G.; Robiah, Y.; Gregory, K.F.L.; Azni I. Desalination. 2007, 217(1-3), 139-166.
- Jain, C.K.;Ali, I. Water. Res. 2000;34(17):4304-4312.
- Rahman, M.A.; Rahman, A.; Kaiser, M.Z.; Renzaho, A.M.N. Ecotoxicol. Environ. Saf. 2018,150(January),335-343.
- Li, R.; Liu, Y.K.W.; Enmin, C.J. Environ. Geochem. Health. 2018, 40(4), 1585-1599
- Thirunavukkarasu, O.S.; Viraraghavan, T.; Subramanian, K.S.; Islam, M.R. Energy Sources. 2007, 27(1-2), 209-219.
- Pokkamthanam, A.S.; Riederer, M.; Anchala, R. 2011;1(1).
- IARC. IARC Monogr. 2004,84, 41-267.
- Muhammad, S.; Shah, M.T.; Khan, S. Food Chem. Toxicol. 2010, 48(10), 2855-2864.
- Chakraborti, D.; Rahman, M.M.; Ahamed, S. Environ. Sci. Pollut. Res. 2016,9492-9504.
- Ungureanu, G.; Santos, S.; Boaventura, R.; Botelho, C. J. Environ. Manage. 2015;151:326-342.
- WHO. Guidelines for Drinking-water Quality. In: WHO Library. Vol 1.; 2008.
- BIS. IS 10500 (2012). Drinking water. Bur. Indian Stand. 2012, II(May),1-3.
- USEPA, United State Environment Protection Agency. USEPA. 2012,152.
- Chen, Y.; Huang, B.; Hu, W.; Weindorf, D.C.; Liu, X.; Niedermann, S. Sci Total Environ. 2014, 470-471,1140-1150.
- Huy, T.B.; Tuyet-Hanh, T.T.; Johnston, R.; Nguyen-Viet H. Int. J. Environ. Res. Public Health. 2014, 11(8),7575-7591.
- Shakoor, M.B.;Nawaz R.; Hussain, F.; Raza, M.; Ali, S.; Rizwan, M.; Oh, S.E.; Ahmad, S. Sci. Total Environ. 2017,601-602,756-769.
- Zhang, W.; Guo, Z.; Song, D.; Huang, D.; Yang, J, Du, S.; Zhang, L. Environ. Pollut. 2017,222,118-125.
- USEPA. Guidelines for Exposure Assessment. 1992, 57(5), 22888-22938.
- Joseph, T.; Dubey, B.; Mcbean, E.A. Sci. Total Environ. 2015, 527-528, 552-560.
- Sharma, A.K.; Chr, J.; Sloth, J.J.; Holm, P.E. Appl. Geochemistry. 2014, 41, 11-33.
- Mondal, D.; Polya, D.A. 2008, 23(11), 2987-2998.
- Tsuji, J.S.; Garry, M.R.; Perez, V.; Chang, E.T. Toxicology. 2015,337,91-107.
- Morisset, T.; Ramirez-Martinez, A.; Wesolek, N.; Roudot, A.C. Environ. Int. 2013;59:431-441.
- Khurana, I.; Sen, R.; Water aid. 2008, (288701), 31.
- Tiankao, W.; Chotpantarat, S.; J. Hydrol. Reg. Stud. 2018, 19, 80-96.
- USEPA. Volume I. Human health evaluation manual (HHEM). Part E. 2004. (US EPA 2004;1(540/R/99/005):1-156.
- Biswas, A.; Das, A.; Deb, D.; Ghose, A.; Nath, D.; Mazumder, G. Stoch. Environ. Res. Risk Assess. 2018, 32(4), 1035-1050.
- USEPA. Expsure Factors Handbook : 2011 Edition. EPA/600/R-09/052F
- Barton, H.; Cogliano, J.; Firestone, M.V.P.; Flowers, L.; Setzer, R.W.; Woodruff, T. USEPA. 2005, 3,630.
- Wu, B.; Zhang, Y.; Zhang, X.X.; Cheng, S.P. Sci. Total Environ. 2011;410-411,112-118.
- Census. census of India. In: Census of India. Vol 2011.; 2011.Semariya Palti Ojha – Bhojpur (/data/village/246610-semariya-palti-ojha-bihar.html)%0ASemariya.
- Yanez, L.M.; Alfaro, J.A.; Mitre, G.B. J. Environ. Manage. 2018, 218, 23-30.
- Li, Y.; Wang, Z.; Qin, F.; Fang, Z.; Li, X.; Li, G. J. Chem. 2018.
- Das, S.; Jean, J.; Kar, S. Ecotoxicol. Environ. Saf. 2013, 92, 252-257.
- Xiao, J.; Wang, L.; Deng, L.; Jin, Z.; Sci. Total Environ. 2019, 650, 4-12
- Satapathy, S.; Panda, C.R. Environ Geochem Health. 2018.
- Ahmed, K.; Shaheen, N.; Islam, S.; Sci Total Environ. 2016, 544, 125-133.
- Singh, U.K.; Ramanathan, AL.; Subramanian, V. Chemosphere. 2018, 204, 501-513.
- Kashyap, R.; Verma, K.S.; Uniyal, S.K. Environ. Monit. Assess. 2018, 190 (136).
- Ur, Z.; Khan, S.; Qin, K.; Brusseau, M.L.; Tahir, M.; Din, I. Sci. Total Environ. 2016, 550,321-329.
- Rasheed, H.; Slack, R.; Kay, P.; Yun, Y. Environ. Int. 2017,99,331-342.
- Rasheed, H.; Kay, P.; Slack, R.; Yun, Y. Sci. Total Environ. 2018, 634,366-373.
- Singh SK, Ghosh AK. Hum. and Ecolo. Risk Asses.: An Int. J. 2012,18,4, 751-766
- USEPA. Preliminary 2016 Effluent Guidelines Program Plan. 20460. 2016;(June).
- Ramirez-andreotta, M.D.; Brusseau, M.L.; Beamer, P.; Maier, R.M. Sci. Total Environ.2013,454-455,373-382.
- Singh, S.K.; Ghosh, A.K.; Kumar, A.; Kislay, K.; Kumar, C.;Tiwari, R.R.; Parwez, R.; Kumar, N. Imam, M.D. Int. J. Environ. Res. 2014,8(1), 49-60.

This work is licensed under a Creative Commons Attribution 4.0 International License.
![]()
A New Edition of Web of Science
Journal Impact Factor
2022: 0.5
Five Year: 0.8
Journal is Indexed in

Cabells Whitelist
![]()


